Abstract
Background
The role of long noncoding RNA (LncRNA) ADAMTS9 antisense RNA 2 (ADAMTS9-AS2) is unclear in lung adenocarcinoma (LUAD). The aim of this study was to explore the relationship between ADAMTS9-AS2 and LUAD, based on The Cancer Genome Atlas (TCGA) database and bioinformatics analysis.
Methods
Various statistical methods, Kaplan–Meier method, Cox regression analysis, GSEA, and immune infiltration analysis were used to evaluate the relationship between clinical features and ADAMTS9-AS2 expression, prognostic factors, and the significant involvement of ADAMTS9-AS2 in function.
Results
In LUAD patients, low expression of ADAMTS9-AS2 was associated with N stage (P=0.011), gender (P=0.002), number of packs smoked (P=0.024) and smoker (P<0.001). Low ADAMTS9-AS2 expression predicted a poorer overall survival (OS) (HR: 0.68; 95% CI: 0.51–0.91; P=0.01). And ADAMTS9-AS2 expression (HR: 0.626; 95% CI: 0.397–0.986; P=0.043) was independently correlated with OS in LUAD patients. Unwinding of DNA, extrinsic pathway, polo-like kinase-mediated events, cori cycle, MCM pathway, proteasome pathway, lagging strand synthesis and PCNA-dependent long patch base excision repair were differentially enriched in ADAMTS9-AS2 high expression phenotype. ADAMTS9-AS2 expression was correlated with certain immune infiltrating cells.
Conclusion
In LUAD patients, ADAMTS9-AS2 expression was significantly associated with poor survival and immune infiltration. ADAMTS9-AS2 may be a promising biomarker of prognosis and response to immunotherapy for LUAD.
Keywords: lung adenocarcinoma, ADAMTS9-AS2 antisense RNA 2, prognosis, immune infiltration, biomarker
Introduction
Lung cancer is the leading cause of cancer death worldwide.1 Lung adenocarcinoma (LUAD) is one of the histological types, accounting for about half of all lung cancers.2 Despite advances in new targeted therapies, chemotherapy, radiotherapy and surgical approaches, the 5-year survival rate for LUAD is only 20%.3 Identifying the underlying molecular mechanisms and important prognostic biomarkers of LUAD is crucial.
Long noncoding RNAs (lncRNAs) longer than 200 bp can interact with mRNAs, miRNAs, and circulating RNAs to participate in a complex network of gene expression regulation.4 Insights into the function of a few characteristic lncRNAs suggested a surprising diversity of cellular processes, from chromatin modification, transcription, splicing, and translation to cell differentiation, cell cycle regulation, and stem cell reprogramming.5 lncRNAs are involved in the development of some cancers.6 Aberrant lncRNAs are involved in the development and progression of LUAD.7–10 Therefore, screening for lncRNAs clinically relevant to LUAD is important for the diagnosis and treatment of LUAD.
ADAMTS9-AS2 and CADM2 expression were independent prognosis indicators in esophageal squamous cell carcinoma (ESCC) patients.11 ADAMTS9-AS2 could be a potential biomarker for patients with bladder cancer (BC).12 ADAMTS9-AS2 is a potential diagnostic and prognostic marker for prostate cancer (PCa).13 ADAMTS9-AS2 was significantly downregulated in LUAD.14 ADAMTS9-AS2 functions as a tumor suppressor in LUAD.15 Upregulation of lncRNA ADAMTS9-AS2 inhibits lung cancer progression by suppressing miR-223-3p and promoting TGFBR3.16 However, the correlation between ADAMTS9-AS2 and clinical characteristics of LUAD patients and immune infiltration has not been studied.
In this study, the correlation between ADAMTS9-AS2 expression levels and clinical features of LUAD was explored based on the Cancer Genome Atlas (TCGA) database and LUAD RNA-seq data in GTEx, comparing the difference in ADAMTS9-AS2 expression between tumor tissues and normal samples. The prognostic value of ADAMTS9-AS2 in LUAD was assessed. Through genomic enrichment analysis (GSEA), this study explored the function of ADAMTS9-AS2. By analyzing the correlation between ADAMTS9-AS2 expression and immune infiltration, this study explored the potential mechanisms by which ADAMTS9-AS2 regulates the occurrence and development of LUAD. This study may provide new directions for the development of diagnostic and therapeutic strategies for LUAD.
Materials and Methods
Differential Expression of ADAMTS9-AS2
The analysis of baseline information sheet was performed as described in the references.17,18 Molecule: ADAMTS9-AS2 [ENSG00000241684]. Subgroup: Median. Data: RNAseq data and clinical data in level 3 HTSeq-FPKM format from the TCGA (https://portal.gdc.cancer.gov/) LUAD (lung adenocarcinoma) project. Owing to the freely accessible resource TCGA database, the study let off the institutional review board approval of the ethics committee of Jiangmen Central Hospital. TCGA and GEO belong to public databases. The patients involved in the database have obtained ethical approval. Users can download relevant data for free for research and publish relevant articles. Our study is based on open source data, so there are no ethical issues and other conflicts of interest.
The analysis of unpaired samples was performed as described in the references.17,18 Molecule: ADAMTS9-AS2.
The analysis of paired samples was performed as described in the reference.17 Molecule: ADAMTS9-AS2.
ROC analysis was performed as described in the references.17,18 Molecule: ADAMTS9-AS2. Clinical variables: Tumor vs Normal.
The Relationship Between ADAMTS9-AS2 and Clinical Characteristics
Correlation analysis of gene expression with clinical characteristics was performed as described in the references.17,18 Molecule: ADAMTS9-AS2. Clinical variables: N stage, gender, number_pack_years_smoked, and smoker.
Logistics analysis was performed as described in the references.17,18 Dependent variable: ADAMTS9-AS2. Types of independent variables: Low High dichotomous.
The Relationship Between ADAMTS9-AS2 and Prognosis
Kaplan–Meier method analysis was performed as described in the references.17–19 Molecule: ADAMTS9-AS2. Subgroups: 0–50 vs 50–100. Prognosis type: overall survival (OS) and disease specific survival (DSS).
COX regression analysis was performed as described in the references.17–19 Prognosis type: OS. Included variables: clinical characteristics and ADAMTS9-AS2.
Gene Set Enrichment Analysis (GSEA)
Single gene differential analysis was performed as described in the references.17,18,20 Molecule: ADAMTS9-AS2. Low expression group: 0–50%. High expression group: 50–100%.
GSEA analysis was performed as described in the references.17,18,21,22 Reference gene set: c2.cp.v7.2.symbols.gmt [Curated].
Immune Infiltration Analysis by ssGSEA
The analysis was performed as described in the references.17,18,23,24 Molecule: ADAMTS9-AS2. Software: R (version 3.6.3). R package: GSVA package. Immuno-infiltration algorithm: ssGSEA.
Results
Clinical Characteristics
As shown in Table 1, the characteristics of patients including T stage, N stage, M stage, primary therapy outcome, pathologic stage, gender, race, age, residual tumor, anatomic neoplasm subdivision, anatomic neoplasm subdivision 2, number pack years smoked, and smoker were collected. A total of 535 patients were in this study. The age included 255 patients (≤65, 49.4%) and 261 patients (>65, 50.6%). The race included 406 White patients, 7 Asian patients, and 55 Black or African American patients. The age range was 59 to 72 years, with a median of 66 years. The pathologic stage included stage I in 294 patients (55.8%), stage II in 123 (23.3%), stage III in 84 (15.9%), and stage IV in 26 (4.9%). The primary therapy outcome included 71 PD (15.9%), 37 SD (8.3%), 6 PR (1.3%), and 332 (74.4%). The residual tumor included 355 R0 (95.5%), 13 R1 (3.5%), and 4 R2 (1.1%). The gender included 286 females (53.5%) and 248 males (46.5%). The anatomic neoplasm subdivision included 205 left (39.4%) and 315 right (60.6%). The anatomic neoplasm subdivision 2 included 62 central lung (32.8%) and 127 peripheral lung (67.2%). The number pack years smoked included 188 (<40, 50.9%) and 181 (≥40, 49.1%).
Table 1.
Characteristics of Patients with LUAD Based on TCGA
| Characteristic | Levels | Overall |
|---|---|---|
| n | 535 | |
| T stage, n (%) | T1 | 175 (32.9%) |
| T2 | 289 (54.3%) | |
| T3 | 49 (9.2%) | |
| T4 | 19 (3.6%) | |
| N stage, n (%) | N0 | 348 (67.1%) |
| N1 | 95 (18.3%) | |
| N2 | 74 (14.3%) | |
| N3 | 2 (0.4%) | |
| M stage, n (%) | M0 | 361 (93.5%) |
| M1 | 25 (6.5%) | |
| Primary therapy outcome, n (%) | PD | 71 (15.9%) |
| SD | 37 (8.3%) | |
| PR | 6 (1.3%) | |
| CR | 332 (74.4%) | |
| Pathologic stage, n (%) | Stage I | 294 (55.8%) |
| Stage II | 123 (23.3%) | |
| Stage III | 84 (15.9%) | |
| Stage IV | 26 (4.9%) | |
| Gender, n (%) | Female | 286 (53.5%) |
| Male | 249 (46.5%) | |
| Race, n (%) | Asian | 7 (1.5%) |
| Black or African American | 55 (11.8%) | |
| White | 406 (86.8%) | |
| Age, n (%) | ≤65 | 255 (49.4%) |
| >65 | 261 (50.6%) | |
| Residual tumor, n (%) | R0 | 355 (95.4%) |
| R1 | 13 (3.5%) | |
| R2 | 4 (1.1%) | |
| Anatomic neoplasm subdivision, n (%) | Left | 205 (39.4%) |
| Right | 315 (60.6%) | |
| Anatomic neoplasm subdivision 2, n (%) | Central Lung | 62 (32.8%) |
| Peripheral Lung | 127 (67.2%) | |
| Number_pack_years_smoked, n (%) | <40 | 188 (50.9%) |
| ≥40 | 181 (49.1%) | |
| Smoker, n (%) | No | 75 (14.4%) |
| Yes | 446 (85.6%) | |
| Age, median (IQR) | 66 (59, 72) |
ADAMTS9-AS2 Expression is Correlated with Poor Clinical Characteristics of LUAD
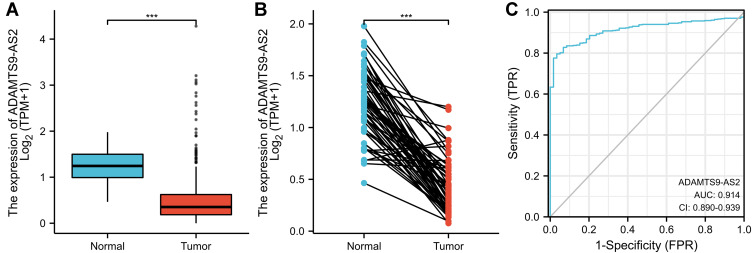
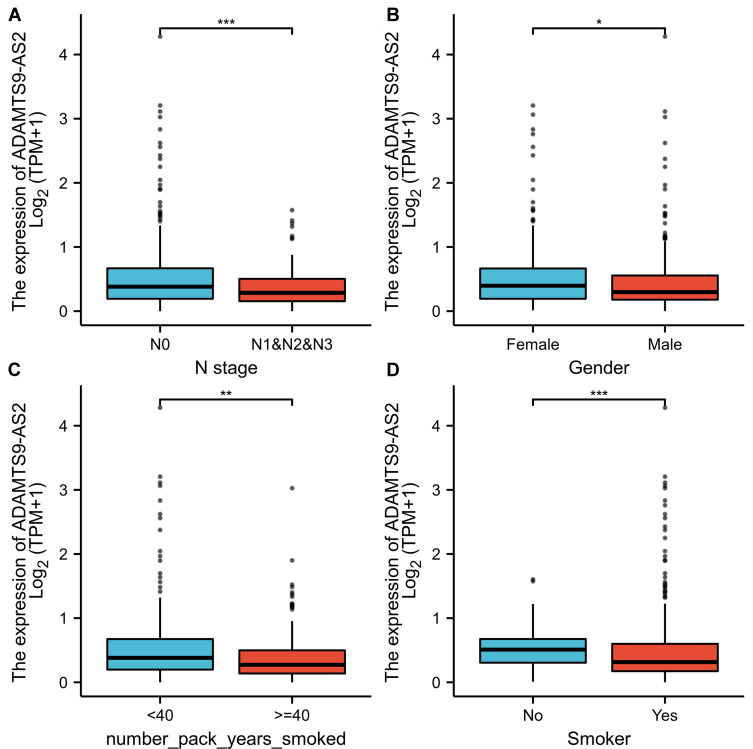
As shown in Figure 1A, ADAMTS9-AS2 was expressed lower in LUAD tissues than in normal tissues (p<0.001). As shown in Figure 1B, ADAMTS9-AS2 was expressed lower in LUAD tissues than in paired normal tissues (P<0.001). The area under curve (AUC) of ADAMTS9-AS2 was 0.914, suggesting that ADAMTS9-AS2 could be served as an ideal biomarker to distinguish LUAD from nontumor tissue (Figure 1C). LUAD patients were divided into high (n=268) and low (n=267) expression groups based on the mean of the relative expression of ADAMTS9-AS2. As shown in Table 2, ADAMTS9-AS2 expression was associated with N stage (P=0.044), gender (P=0.003), number of packs smoked (p=0.031) and smoker (P<0.001) in LUAD patients. Logistic regression method was also used to show the relationship between the clinical characteristics of LUAD and the expression level of ADAMTS9-AS2. The results in Figure 2 and Table 3 suggested that ADAMTS9-AS2 was significantly related to N stage (P=0.011), gender (P=0.002), number pack years smoked (P=0.024) and smoker (P<0.001).
Figure 1.
ADAMTS9-AS2 expression in LUAD is significantly lower than in normal or adjacent normal tissues. (A) Differential expression of ADAMTS9-AS2 in LUAD tissues and adjacent lung tissues. (B) Differential expression of ADAMTS9-AS2 in LUAD tissues and paired adjacent lung tissues. (C) Effectiveness of ADAMTS9-AS2 expression in distinguishing LUAD tissues from nontumor tissues (ROC curve). Significance markers: ***P<0.001.
Table 2.
Correlation Between ADAMTS9-AS2 Expression and Clinical Characteristics in LUAD
| Characteristic | Low Expression of ADAMTS9-AS2 | High Expression of ADAMTS9-AS2 | p |
|---|---|---|---|
| n | 267 | 268 | |
| T stage, n (%) | 0.162 | ||
| T1 | 79 (14.8%) | 96 (18%) | |
| T2 | 157 (29.5%) | 132 (24.8%) | |
| T3 | 24 (4.5%) | 25 (4.7%) | |
| T4 | 7 (1.3%) | 12 (2.3%) | |
| N stage, n (%) | 0.044 | ||
| N0 | 164 (31.6%) | 184 (35.5%) | |
| N1 | 54 (10.4%) | 41 (7.9%) | |
| N2 | 46 (8.9%) | 28 (5.4%) | |
| N3 | 1 (0.2%) | 1 (0.2%) | |
| M stage, n (%) | 1.000 | ||
| M0 | 182 (47.2%) | 179 (46.4%) | |
| M1 | 13 (3.4%) | 12 (3.1%) | |
| Primary therapy outcome, n (%) | 0.388 | ||
| PD | 40 (9%) | 31 (7%) | |
| SD | 20 (4.5%) | 17 (3.8%) | |
| PR | 2 (0.4%) | 4 (0.9%) | |
| CR | 156 (35%) | 176 (39.5%) | |
| Pathologic stage, n (%) | 0.102 | ||
| Stage I | 135 (25.6%) | 159 (30.2%) | |
| Stage II | 65 (12.3%) | 58 (11%) | |
| Stage III | 51 (9.7%) | 33 (6.3%) | |
| Stage IV | 13 (2.5%) | 13 (2.5%) | |
| Gender, n (%) | 0.003 | ||
| Female | 125 (23.4%) | 161 (30.1%) | |
| Male | 142 (26.5%) | 107 (20%) | |
| Race, n (%) | 0.233 | ||
| Asian | 4 (0.9%) | 3 (0.6%) | |
| Black or African American | 33 (7.1%) | 22 (4.7%) | |
| White | 194 (41.5%) | 212 (45.3%) | |
| Age, n (%) | 0.726 | ||
| ≤65 | 129 (25%) | 126 (24.4%) | |
| >65 | 127 (24.6%) | 134 (26%) | |
| Residual tumor, n (%) | 0.315 | ||
| R0 | 186 (50%) | 169 (45.4%) | |
| R1 | 4 (1.1%) | 9 (2.4%) | |
| R2 | 2 (0.5%) | 2 (0.5%) | |
| Anatomic neoplasm subdivision, n (%) | 0.748 | ||
| Left | 104 (20%) | 101 (19.4%) | |
| Right | 154 (29.6%) | 161 (31%) | |
| Anatomic neoplasm subdivision 2, n (%) | 0.356 | ||
| Central Lung | 29 (15.3%) | 33 (17.5%) | |
| Peripheral Lung | 70 (37%) | 57 (30.2%) | |
| Number_pack_years_smoked, n (%) | 0.031 | ||
| <40 | 89 (24.1%) | 99 (26.8%) | |
| ≥40 | 107 (29%) | 74 (20.1%) | |
| Smoker, n (%) | < 0.001 | ||
| No | 22 (4.2%) | 53 (10.2%) | |
| Yes | 239 (45.9%) | 207 (39.7%) | |
| Age, median (IQR) | 65 (57, 72) | 66 (60, 72) | 0.211 |
Figure 2.
Relationship between ADAMTS9-AS2 expression and clinical features of LUAD. (A) Relationship between ADAMTS9-AS2 expression and N stage. (B) Relationship between ADAMTS9-AS2 expression and gender. (C) Relationship between expression of ADAMTS9-AS2 and number pack years smoked. (D) Relationship between expression of ADAMTS9-AS2 and smoker. Significance markers: *P<0.05; **P<0.01; ***P<0.001.
Table 3.
Correlation of ADAMTS9-AS2 Expression with Clinical Features of LUAD (Logistic Regression)
| Characteristics | Total (N) | Odds Ratio (OR) | P value |
|---|---|---|---|
| T stage (T2&T3&T4 vs T1) | 532 | 0.740 (0.514–1.063) | 0.104 |
| N stage (N1&N2&N3 vs N0) | 519 | 0.618 (0.425–0.893) | 0.011 |
| M stage (M1 vs M0) | 386 | 0.939 (0.412–2.124) | 0.878 |
| Pathologic stage (Stage III&Stage IV vs Stage I&Stage II) | 527 | 0.662 (0.431–1.011) | 0.057 |
| Primary therapy outcome (CR vs PD&SD&PR) | 446 | 1.345 (0.879–2.066) | 0.173 |
| Gender (Male vs Female) | 535 | 0.585 (0.415–0.823) | 0.002 |
| Race (White vs Asian&Black or African American) | 468 | 1.617 (0.944–2.812) | 0.083 |
| Age (>65 vs ≤65) | 516 | 1.080 (0.765–1.526) | 0.661 |
| Residual tumor (R1&R2 vs R0) | 372 | 2.018 (0.751–5.967) | 0.176 |
| Anatomic neoplasm subdivision (Right vs Left) | 520 | 1.077 (0.757–1.531) | 0.681 |
| Anatomic neoplasm subdivision 2 (Peripheral Lung vs Central Lung) | 189 | 0.716 (0.388–1.315) | 0.282 |
| Number_pack_years_smoked (≥40 vs <40) | 369 | 0.622 (0.411–0.937) | 0.024 |
| Smoker (Yes vs No) | 521 | 0.360 (0.208–0.604) | <0.001 |
Association of ADAMTS9-AS2 with Survival in Patients with LUAD
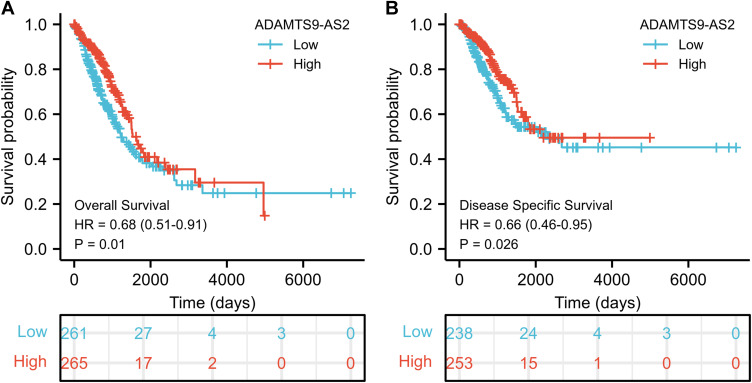
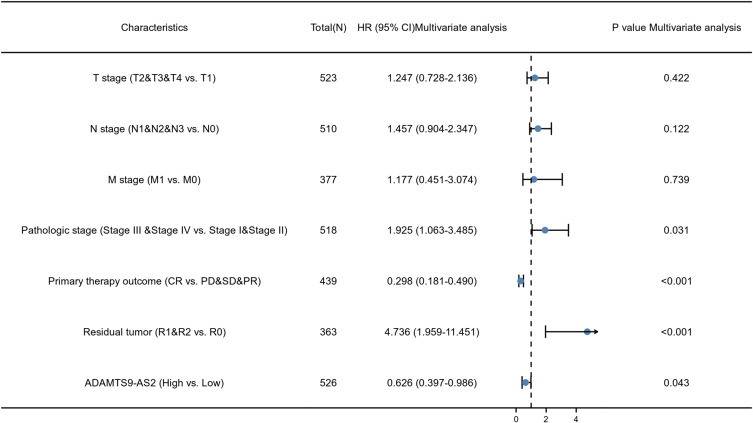
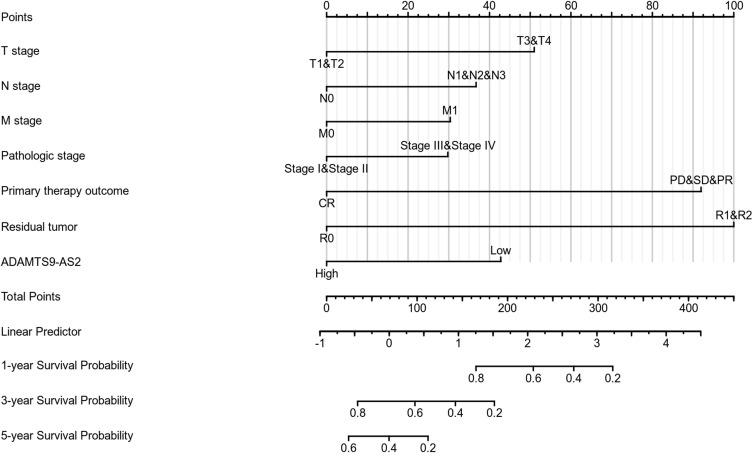
As shown in Figure 3, ADAMTS9-AS2 expression was positively correlated with poor overall survival (OS) (HR: 0.68; 95% CI: 0.51–0.91; P=0.01) and disease-specific survival (DSS) (HR: 0.66; 95% CI: 0.46–0.95; P=0.026) in LUAD patients. Univariate analysis of prognostic factors for OS with the Cox regression model in Table 4 showed that low ADAMTS9-AS2 expression levels (HR: 0.683; 95% CI: 0.511–0.914; P=0.010) were associated with T stage (HR: 1.728; 95% CI: 1.229–2.431; P=0.002), N stage (HR: 2.601; 95% CI: 1.944–3.480; P<0.001), M stage (HR: 2.136; 95% CI: 1.248–3.653; P=0.006), pathologic stage (HR: 2.664; 95% CI: 1.960–3.621; P<0.001), primary therapy (HR: 0.372; 95% CI: 0.265–0.521; P<0.001) and residual tumor (HR: 3.879; 95% CI: 2.169–6.936; P<0.001). As shown in Table 4 and Figure 4, ADAMTS9-AS2 expression (HR: 0.626; 95% CI: 0.397–0.986; P=0.043), pathologic stage (HR: 1.925; 95% CI: 1.063–3.485, P=0.031), primary therapy (HR: 0.298; 95% CI: 0.181–0.490; P<0.001) and residual tumor (HR: 4.736; 95% CI: 1.959–11.451; P<0.001) were independently correlated with OS in multivariate analysis. The above data indicated ADAMTS9-AS2 is a prognostic factor and decreased ADAMTS9-AS2 level is associated with poor OS. A nomogram was constructed to predict the 1-, 3-, and 5-year survival probability of LUAD patients by combining the expression level of ADAMTS9-AS2 with clinical variables (Figure 5).
Figure 3.
Low expression of ADAMTS9-AS2 is associated with poor OS and DSS in LUAD patients. (A) Kaplan–Meier curves and number at risk of OS in LUAD patients. (B) Kaplan–Meier curves and number at risk of DSS in LUAD patients.
Abbreviations: OS, overall survival; DSS, disease-specific survival.
Table 4.
Association Analysis of OS and Clinical Characteristics of LUAD Patients (Cox Regression)
| Characteristics | Total (N) | Univariate Analysis | Multivariate Analysis | ||
|---|---|---|---|---|---|
| Hazard Ratio (95% CI) | P value | Hazard Ratio (95% CI) | P value | ||
| T stage (T2&T3&T4 vs T1) | 523 | 1.728 (1.229–2.431) | 0.002 | 1.247 (0.728–2.136) | 0.422 |
| N stage (N1&N2&N3 vs N0) | 510 | 2.601 (1.944–3.480) | <0.001 | 1.457 (0.904–2.347) | 0.122 |
| M stage (M1 vs M0) | 377 | 2.136 (1.248–3.653) | 0.006 | 1.177 (0.451–3.074) | 0.739 |
| Pathologic stage (Stage III &Stage IV vs Stage I & Stage II) | 518 | 2.664 (1.960–3.621) | <0.001 | 1.925 (1.063–3.485) | 0.031 |
| Primary therapy outcome (CR vs PD&SD&PR) | 439 | 0.372 (0.265–0.521) | <0.001 | 0.298 (0.181–0.490) | <0.001 |
| Gender (Male vs Female) | 526 | 1.070 (0.803–1.426) | 0.642 | ||
| Race (White vs Asian & Black or African American) | 468 | 1.475 (0.902–2.411) | 0.121 | ||
| Age (>65 vs ≤65) | 516 | 1.223 (0.916–1.635) | 0.172 | ||
| Residual tumor (R1&R2 vs R0) | 363 | 3.879 (2.169–6.936) | <0.001 | 4.736 (1.959–11.451) | <0.001 |
| Anatomic neoplasm subdivision (Right vs Left) | 512 | 1.037 (0.770–1.397) | 0.810 | ||
| Anatomic neoplasm subdivision 2 (Peripheral Lung vs Central Lung) | 182 | 0.913 (0.570–1.463) | 0.706 | ||
| Number_pack_years_smoked (≥40 vs <40) | 363 | 1.073 (0.753–1.528) | 0.697 | ||
| Smoker (Yes vs No) | 512 | 0.894 (0.592–1.348) | 0.591 | ||
| ADAMTS9-AS2 (High vs Low) | 526 | 0.683 (0.511–0.914) | 0.010 | 0.626 (0.397–0.986) | 0.043 |
Figure 4.
Forest plot of the multivariate Cox regression analysis for LGG.
Figure 5.
Nomogram for predicting the probability of patients with 1-, 3- and 5-year overall survival.
ADAMTS9-AS2-Related Pathways (GSEA)
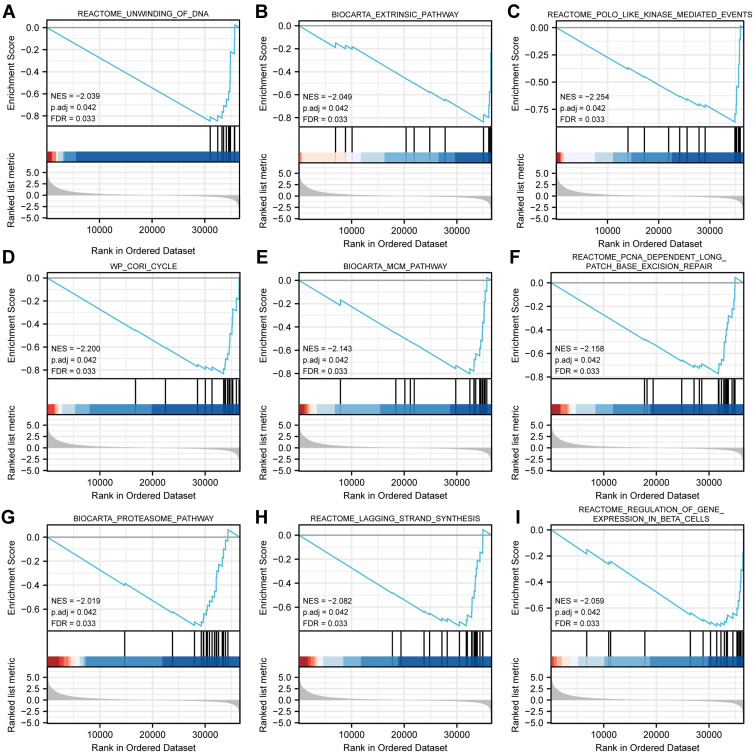
GSEA analysis identified 298 datasets that showed significant differential enrichment in the ADAMTS9-AS2 low expression phenotype, and we selected the top 9 datasets with low p-values, see Table 5 and Figure 6, including unwinding of DNA, extrinsic pathway, polo-like-kinase mediated events, cori cycle, MCM pathway, proteasome pathway, lagging strand synthesis, PCNA-dependent long patch base excision repair and regulation of gene expression in beta cells.
Table 5.
Gene Enrichment of ADAMTS9-AS2 High and Low Expression Groups (GSEA)
| Gene Set Name | NES | P Adjust | FDR |
|---|---|---|---|
| REACTOME_UNWINDING_OF_DNA | −2.039 | 0.042 | 0.033 |
| BIOCARTA_EXTRINSIC_PATHWAY | −2.049 | 0.042 | 0.033 |
| REACTOME_POLO_LIKE_KINASE_MEDIATED_EVENTS | −2.254 | 0.042 | 0.033 |
| WP_CORI_CYCLE | −2.200 | 0.042 | 0.033 |
| BIOCARTA_MCM_PATHWAY | −2.143 | 0.042 | 0.033 |
| BIOCARTA_PROTEASOME_PATHWAY | −2.019 | 0.042 | 0.033 |
| REACTOME_LAGGING_STRAND_SYNTHESIS | −2.082 | 0.042 | 0.033 |
| REACTOME_PCNA_DEPENDENT_LONG_PATCH_BASE_EXCISION_REPAIR | −2.158 | 0.042 | 0.033 |
| REACTOME_REGULATION_OF_GENE_EXPRESSION_IN_BETA_CELLS | −2.059 | 0.042 | 0.033 |
Abbreviations: NES, normalized enrichment score; FDR, false discovery rate.
Figure 6.
Enrichment plots from GSEA. (A) Unwinding of DNA, (B) extrinsic pathway, (C) polo-like kinase mediated events, (D) cori cycle, (E) MCM pathway, (F) PCNA-dependent long complement base excision repair, (G) proteasome pathway, (H) lagging strand synthesis, (I) regulation of gene expression in beta cells.
Abbreviations: NES, normalized es; FDR, false discovery rate.
Correlation Between the Expression of ADAMTS9-AS2 and Immune Infiltration
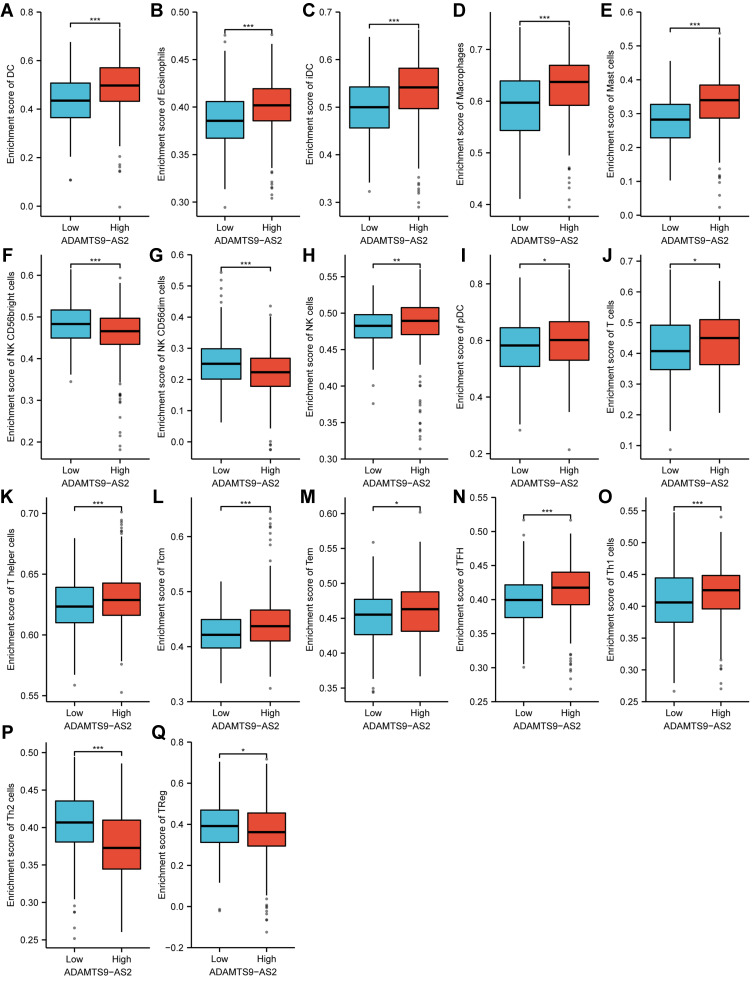
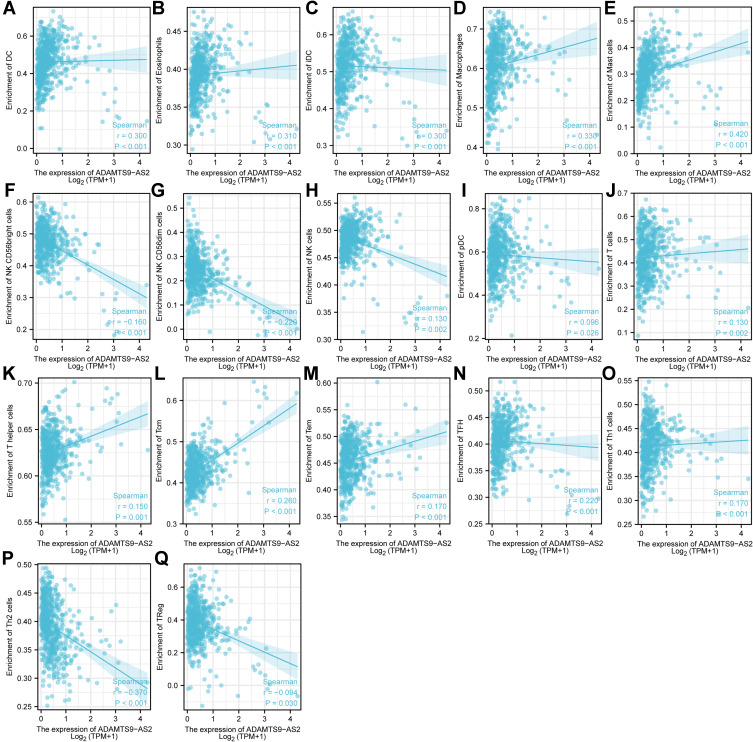
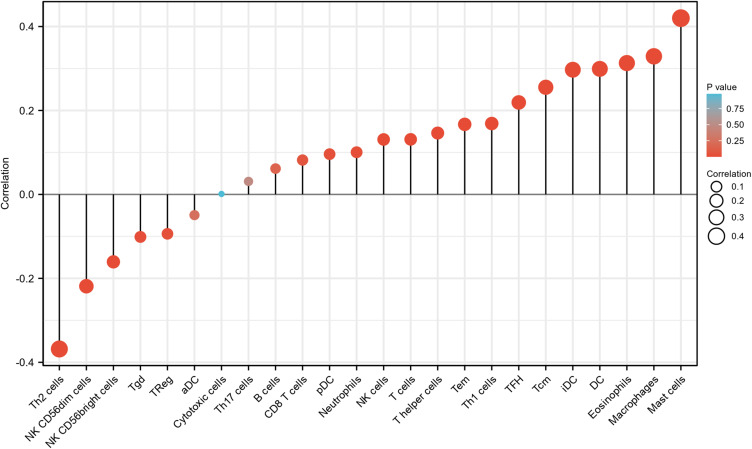
As shown in Figures 7–9, the expression of ADAMTS9-AS2 was negatively correlated with infiltration levels of NK CD56bright cells (P<0.001), NK CD56dim cells (P<0.001), Th2 cells (P<0.001) and TReg (P=0.03), and positively correlated with that of DC (P<0.001), Eosinophils (P<0.001), iDC (P<0.001), Macrophages (P<0.001), Mast cells (P<0.001), NK cells (P=0.002), pDC (P=0.027), T cells (P=0.002), T helper cells (P<0.001), Tcm (P<0.001), Tem (P<0.001), TFH (P<0.001) and Th1 cells (P<0.001).
Figure 7.
Expression of ADAMTS9-AS2 correlated with immune cells in LUAD patients (grouped comparison chart). (A) DC, (B) Eosinophils, (C) iDC, (D) Macrophages, (E) Mast cells, (F) NK CD56bright cells, (G) NK CD56dim cells, (H) NK cells, (I) pDC, (J) T cells, (K) T helper cells, (L) Tcm, (M) Tem, (N) TFH, (O) Th1 cells, (P) Th2 cells, and (Q) TReg. Significance markers: *P<0.05; **P<0.01; ***P<0.001.
Figure 8.
Expression of ADAMTS9-AS2 correlated with immune cells in LUAD patients (scatter plot). (A) DC, (B) Eosinophils, (C) iDC, (D) Macrophages, (E) Mast cells, (F) NK CD56bright cells, (G) NK CD56dim cells, (H) NK cells, (I) pDC, (J) T cells, (K) T helper cells, (L) Tcm, (M) Tem, (N) TFH, (O) Th1 cells, (P) Th2 cells, and (Q) TReg.
Figure 9.
ADAMTS9-AS2 expression correlated with 24 immune cells in LUAD patients (lollipop chart).
Discussion
A growing number of studies have shown that long noncoding RNAs (lncRNAs) play an important role in tumorigenesis and development. lncRNA CTB-193M12.5 is a prognostic factor in LUAD.7 FENDRR and FOXF1 expression is reduced in LUAD and should be considered as new potential prognostic biomarkers.8 Novel lncRNA UPLA1 promotes LUAD progression and can be used as a prognostic marker.9 High expression of MIR31HG is an independent adverse prognostic factor for patients with LUAD.10 Therefore, it is important to study lncRNAs as new LUAD biomarkers and therapeutic targets in the future.
ADAMTS9-AS2 is downregulated in non-small cell lung cancer (NSCLC) tissues.25 ADAMTS9-AS2 expression was significantly correlated with clinical stage and tumor size in PCa.13 Reduced ADAMTS9-AS2 expression correlates with TNM staging in NSCLC patients (P < 0.001).26 In this study, ADAMTS9-AS2 was found to be significantly associated with N stage (P=0.011), gender (P=0.002), number of packs smoked (P=0.024) and smoker (P<0.001). LUAD expressed less ADAMTS9-AS2 than normal lung tissue, especially in patients with N1&N2&N3 compared to N0. Expression of ADAMTS9-AS2 was lower in male patients compared to female patients, smokers compared to nonsmokers, and patients who had smoked for more than 40 years compared to those who had smoked for less than 40 years. These phenomena suggest that ADAMTS9-AS2 is associated with an increased degree and extent of lymph node involvement and the development of lung adenocarcinoma. Low ADAMTS9-AS2 was positively correlated with poor OS (HR: 0.68; 95% CI: 0.51–0.91; P=0.01) and DSS (HR: 0.66; 95% CI: 0.46–0.95; P=0.026) of LUAD patients. ADAMTS9-AS2 expression (HR: 0.626; 95% CI: 0.397–0.986; P=0.043) was an independently correlated with OS in LUAD patients.
lncRNA ADAMTS9-AS2 reduces the progression of ovarian cancer by regulating the miR-182-5p/FOXF2 axis.27 ADAMTS9-AS2 has a clear oncogenic role in tongue squamous cell carcinoma (TSCC) tumorigenesis by competing with miR-600/ EZH2 axis.28 ADAMTS9-AS2 regulates SPOP expression in gastric cancer (GC) cells and tumor spheroid cells to inhibit GC progression.29 Overexpression of ADAMTS9-AS2 contributes to the inhibition of oesophageal cancer development, which is achieved through the induction of CDH3 promoter methylation.30 ADAMTS9-AS2 is a tumor suppressor that inhibits BC cell proliferation and induces apoptosis by targeting miR-182-5p.31 ADAMTS9-AS2 inhibited PI3K/AKT/mTOR signaling pathway and thereby suppressed the proliferation, migration, and invasion of hepatocellular carcinoma cells.32 In this study, based on GESA, ADAMTS9-AS2 was related to pathways including unwinding of DNA, extrinsic pathway, polo-like kinase-mediated events, cori cycle, MCM pathway, proteasome pathway, lagging strand synthesis, PCNA-dependent long patch base excision repair and regulation of gene expression in beta cells.
Tumor-infiltrating immune cells in lung cancer may be an important determinant of prognosis and response to immunotherapy.33 This study was also innovative in that it explored the relationship between ADAMTS9-AS2 expression and multiple immune infiltrating cells in LUAD. A moderate correlation was found between the expression of ADAMTS9-AS2 and the level of DC, Eosinophils, iDC, Macrophages, Mast cells, NK CD56bright cells, NK CD56dim cells, NK cells, pDC, T cells, T helper cells, Tcm, Tem, TFH, Th1 cells, Th2 cells, and TReg in LUAD. These correlations may suggest potential mechanisms by which ADAMTS9-AS2 inhibits the function of NK CD56bright cells, NK CD56dim cells, Th2 cells and TReg, and subsequently promotes the function of DC, Eosinophils, iDC, Macrophages, Mast cells, NK cells, pDC, T cells, T helper cells, Tcm, Tem, TFH and Th1 cells.
Despite some limitations, this study systematically investigated the relationship between ADAMTS9-AS2 and LUAD. This study was performed based on RNA sequencing from the TCGA database. We were unable to illustrate the expression of ADAMTS9-AS2 at the protein level or to clearly evaluate the direct mechanism of ADAMTS9-AS2 involvement in LUAD. The results of the bioinformatics analysis need to be confirmed by some additional experiments. Further studies are needed regarding the direct mechanism of ADAMTS9-AS2-mediated LUAD.
Conclusion
ADAMTS9-AS2 was lowly expressed in LUAD relative to normal tissue and related to poor OS and DSS. Low expression of ADAMTS9-AS2 was associated with N stage, gender, number of packs smoked and smoker. ADAMTS9-AS2 might participate in the development of LUAD by pathways including unwinding of DNA, extrinsic pathway, polo-like kinase mediated events, cori cycle, MCM pathway, proteasome pathway, lagging Strand Synthesis, PCNA-dependent long patch base excision repair and regulation of gene expression in beta cells. ADAMTS9-AS2 expression was related to immune infiltrating cells. The present study described the role of ADAMTS9-AS2 in LUAD, implying that ADAMTS9-AS2 was a promising biomarker of prognosis and response to immunotherapy for LUAD.
Acknowledgments
The datasets generated in this study are available from TCGA that provide free resources.
Funding Statement
This work was supported by Medical scientific Research Foundation of Guangdong Province of China (A2016419 and B2018239), the Bethune Charitable Foundation (HZB-20181119-29).
Data Sharing Statement
The data used to support the findings of this study are available upon request from Zhichao Lin.
Ethical Statement
The authors are accountable for all aspects of the work in ensuring that questions related to the accuracy or integrity of any part of the work are appropriately investigated and resolved. The study was conducted in accordance with the Declaration of Helsinki (as revised in 2013).
Author Contributions
All authors made a significant contribution to the work reported, whether that is in the conception, study design, execution, acquisition of data, analysis and interpretation, or in all these areas; took part in drafting, revising or critically reviewing the article; gave final approval of the version to be published; have agreed on the journal to which the article has been submitted; and agree to be accountable for all aspects of the work.
Disclosure
The authors declare that they have no conflicts of interest relevant to this study.
References
- 1.Siegel RL, Miller KD, Jemal A. Cancer statistics, 2020. CA Cancer J Clin. 2020;70:7–30. [DOI] [PubMed] [Google Scholar]
- 2.Travis WD. Lung cancer pathology: current concepts. Clin Chest Med. 2020;41:67–85. doi: 10.1016/j.ccm.2019.11.001 [DOI] [PubMed] [Google Scholar]
- 3.Testa U, Castelli G, Pelosi E. Lung cancers: molecular characterization, clonal heterogeneity and evolution, and cancer stem cells. Cancers. 2018;10(8):248. doi: 10.3390/cancers10080248 [DOI] [PMC free article] [PubMed] [Google Scholar]
- 4.Huo C, Zhang M-Y, Li R, et al. Comprehensive analysis of TPX2-related ceRNA network as prognostic biomarkers in lung adenocarcinoma. Int J Med Sci. 2020;17(16):2427–2439. doi: 10.7150/ijms.49053 [DOI] [PMC free article] [PubMed] [Google Scholar]
- 5.Yang G, Lu X, Yuan L. LncRNA: a link between RNA and cancer. Biochim Biophys Acta. 2014;1839(11):1097–1109. doi: 10.1016/j.bbagrm.2014.08.012 [DOI] [PubMed] [Google Scholar]
- 6.Chen R, Xia W, Wang S, et al. Long noncoding RNA SBF2-AS1 is critical for tumorigenesis of early-stage lung adenocarcinoma. Mol Ther Nucleic Acids. 2019;16:543–553. doi: 10.1016/j.omtn.2019.04.004 [DOI] [PMC free article] [PubMed] [Google Scholar]
- 7.Wang X, Li G, Luo Q, Xie J, Gan C. Integrated TCGA analysis implicates lncRNA CTB-193M12.5 as a prognostic factor in lung adenocarcinoma. Cancer Cell Int. 2018;18(1):27. doi: 10.1186/s12935-018-0513-3 [DOI] [PMC free article] [PubMed] [Google Scholar]
- 8.Herrera-Merchan A, Cuadros M, Rodriguez MI, et al. The value of lncRNA FENDRR and FOXF1 as a prognostic factor for survival of lung adenocarcinoma. Oncotarget. 2020;11(13):1172–1185. doi: 10.18632/oncotarget.22154 [DOI] [PMC free article] [PubMed] [Google Scholar]
- 9.Han X, Jiang H, Qi J, et al. Novel lncRNA UPLA1 mediates tumorigenesis and prognosis in lung adenocarcinoma. Cell Death Dis. 2020;11:999. doi: 10.1038/s41419-020-03198-y [DOI] [PMC free article] [PubMed] [Google Scholar]
- 10.Qin J, Ning H, Zhou Y, Hu Y, Yang L, Huang R. LncRNA MIR31HG overexpression serves as poor prognostic biomarker and promotes cells proliferation in lung adenocarcinoma. Biomed Pharmacother. 2018;99:363–368. doi: 10.1016/j.biopha.2018.01.037 [DOI] [PubMed] [Google Scholar]
- 11.Shen FF, Zhang F, Yang HJ, et al. ADAMTS9-AS2 and CADM2 expression and association with the prognosis in esophageal squamous cell carcinoma. Biomark Med. 2020;14:1415–1426. doi: 10.2217/bmm-2020-0432 [DOI] [PubMed] [Google Scholar]
- 12.Zhang Z, Jia JP, Zhang YJ, Liu G, Zhou F, Zhang BC. Long noncoding RNA ADAMTS9-AS2 inhibits the proliferation, migration, and invasion in bladder tumor cells. Onco Targets Ther. 2020;13:7089–7100. doi: 10.2147/OTT.S245826 [DOI] [PMC free article] [PubMed] [Google Scholar]
- 13.He L, Xiao Y, Ma L, Zhao F, Yu T, Huang Y. ADAMTS9-AS2: a potential diagnostic and prognostic hallmark in prostate cancer. J BUON. 2021;26:1623–1627. [PubMed] [Google Scholar]
- 14.Jin D, Song Y, Chen Y, Zhang P. Identification of three lncRNAs as potential predictive biomarkers of lung adenocarcinoma. Biomed Res Int. 2020;2020:7573689. doi: 10.1155/2020/7573689 [DOI] [PMC free article] [PubMed] [Google Scholar]
- 15.Liu W, Luo W, Zhou P, Cheng Y, Qian L. Bioinformatics analysis and functional verification of ADAMTS9-AS1/AS2 in lung adenocarcinoma. Front Oncol. 2021;11:681777. doi: 10.3389/fonc.2021.681777 [DOI] [PMC free article] [PubMed] [Google Scholar]
- 16.Liu C, Yang Z, Deng Z, et al. Upregulated lncRNA ADAMTS9-AS2 suppresses progression of lung cancer through inhibition of miR-223-3p and promotion of TGFBR3. IUBMB Life. 2018;70(6):536–546. doi: 10.1002/iub.1752 [DOI] [PubMed] [Google Scholar]
- 17.Chen T, Zhu C, Wang X, Pan Y, Granito A. LncRNA ELF3-AS1 is a prognostic biomarker and correlated with immune infiltrates in hepatocellular carcinoma. Can J Gastroenterol Hepatol. 2021;2021:8323487. doi: 10.1155/2021/8323487 [DOI] [PMC free article] [PubMed] [Google Scholar]
- 18.Xu H, Wang H, Li G, Jin X, Chen B. The immune-related gene ELF3 is a novel biomarker for the prognosis of ovarian cancer. Int J Gen Med. 2021;14:5537–5548. doi: 10.2147/IJGM.S332320 [DOI] [PMC free article] [PubMed] [Google Scholar]
- 19.Liu J, Lichtenberg T, Hoadley KA, et al. An integrated TCGA pan-cancer clinical data resource to drive high-quality survival outcome analytics. Cell. 2018;173:400–416.e411. [DOI] [PMC free article] [PubMed] [Google Scholar]
- 20.Love MI, Huber W, Anders S. Moderated estimation of fold change and dispersion for RNA-seq data with DESeq2. Genome Biol. 2014;15(12):550. doi: 10.1186/s13059-014-0550-8 [DOI] [PMC free article] [PubMed] [Google Scholar]
- 21.Yu G, Wang LG, Han Y, He QY. clusterProfiler: an R package for comparing biological themes among gene clusters. OMICS. 2012;16:284–287. doi: 10.1089/omi.2011.0118 [DOI] [PMC free article] [PubMed] [Google Scholar]
- 22.Subramanian A, Tamayo P, Mootha VK, et al. Gene set enrichment analysis: a knowledge-based approach for interpreting genome-wide expression profiles. Proc Natl Acad Sci U S A. 2005;102:15545–15550. doi: 10.1073/pnas.0506580102 [DOI] [PMC free article] [PubMed] [Google Scholar]
- 23.Hänzelmann S, Castelo R, Guinney J. GSVA: gene set variation analysis for microarray and RNA-seq data. BMC Bioinform. 2013;14:7. doi: 10.1186/1471-2105-14-7 [DOI] [PMC free article] [PubMed] [Google Scholar]
- 24.Bindea G, Mlecnik B, Tosolini M, et al. Spatiotemporal dynamics of intratumoral immune cells reveal the immune landscape in human cancer. Immunity. 2013;39:782–795. doi: 10.1016/j.immuni.2013.10.003 [DOI] [PubMed] [Google Scholar]
- 25.Acha-Sagredo A, Uko B, Pantazi P, et al. Long non-coding RNA dysregulation is a frequent event in non-small cell lung carcinoma pathogenesis. Br J Cancer. 2020;122:1050–1058. doi: 10.1038/s41416-020-0742-9 [DOI] [PMC free article] [PubMed] [Google Scholar]
- 26.Abdul-Maksoud RS, Rashad NM, Elsayed WSH, et al. The diagnostic significance of circulating lncRNA ADAMTS9-AS2 tumor biomarker in non-small cell lung cancer among the Egyptian population. J Gene Med. 2021;e3381. doi: 10.1002/jgm.3381 [DOI] [PubMed] [Google Scholar]
- 27.Wang A, Jin C, Li H, Qin Q, Li L. LncRNA ADAMTS9-AS2 regulates ovarian cancer progression by targeting miR-182-5p/FOXF2 signaling pathway. Int J Biol Macromol. 2018;120:1705–1713. doi: 10.1016/j.ijbiomac.2018.09.179 [DOI] [PubMed] [Google Scholar]
- 28.Li Y, Wan Q, Wang W, et al. LncRNA ADAMTS9-AS2 promotes tongue squamous cell carcinoma proliferation, migration and EMT via the miR-600/EZH2 axis. Biomed Pharmacother. 2019;112:108719. doi: 10.1016/j.biopha.2019.108719 [DOI] [PubMed] [Google Scholar]
- 29.Wang F, Tang C, Xu D, et al. LncRNA ADAMTS9-AS2 suppresses the proliferation of gastric cancer cells and the tumorigenicity of cancer stem cells through regulating SPOP. J Cell Mol Med. 2020;24:4830–4838. doi: 10.1111/jcmm.15161 [DOI] [PMC free article] [PubMed] [Google Scholar]
- 30.Liu D, Wu K, Yang Y, Zhu D, Zhang C, Zhao S. Long noncoding RNA ADAMTS9-AS2 suppresses the progression of esophageal cancer by mediating CDH3 promoter methylation. Mol Carcinog. 2020;59:32–44. doi: 10.1002/mc.23126 [DOI] [PubMed] [Google Scholar]
- 31.Guo Q, Ni P, Dai Y, Hu J, Yao Y. Long-chain noncoding RNA ADAMTS9-AS2 regulates proliferation, migration, and apoptosis in bladder cancer cells through regulating miR-182-5p. J Interferon Cytokine Res. 2021;41:60–71. doi: 10.1089/jir.2020.0137 [DOI] [PubMed] [Google Scholar]
- 32.Li H, Huang H, Li S, Mei H, Cao T, Lu Q. Long non-coding RNA ADAMTS9-AS2 inhibits liver cancer cell proliferation, migration and invasion. Exp Ther Med. 2021;21:559. doi: 10.3892/etm.2021.9991 [DOI] [PMC free article] [PubMed] [Google Scholar]
- 33.Liu X, Wu S, Yang Y, Zhao M, Zhu G, Hou Z. The prognostic landscape of tumor-infiltrating immune cell and immunomodulators in lung cancer. Biomed Pharmacother. 2017;95:55–61. doi: 10.1016/j.biopha.2017.08.003 [DOI] [PubMed] [Google Scholar]


