Abstract
Whilst Monte Carlo (MC) simulations of proton energy deposition have been well-validated at the macroscopic level, their microscopic validation remains lacking. Equally, no gold-standard yet exists for experimental metrology of individual proton tracks. In this work we compare the distributions of stochastic proton interactions simulated using the TOPAS-nBio MC platform against confocal microscope data for Al2O3:C,Mg Fluorescent Nuclear Track Detectors (FNTDs). We irradiated 8×4×0.5 mm3 FNTD chips inside a water phantom, positioned at 7 positions along a pristine proton Bragg peak with a range in water of 12 cm. MC simulations were implemented in two stages: (1) using TOPAS to model the beam properties within a water phantom and (2) using TOPAS-nBio with Geant4-DNA physics to score particle interactions through a water surrogate of Al2O3:C,Mg. The measured median track integrated brightness (IB) was observed to be strongly correlated to both (i) voxelized track-averaged linear energy transfer (LET) and (ii) frequency mean microdosimetric lineal energy, , both simulated in pure water. Histograms of FNTD track IB were compared against TOPAS-nBio histograms of the number of terminal electrons per proton, scored in water with mass-density scaled to mimic Al2O3:C,Mg. Trends between exposure depths observed in TOPAS-nBio simulations were experimentally replicated in the study of FNTD track IB. Our results represent an important first step towards the experimental validation of MC simulations on the sub-cellular scale and suggest that FNTDs can enable experimental study of the microdosimetric properties of individual proton tracks.
1. Introduction
At present radiotherapy prescriptions are based on the macroscopic quantity absorbed dose-to-water and proton prescriptions are derived by dividing photon prescriptions by a fixed Relative Biological Effectiveness (RBE) of 1.1. However, both the quality and microscopic track structure of a proton beam vary substantially with penetration depth. In vitro experiments demonstrate that enhanced levels of cell kill occur as protons near the end of their range (Guan et al. 2015). It is anticipated that improved characterisation of stochastic proton energy deposition on the sub-cellular scale will play an important role in the mathematical modelling of cell kill (Tommasino and Durante 2015), and perhaps ultimately the optimisation of proton treatment planning. One widely studied stochastic quantity is lineal energy, y, defined as the total energy imparted by a single primary particle, divided by the mean chord length for a scoring sphere (Kellerer 1985). y is often considered as the microscopic analogue to linear energy transfer (LET) and has been utilised in variable RBE modelling, for example by Hawkins (1994). Monte Carlo (MC) simulations enable us to easily obtain both (a) detailed geometric representations of charged particle tracks and (b) values for y and (the expectation value of y), on the basis of known and interpolated particle interaction cross sections (Incerti et al. 2010a). But to date, experimental validation of simulations at the microscopic level remains lacking as no gold-standard yet exists for experimental metrology of individual proton tracks. In this work we compare results for proton energy depositions simulated using the TOPAS-nBio MC framework, which incorporates Geant4-DNA physics models (Incerti et al. 2010b), against confocal microscope data for Fluorescent Nuclear Track Detectors (FNTDs).
FNTDs are made of dielectric aluminum oxide doped with carbon and magnesium: Al2O3:C,Mg. The doping introduces oxygen vacancies in the Al2O3 lattice forming electronic defects known as “F-centres” or “colour-centres’ (Akselrod et al. 2003). Most of the “F-centres” in Al2O3:C,Mg crystals contain oxygen vacancy defects (Akselrod et al. 2003). Occupancy of an oxygen vacancy by two electrons gives rise to a neutral F-centre, whereas occupancy of an oxygen vacancy by one electron forms an F+-centre. In Al2O3:C,Mg the relevant lattice defect for radiation measurement purposes is two F+-centres charge-compensated by two Mg-impurity atoms: a F22+(2Mg)-centre (Akselrod et al. 2003). It is believed that F22+(2Mg)-centres efficiently capture thermalized, free electrons liberated by ionizing radiation, undergoing radiochromic transformation into a three-electron state to form F2+(2Mg)-centres (Akselrod et al. 2011). These thermalized, free electrons are thought to be the secondary electrons produced from direct ionization by the proton or heavy ion interactions with the oxygen and aluminium atoms from the Al2O3:C,Mg lattice. Most of the secondary electrons have very low energies and are captured by F22+(2Mg)-centres soon after generation. High energy secondary electrons are thought to also produce direct ionization of oxygen and aluminum atoms within Al2O3:C,Mg, producing low energy tertiary electrons which in turn are captured by F22+(2Mg)-centers soon after release. Thus, it is believed that the spatial distribution of F2+(2Mg)-centers forms an accurate representation of ionization events in the Al2O3:C,Mg lattice. F2+(2Mg)-centres can be interrogated non-destructively using laser excitation-emission (without photoionisation), with excitation and emission bands centred at 620 nm and 750 nm, respectively (Akselrod and Sykora 2011). When combined with a confocal laser scanning microscope, FNTDs allow for the detection of the secondary and tertiary electrons associated with individual tracks of primary ionizing radiation with very high spatial resolution (Sykora et al. 2008), i.e. limited only by light diffraction.
Over recent years FNTDs have been increasingly applied to clinical ion-beam research (Greilich et al. 2013), with multiple studies using the detectors to investigate the energy deposition of individual carbon ions from therapeutic beams (Kouwenberg et al. 2016), (Niklas et al. 2013). For protons with track-averaged LET values in water ≤2.28 keV/μm, Sawakuchi et al. (2016) demonstrated that FNTD track amplitude histograms could be mapped to LET spectra, where energy spectra were simulated using the TOPAS Monte Carlo platform and then converted to LET spectra by means of a lookup table. In this study we:
verify the work of Sawakuchi et al. (2016) and consider a greater range of track-averaged LET values scored in water (up to a maximum of ≈6.3 keV/μm).
investigate the potential of FNTDs as a tool to measure biologically relevant microdosimetric quantities, by comparing our FNTD data to TOPAS-nBio simulations of frequency mean microdosimetric lineal energy, , scored in water.
contribute to the experimental validation of TOPAS-nBio simulations, by comparing the number of terminal electrons per proton, scored in density-scaled water, against stochastic, experimental histograms of FNTD track integrated brightness.
2. Methods
2.1. Detectors and irradiation conditions
We used 8×4×0.5mm3 FNTD chips with one surface polished to optical grade, available commercially from Landauer, Inc., (Crystal Growth Division, Stillwater, OK) together with a custom-designed holder. Our holder enables simultaneous irradiation of up to 48 FNTDs positioned in 2 mm and 4 mm intervals in depth (50 mm or 70 mm off-axis) within a water tank, providing accurate relative positioning whilst ensuring that no detector directly shields another from an incoming proton beam. The holder was constructed from polystyrene, with mass density ≈1.04 g/cm3. Images of the FNTD holder and of the experimental set-up are shown in figure 1.
Figure 1.
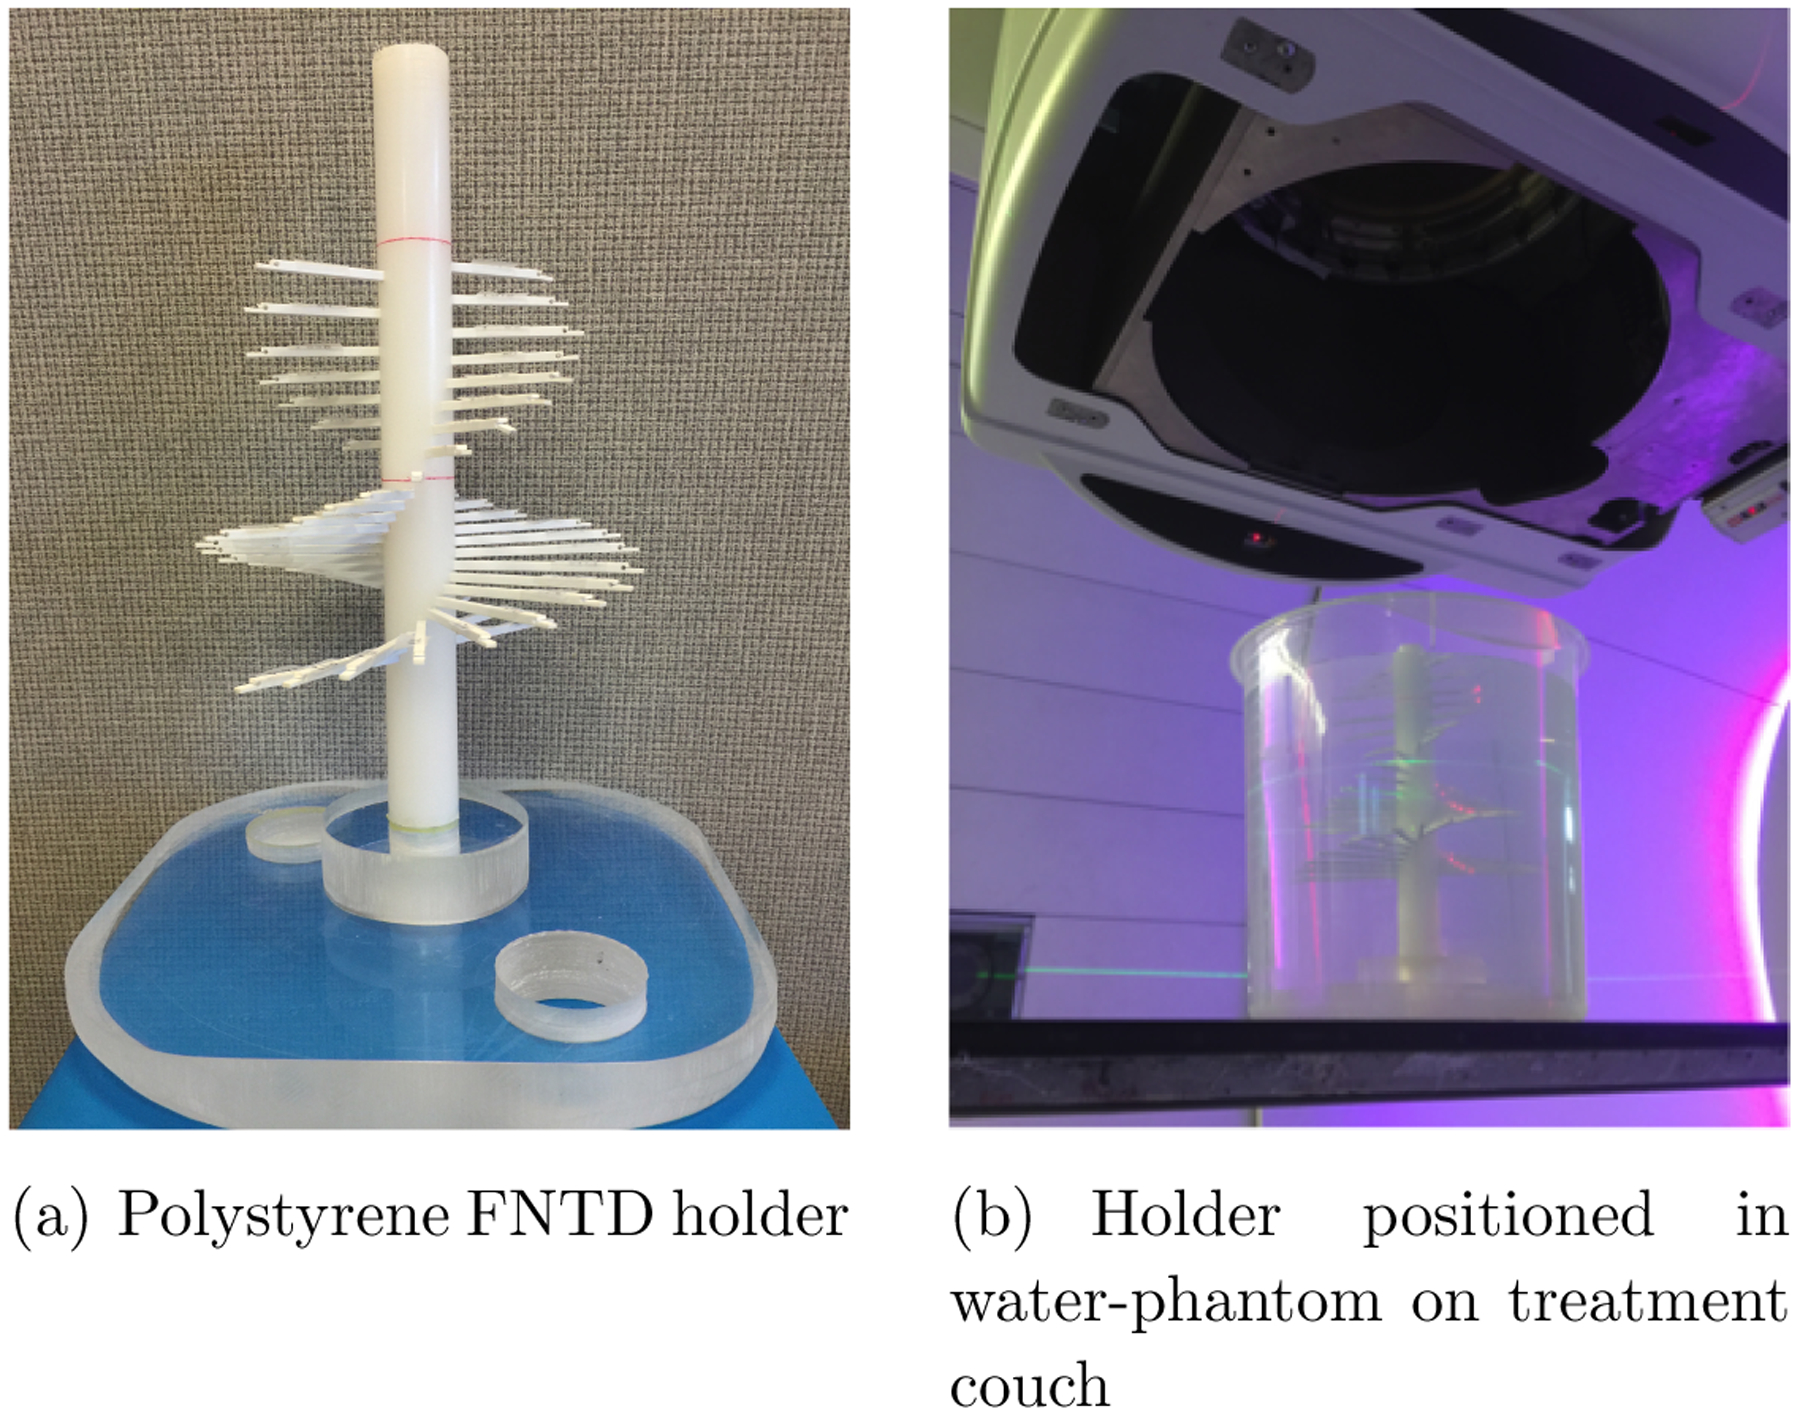
The experimental set-up at the Francis H Burr Proton Therapy Center.
FNTDs were positioned with their polished surface facing the incoming beam. Due to microscope scanning time constraints, FNTDs at seven nominal water depths (12, 30, 108, 112, 116, 120 and 128 mm) were investigated. These FNTD depths were selected to cover the entire proton Bragg Peak from the entrance region to the distal fallo. The detectors were irradiated with a passively scattered, unmodulated, 125 MeV proton beam at the Francis H Burr Proton Therapy Center, Massachusetts General Hospital (Boston, MA, USA). The corresponding beam range in water was 12 cm (distal 90% dose level). The gantry angle used was 0°. A peak dose of ≈0.07 Gy was delivered, corresponding to 3 monitor units on our machine. The field diameter was 25 cm as defined at isocentre.
2.2. Microscope readouts
After irradiation the FNTDs were scanned at The University of Texas MD Anderson Cancer Center, using a confocal microscope (FV1200, Olympus America, Inc. Center Valley, PA) with a custom high-power red laser (641 nm, 80 mW) and an oil-immersion objective lens (UPLSAPO60XO, NA=1.35, Olympus America, Inc.). This was the same equipment used by Sawakuchi et al. (2016).
We used a similar readout protocol as the one described by Sawakuchi et al. (2016). Briefly, ten slice image stacks (with a slice thickness of 2 μm, starting at a depth of 10 μm from the polished FNTD surface) were acquired for multiple lateral positions, typically 6 or 10 over each FNTD. A single set of imaging parameters was selected for all FNTDs, with the track amplitudes from the lowest and highest LET proton tracks contained within the 12-bit range (avoiding pixel saturation). The imaging parameters were: 512 × 512 pixels = 42.426 μm × 42.426 μm; dwell time per pixel = 100 μs; pinhole diameter = 105μm; number of Kalman line averages = 5, dichroic mirror set-up = 405/473/543/635, photomultiplier tube voltage = 700 V, offset = 0%, gain = 1× and laser power = 65%. Our microscope scan time was approximately 23 minutes per 10 slice Z stack. The lateral optical resolution of the system was 218 nm. Figure 2 shows examples of microscope image data acquired at different FNTD positions / proton LETs.
Figure 2.
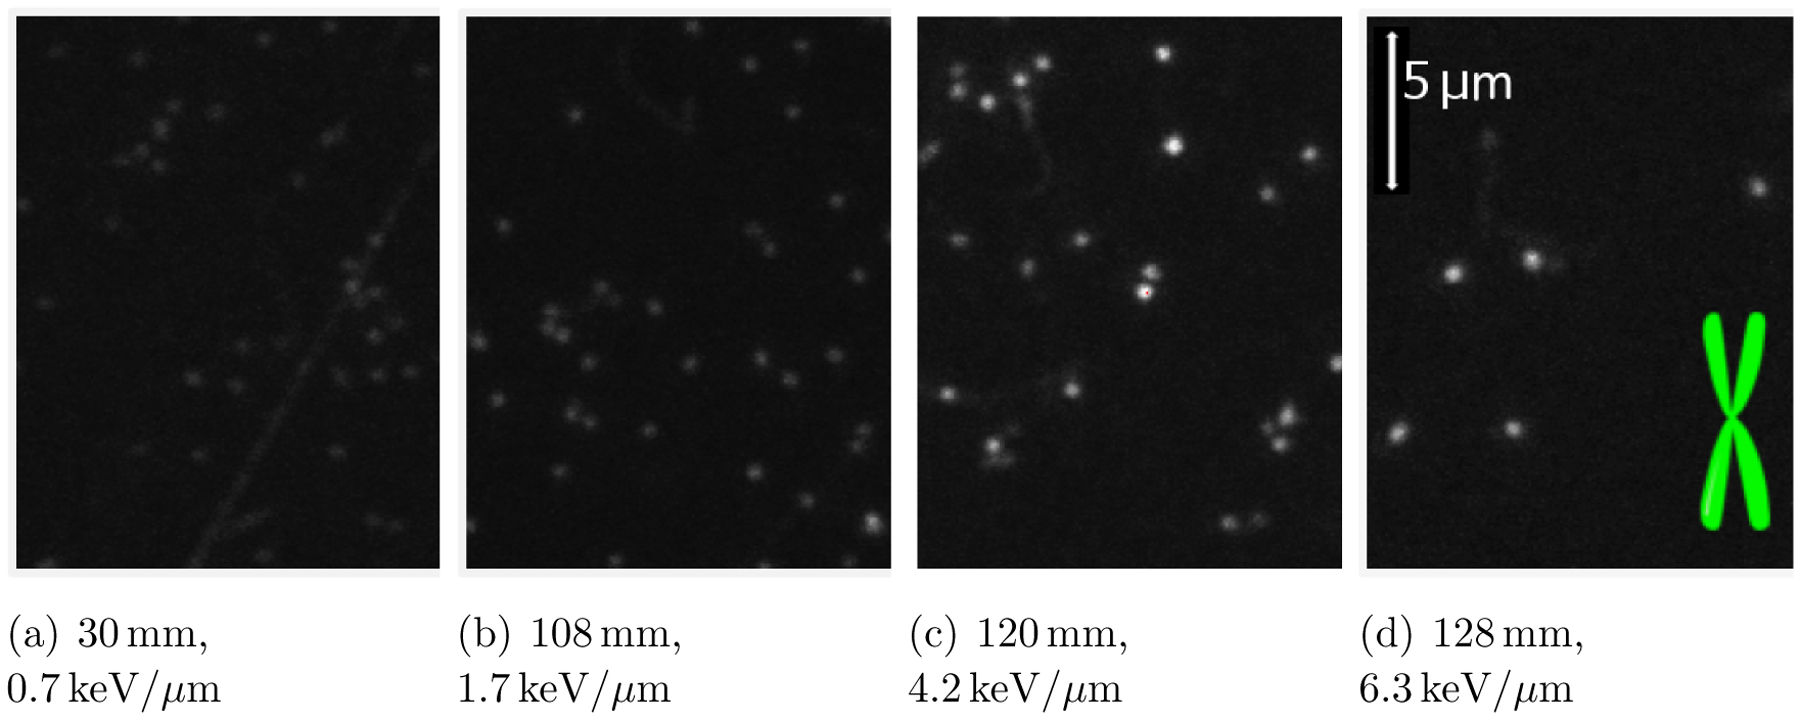
Example microscope image data acquired from FNTDs positioned at various nominal depths [mm] and corresponding track-averaged LET values [keV/μm] within the water phantom. The height of each image corresponds to 17 μm. In the final image, a schematic of an X chromosome (7 μm in length) is included to provide a scale comparison.
2.3. FNTD proton track analysis
The microscope images were processed using Trackpy (v 0.3.0) (Allan et al. 2010), a freely-available python particle tracking toolkit based upon the widely-used Crocker-Grier algorithm (Crocker and Grier 1996) which: (1) locates all local maxima, (2) filters very dim maxima away, and (3) refines the remainder to subpixel accuracy by iteratively honing in on their centre of brightness. First, the Trackpy ‘locate’ (spot detection) function preprocesses each slice in each image stack by performing a band pass filter and implementing a threshold. It then locates all peaks of brightness, characterizes the neighborhoods of the peaks, and retains only those with specified minimum intensity (‘mass’). Finally it refines the positions of each peak. We used visual quality assurance to determine the following parameters for the Trackpy ‘locate’ function: (i) the maximum feature/’spot’ diameter (5 pixels = 0.414 μm); (ii) its minimum integrated intensity (‘minmass’ = 120); (iii) the separation required between features (5 pixels). Next, the Trackpy ‘track’ detection function was applied with a specified value for the maximum distance that each ‘spot’ could travel between slices in the image stack (search range = 10 pixels), enabling us to eliminate particles traveling at oblique angles. Finally, we required each particle ‘track’ to feature in all slices of the imaging stack. Figure 3 shows an example of detected ‘spots’; highlighted with arrows are those spots that did not ultimately qualify as particle ‘tracks’. As output we returned: the total integrated brightness (IB) of the spot (a parameter termed ‘mass’ by Trackpy); ‘size’ meaning the radius of gyration of each spot’s Gaussian-like profile, and eccentricity (0 being circular). The ‘track’ mean of each of these quantities was calculated over each 10 slice Z-stack.
Figure 3.
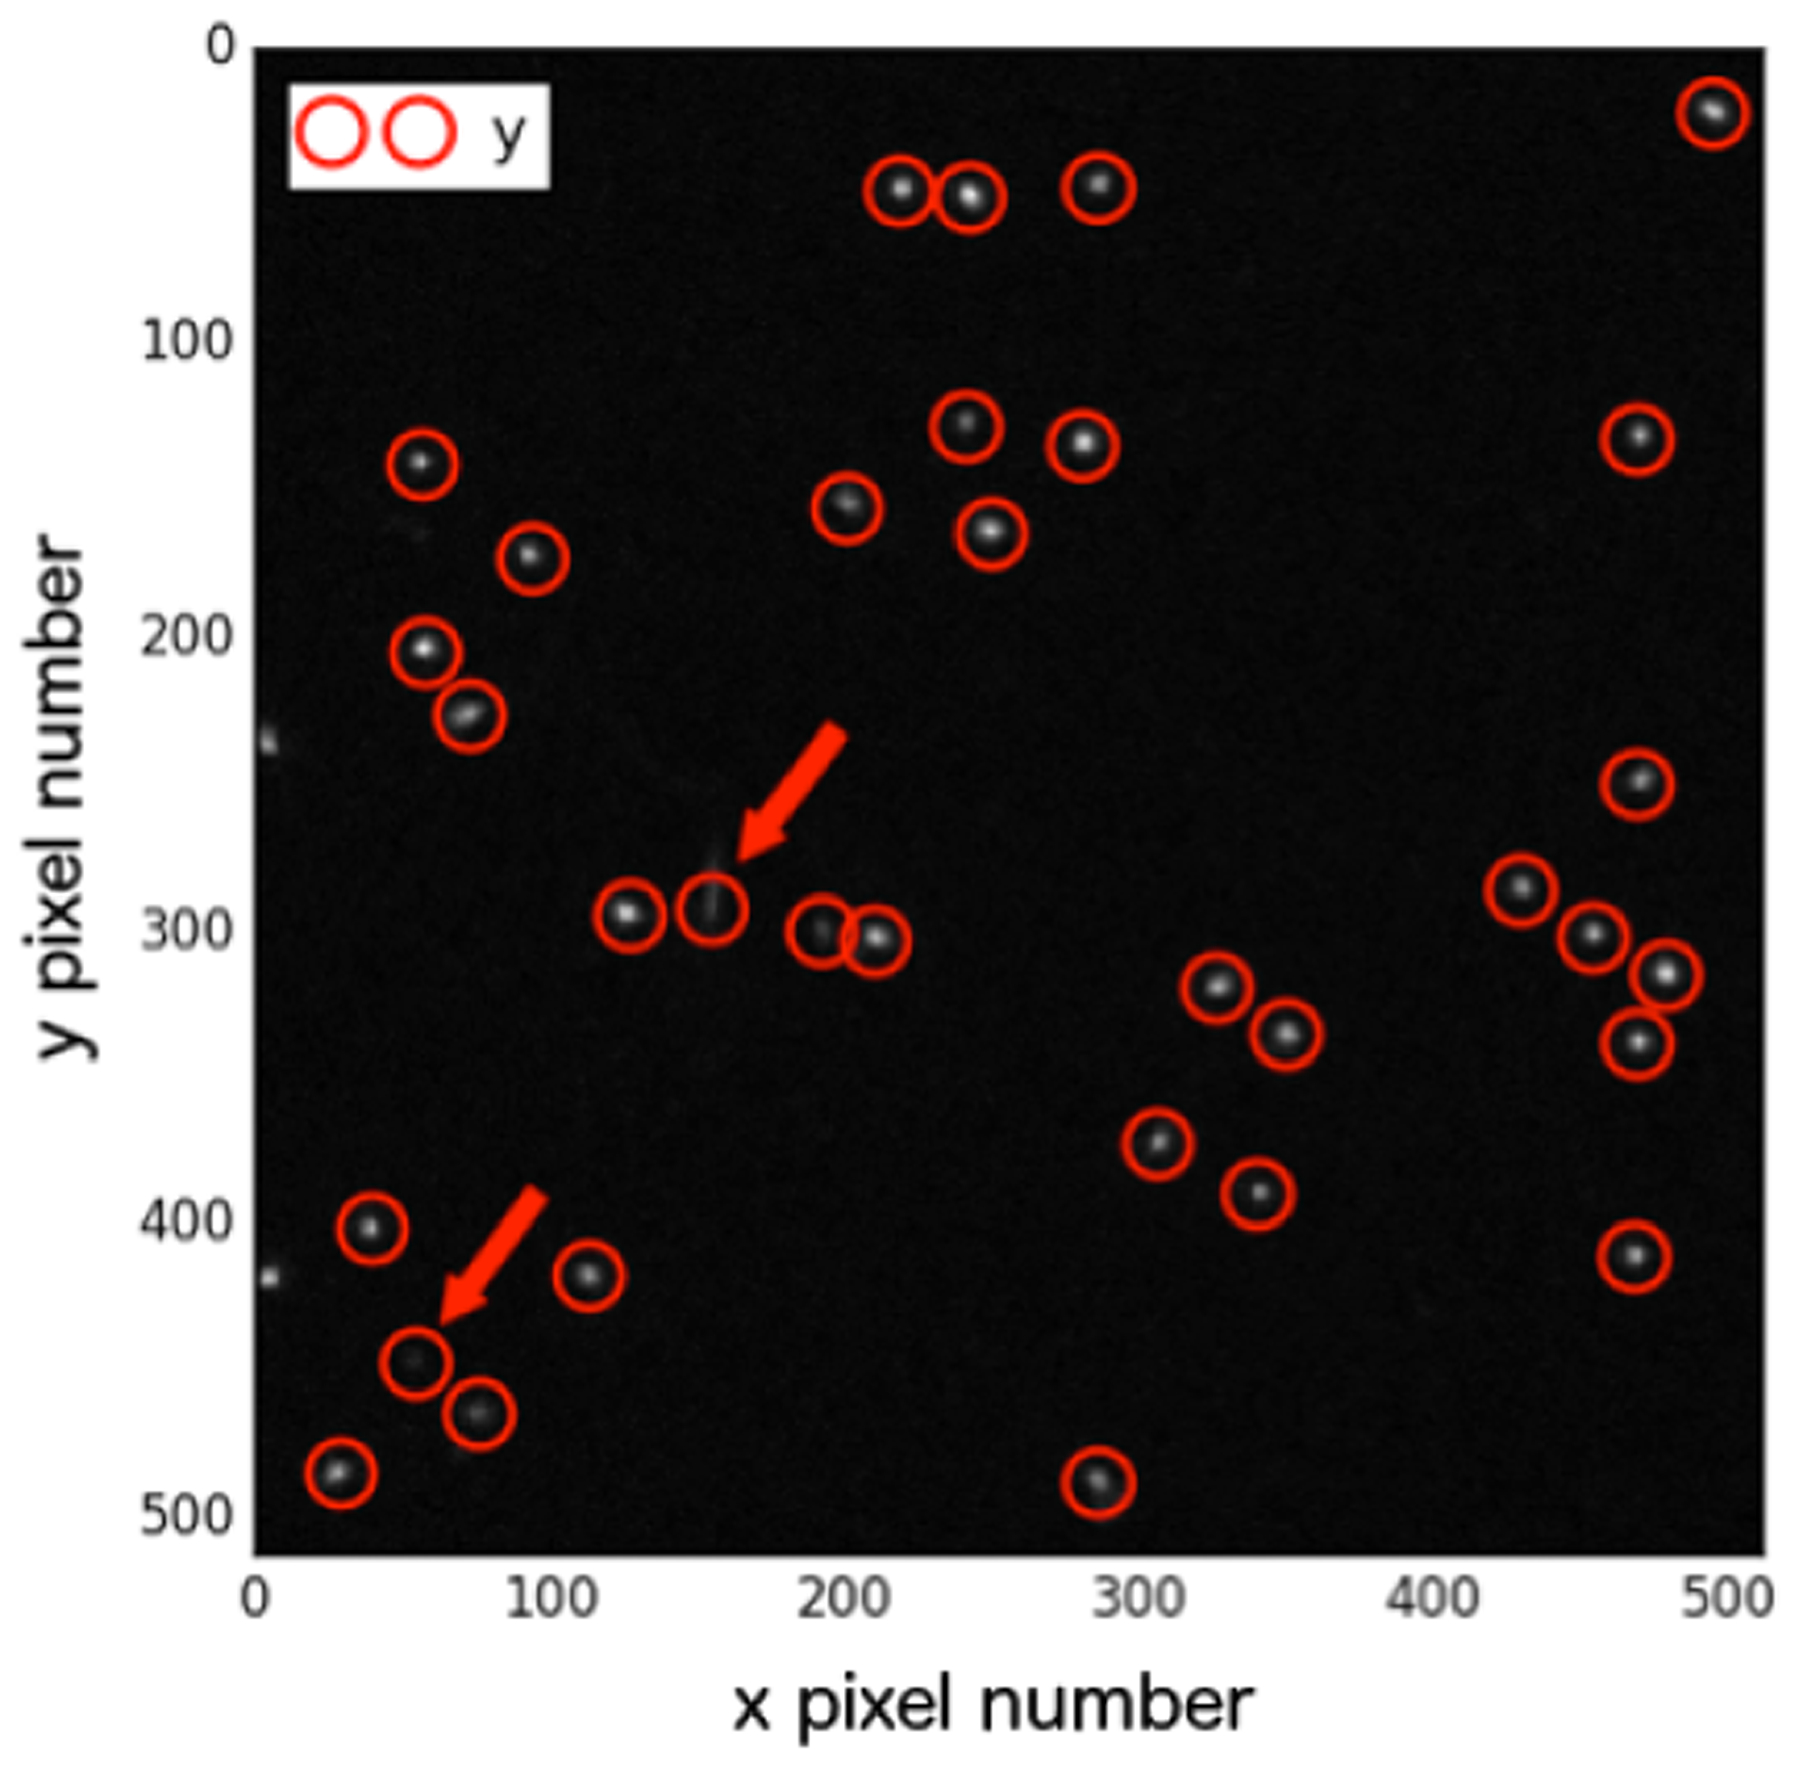
‘Spot’ detection for a single image slice from the FNTD positioned at a depth of 128 mm. The circles match initial candidate spots and the arrows highlight those that didn’t eventually qualify as tracks.
2.4. Monte Carlo simulations
Monte Carlo simulations were implemented using the TOPAS (TOol for PArticle Simulations, version 3.0.1) platform (Perl et al. 2012) and TOPAS-nBio, a nanodosimetric extension designed to facilitate biological modelling on the sub-cellular scale (McNamara et al. 2016). These were both layered on top of Geant4 version 10.2.p01. The simulation process had two stages:
A validated TOPAS model of the beam line (Perl et al. 2012, ?) was used to model the Bragg peak, which was obtained from the first range modulator wheel stop digit (i.e. it was the deepest peak in a spread out Bragg Peak) for our passively scattered system with an open, 25 cm diameter aperture. For full details of the MC parameters and physics used in the simulations we refer the reader to Perl et al. (2012) and Testa et al. (2013). Track-averaged LET was scored (see supplementary material, scoring excerpt 1) as a function of depth in water, for cylindrical voxels with a radius of 3 cm and a thickness of 0.1 cm. In a separate analysis we determined that varying the off-axis position of a small scoring volume (from 0 to 8 cm) did not affect our track-averaged LET values, such that on-axis scoring was considered for all FNTDs. Particle phase spaces (consisting of position and direction, energy and type for each particle) were scored at depths corresponding to the top surface of each FNTD.
TOPAS-nBio simulations: the default Geant4-DNA Physics constructor (version 10.2.p01) was utilised with no tracking cuts and the following parameters: world dimensions of 0.4 × 0.4 × 0.800001cm3 and TOPAS surface and radial tolerances of 2×10⁻⁶ nm. For further parameter information, please see scoring excerpt 2 in the supplementary material.
The Geant4-DNA proton physics models have an upper-energy limit of 100 MeV (Ivanchenko et al. 2013), such that stage (ii) of the simulations was performed only for the five deepest FNTD positions, where the maximum proton energy was <100 MeV. Particle tracks for an example TOPAS-nBio simulation are included as Figure 4. In order to enable the simultaneous scoring of multiple track-based properties, ntuple scoring was implemented in TOPAS. Ntuple scorers output a table, where columns represent different properties and rows represent different recordings. Custom ntuple scorers can be added to TOPAS-nBio via its extension mechanism. This allows users to choose which properties of the particle step to record (e.g. energy deposited) and when to record them (e.g. each step of a primary proton). In this study we considered two quantities scored via ntuples:
Frequency mean microdosimetric lineal energy, . Our aim here was to investigate the potential of FNTDs as a tool to experimentally determine microdosimetric quantities. Typically, the value of such quantities within water would be of most interest for biological studies, such that we performed our simulations within pure liquid water (G4_WATER). Particles were initially tracked through a 10 μm thick water volume, representing the top layer of the FNTD that was not considered in the microscope scans. Scored phase spaces were then shrunk to have a side-length of 120 μm and events were scored within a subsequent water volume of thickness 1 μm. To improve the statistical precision of the simulation, we used multiple abutting spheres to score y, each with radius r=0.5 μm. The abutting spheres spanned the central area of the phase-space only (80 μm in diameter), to account for delta-electrons generated outside the sphere regions. We scored the lineal energy spectra resulting from the interactions of both primary and secondary particles within our spheres of interest (Guatelli et al. 2012, ?). y was scored as , here ϵ was the total sum of energy deposits - for primary and secondary particles - associated with a single primary proton and was the mean chord length for each scoring sphere (i.e. ). was calculated as the expectation value of y (Kellerer 1985).
The number of terminal electrons per primary proton. Our aim here was to contribute to the experimental validation of TOPAS-nBio simulations: this time we sought to score interactions in a material that mimicked the true FNTD as closely as possible. Since the Geant4-DNA physics constructor can currently only be applied to water, at each FNTD depth we scaled the mass-density of the G4_WATER so that its electronic stopping power matched that of aluminium oxide. That is, for the mean energy of the incoming proton beam in each phase space, a mass-density was calculated for the water as the mass-density of aluminium oxide (3.96 g/cm3) multiplied by the (aluminium oxide)/(water) electronic stopping power ratio, the latter calculated using the NIST PSTAR tool (Berger et al. 2005). Replicating the microscopy, particles first traversed 10 μm of the FNTD before entering a 20 μm thick scoring region of the same material. The key parameters scored in this ntuple were: (a) the particle species, (b) the particle event ID (maintained for each primary proton), (c) the track ID (maintained for each electron track) (d) the energy deposited per step, i.e. the sum of energy deposited by energy loss processes and energy lost to secondaries not generated in the simulation and (e) the perpendicular event distance from the proton track. For each primary proton track within each ntuple, a count was performed of the number of secondary electrons whose simulation was terminated within radius, R of the primary proton track, where R corresponded to the maximum feature radius considered during the trackpy image processing, i.e. 207 nm. The number of colour centres with trapped electrons (and thus the number of fluorescent photons produced) was assumed proportional to the number of electrons reaching the end of their range, such ‘terminal’ electrons being able to undergo electron capture whilst satisfying momentum conservation.
Figure 4.
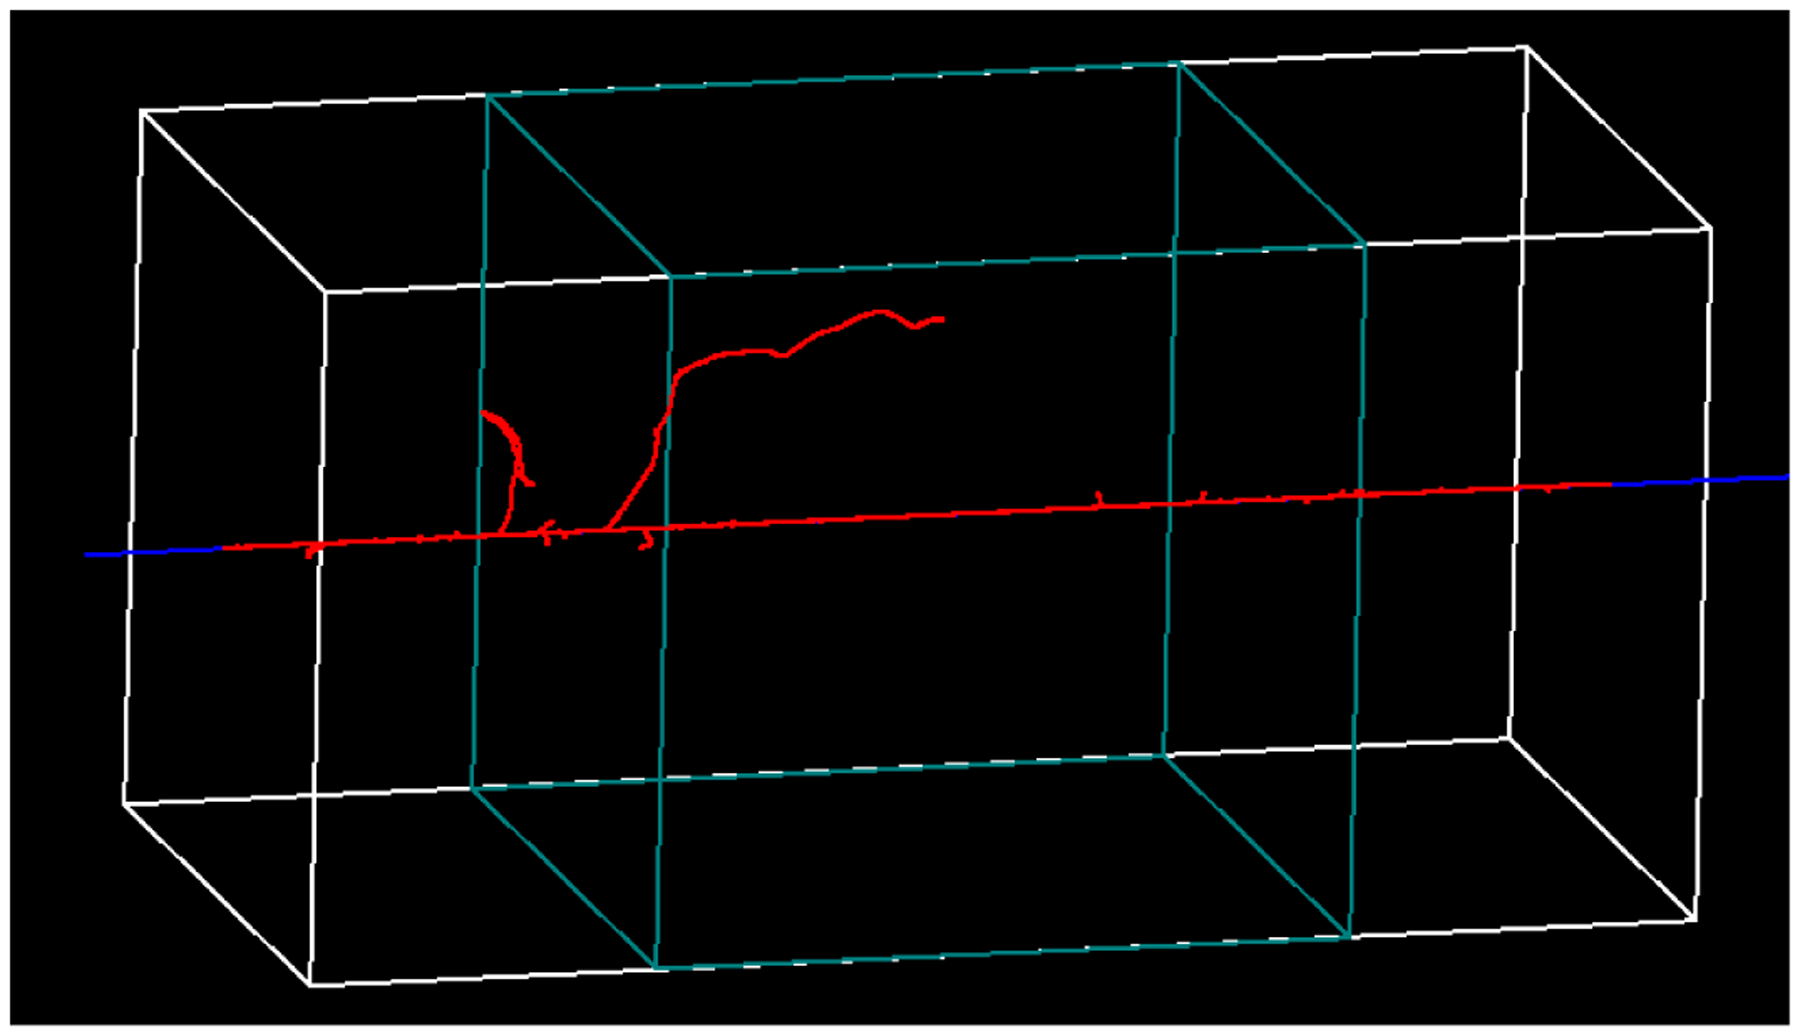
Example particle simulation from TOPAS-nBio (using physics lists from Geant4-DNA) of 80 MeV protons (blue) entering a section (20×20 μm2) of a virtual FNTD composed of water with modified mass-density. An FNTD thickness of 40 μm was simulated and particle tracks were scored in the target region (central 20 μm, green box). The red tracks are the secondary electrons that were produced.
2.5. Fitting of experimental and simulated histograms for energy deposited per proton
For analysis of the energy depositions of individual protons tracks, track data was pooled across all FNTD scan positions, with the FNTD experiments ultimately enabling us to generate normalized histograms of IB. Comparison of these experimental histograms to those obtained for the simulated total number of terminal electrons per proton, was facilitated using the skew-normal distribution from the Python package ‘lmfit’ (Newville et al. 2014). Fits obtained using this distribution are characterised according to the usual Gaussian parameters, amplitude (A), centre (μ) and sigma (σ) plus an additional parameter for distribution skewness, (γ) in:
| (1) |
where erf[] is the Gauss error function.
3. Results
Figure 5a shows that histograms of track IB displayed strong repeatability across microscope scan positions within an FNTD (the relative standard deviation of the median values was < 4%). The 218 nm optical resolution of the imaging system was insufficient to detect a relationship between track diameter and track energy (Figure 5b): our experimentally-obtained track diameters had a mean value of 227.7 nm (std = 0.5 nm) within ≈10 nm of the system’s theoretical 218 nm optical resolution.
Figure 5.
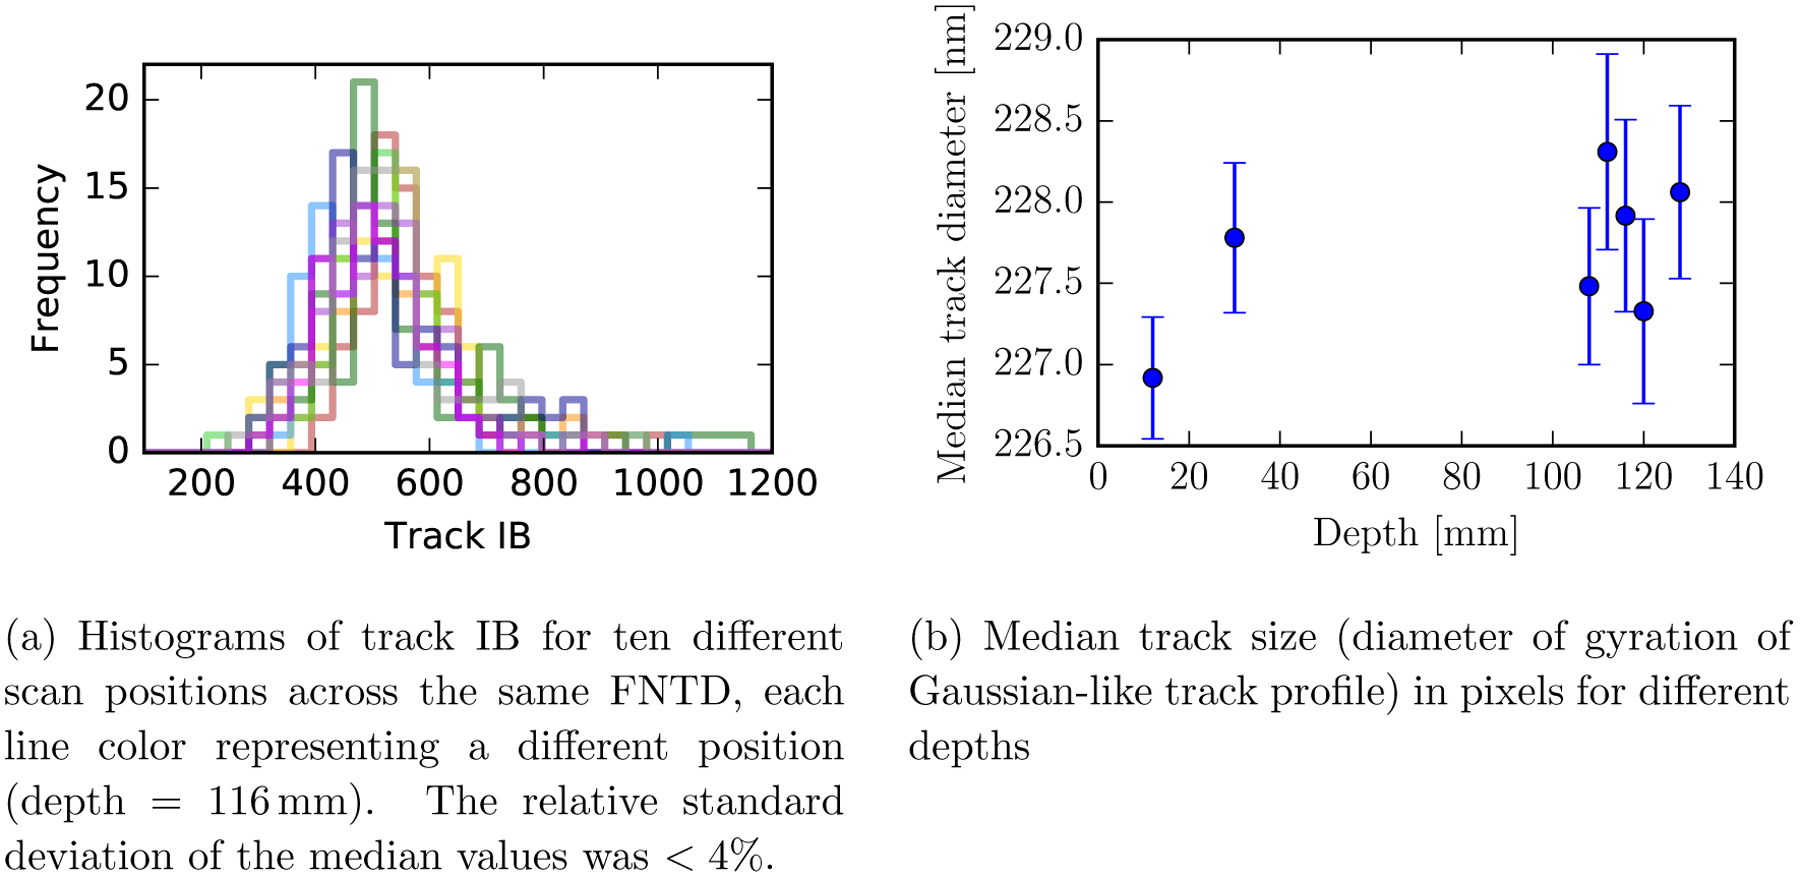
FNTD experimental robustness.
In Figure 6a, a least squares optimization was implemented to linearly transform the experimental data points for median track IB to the TOPAS-simulated data for track-averaged LET and a linear regression line is included. The slight sub-linearity evident in the raw data at high LETs (Figure 6a) is broadly consistent with that observed by Sawakuchi et al. (2016), who used the same read out equipment. We believe this sub-linearity to be attributable to (i) saturation of the photodetector used to acquire our FNTD fluorescence signal and / or (ii) experimental positioning error in setting the zero water-depth within our home-made phantom ‡ Regarding experimental positioning error, visibility through our transluscent water-container was limited. As shown in Figure 6b, considering track-averaged LETs at depths 2 mm deeper than the nominal positions (our estimated bound on the set-up precision) substantially improved the linear correlation between the experimental and simulated data (the r2 associated with a simulated to experimental linear regression line increased from ≈0.87 to ≈0.98). Thus, for the remaining data presented within this manuscript we apply a 2 mm depth shift within in our TOPAS phase space scoring, so that we consider FNTD surface depths of: 110, 114, 118, 122 and 130 mm, rather than the nominal values of 108, 112, 116, 120 and 128 mm (of the original 7 depths, a subset of 5 was considered: for the two shallowest in the original list the mean proton energy exceeded the 100 MeV upper limit of the Geant4-DNA physics constructor). Application of the shift did not affect the conclusions of our study, but for completeness, we present parallel results of analyses for the unshifted depths in our supplementary material.
Figure 6.
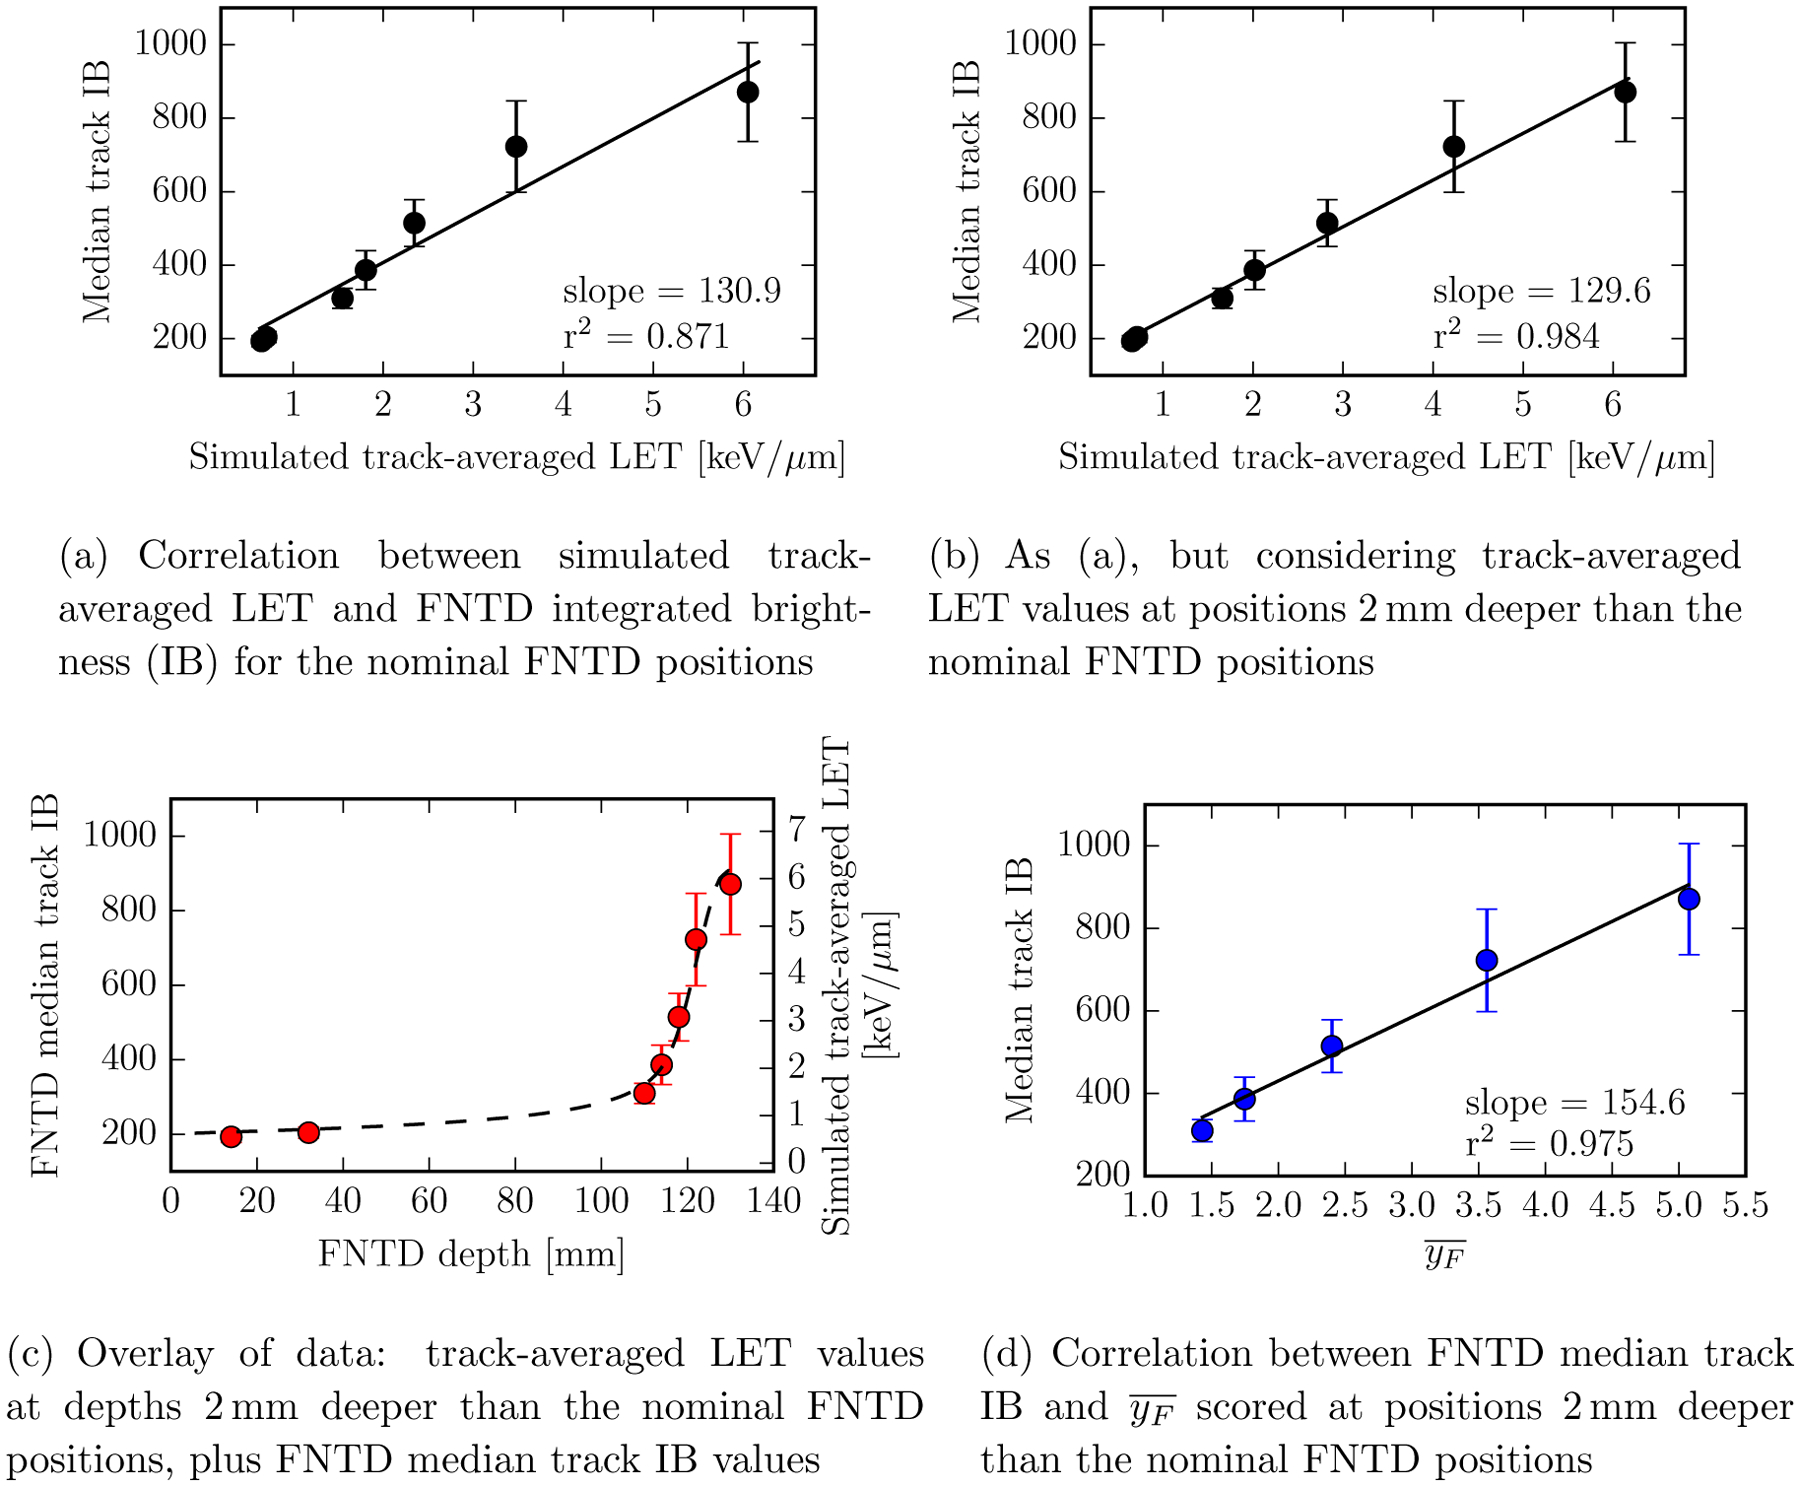
Comparing measured FNTD median track integrated brightness (IB) to simulated track-averaged LET and frequency mean microdosimetric lineal energy, . All simulations were performed in water (with no density scaling). ‘Error bars’ show the inter-quartile range associated with the FNTD measurements.
It is notable that the inter-quartile range ‘error-bars’ associated with the FNTD data (Figure 6) increase substantially as the proton beam reaches the end of its nominal 12 cm range, an effect that may be partially attributable to the reduced beam fluence, but is more likely driven by energy straggling, which causes a true increase in the spread of LET. Nonetheless, strong correlations between FNTD median track IB and both (i) simulated track-averaged LET and (ii) frequency mean microdosimetric lineal energy, are evident (Figures 6b and d), both statistically significant with Spearman’s ρ = 1, and p<0.01.
For each virtual FNTD, TOPAS-nBio simulations yielded stochastic distributions of the number of terminal electrons per proton. These simulated data were right-skewed with extreme outliers, such that prior to quantitative analysis the data was truncated at the 95th percentile. The resulting histograms are presented alongside the FNTD-derived histograms of proton track IB within Figures 7 a and b. In black, the skew-normal distribution fits obtained using ‘lmfit’ (Newville et al. 2014) are shown. Figures 7 c and d demonstrate that statistically significant correlations were evident between: the FNTD fit centres (μ values, equation 1) and the simulated fit centres (μ values, equation 1) (c); the experimental fit sigmas (σ values, equation 1) and the simulated fit sigmas (˙ values, equation 1) (d); both had an associated Spearman’s ρ of 1 and p <0.01. The axes in Figures 7 c and d are normalised to the data obtained at a depth of 110 mm. No correlation was observed between the experimental and simulated fit skewness parameters at different FNTD depths.
Figure 7.
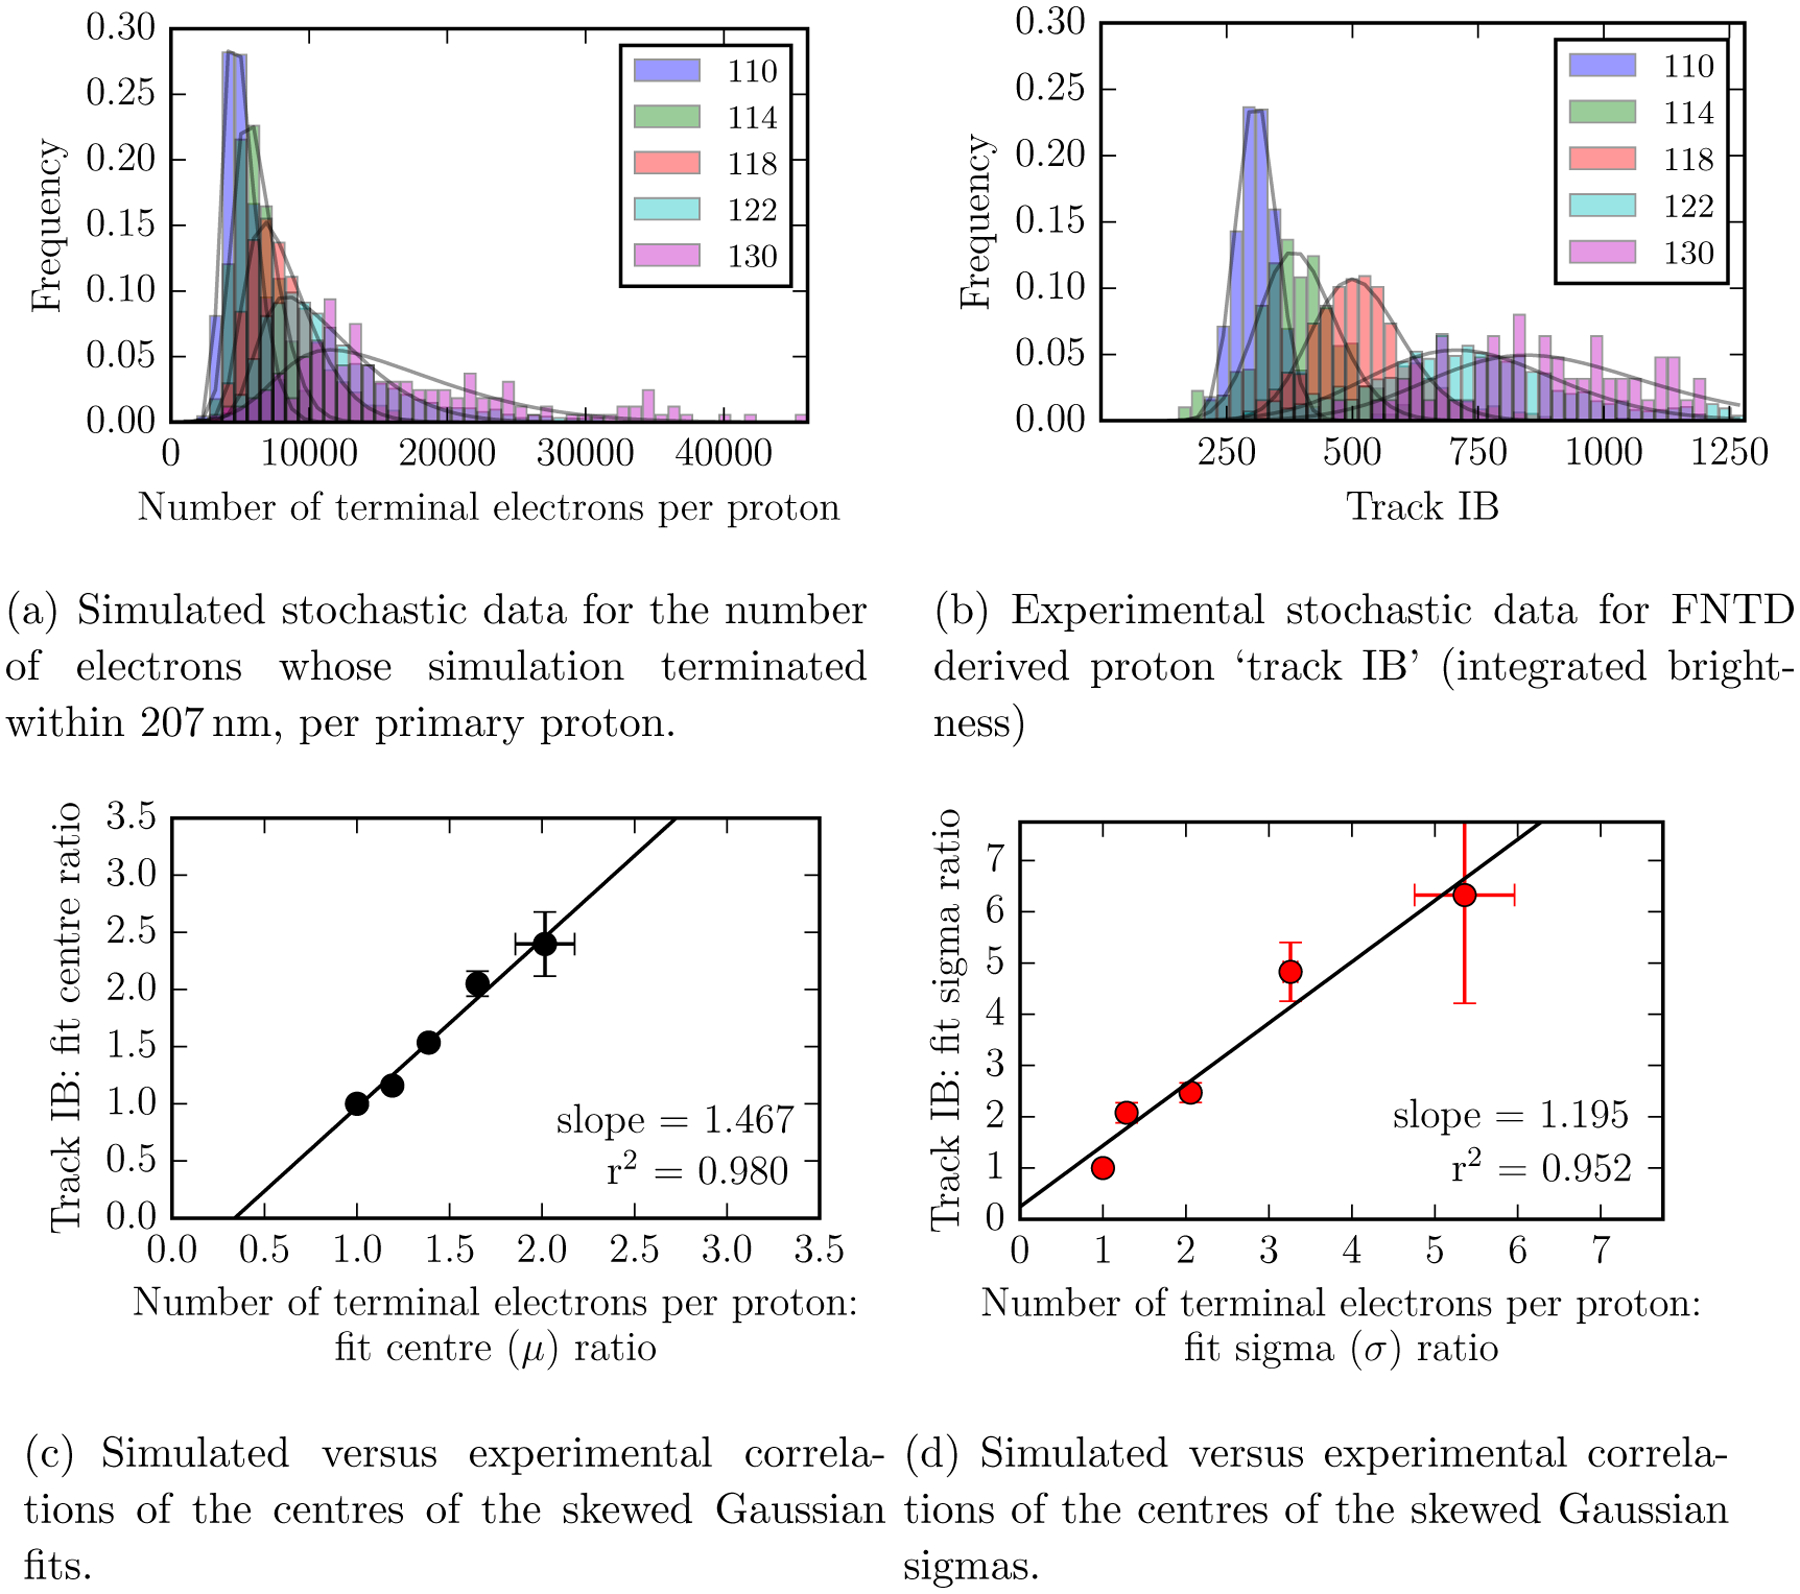
Comparing stochastic proton interactions simulated using TOPAS-nBio to experimental data from fluorescent nuclear track detectors. A fixed number of 50 bins was used for both histograms. All simulations were performed in water with mass-density scaled to mimic Al2O3:C,Mg.
4. Discussion
For proton track-averaged LET values in water ≤2.28 keV/μm Sawakuchi et al. (2016) concluded that a strong correlation existed between FNTD track IB and simulated track-averaged LET. Our findings support this conclusion and further demonstrate that the correlation extends along the proton Bragg peak to higher track-averaged LETs of 6.3 keV/μm (Figures 6b and c). Furthermore, we found a similar correlation between FNTD track IB and frequency mean microdosimetric lineal energy, , suggesting that FNTDs may prove useful in the experimental study of biologically relevant, microdosimetric quantities. Thus far y and have been determined experimentally using tissue equivalent proportional counters (Kellerer 1985), silicon (Guatelli et al. 2012) and diamond (Davis et al. 2008) detectors. As passive detectors, FNTDs can be manufactured into a wide range of geometries at a low cost. They can be mailed to different facilities, exposed and evaluated at any later time. Further work would be required to verify their performance, but they could offer a more flexible approach to measure microdosimetric parameters such as .
Delta rays with enough energy to escape the track core were rarely visible within a single slice of the microscope Z-stack (this required their path to be perpendicular to the proton track core). Additionally, due to their low LET and consequently low fluorescent signal, these high energy delta rays were difficult to detect automatically such that we were not able to obtain reliable data on their frequency or path length. The optical resolution of our microscope system was 218 nm: orders of magnitude coarser than each proton track’s ‘core’. Consequently, it was not possible for us to detect a relationship between experimental and simulated track radii. It is likely that in the future super-resolution optical microscopy may enable track images with much higher spatial resolution to be obtained (Cremer and Birk 2016).
In Figure 7 we present the first comparison of the stochastic energy depositions of individual protons simulated using Geant4-DNA physics models to experimental fluorescence data from FNTDs. Despite the unavoidable discrepancy (due to lack of available cross-section data) between our real and virtual sensitive media: Al2O3:C,Mg versus density-adjusted water, we were able to experimentally replicate the trends in our simulated analyses. Skew-normal distributions were fit to histograms of FNTD track IB (integrated brightness) and histograms of the simulated number of terminal electrons per proton. Statistically significant correlations were observed between the experimental and simulated data for the central positions and sigma values of these skew-normal fits. We assumed that electrons whose simulation terminated within our processing radius of interest would be good candidates for electron capture (satisfying momentum conservation), such that we could consider ‘number of terminal electrons per proton’ as proportional to the ‘number of F2+(2Mg)-centres’ which corresponds to the ‘number of fluorescent photons emitted per proton’ and hence track IB.
To conclude, mirroring the work of Greilich et al. (2013) Sawakuchi et al. (2016) and others, our results support the use of FNTDs as a flexible tool for studying the properties of individual proton tracks. We found strong correlations between FNTD track IB and both track-averaged LET and the frequency mean microdosimetric lineal energy , but further work is required to optimize FNTD read-out protocols and to establish look-up tables between FNTD track parameters and such quantities of interest. Without such further work, our comparison of (a) the number of terminal electrons per proton, scored in density-scaled water, against (b) stochastic, experimental histograms of FNTD track IB remains preliminary but encouraging: our results form an important first step towards the experimental validation of Monte Carlo simulations on the sub-cellular scale.
Supplementary Material
Acknowledgements
We thank Doug Trenholm and Ben Rowland for their help in designing and building the FNTD holder, plus Joost Verburg and Hsiao-Ming Lu for their help with the experimental irradiation. We also thank Mark Akselrod from the Stillwater Crystal Growth Division, Landauer Inc and Steffen Greilich from DKFZ for useful discussions. Tracy Underwood gratefully acknowledges the support of the European Commission under an FP7 Marie Curie International Outgoing Fellowship for Career Development (#630064). This work was supported by the National Institutes of Health (NIH)/National Cancer Institute (NCI) grant R01 CA187003 and National Research Foundation of Korea (NRF) grants NRF-2013M2B2B1075776 and NRF-2013M2B2B1075772, funded by the Korean government (MSIP: Ministry of Science, ICT and Future Planning).
Footnotes
Whilst hypothetically the high LET sub-linearity could be attributable to local saturation of FNTD colour-centres data from Sykora et al. (2008) and Greilich et al. (2016) indicate that, despite the occurrence of local regions of saturation, the integrated FNTD response per charged particle track does not become saturated even at very high (100 keV /μm) LET values. It is likely that the radius over which colour-centres become saturated is much smaller than the microscope point spread function, so that local colour-centre saturation is hidden for proton tracks.
References
- Akselrod MS, Akselrod AE, Orlov SS, Sanyal S and Underwood TH (2003). New aluminum oxide single crystals for volumetric optical data storage, Optical Data Storage, SPIE, OSA, Washington, D.C., pp. TuC3–251. [Google Scholar]
- Akselrod MS and Sykora GJ (2011). Fluorescent nuclear track detector technology - A new way to do passive solid state dosimetry, Radiation Measurements 46(12): 1671–1679. [Google Scholar]
- Akselrod MS, Rosenfeld A, Kron T, d’Errico F and Moscovitch M (2011). Fundamentals of Materials, Techniques, and Instrumentation for OSL and FNTD Dosimetry, CONCEPTS AND TRENDS IN MEDICAL RADIATION DOSIMETRY: Proceedings of SSD Summer School, AIP, pp. 274–302. [Google Scholar]
- Allan D, Nathan K, Caswell T and van der Wel C (2010). Trackpy, p. 638.
- Berger MJ, Coursey JS, Zucker MA and Chang J (2005). ESTAR, PSTAR, and ASTAR: Computer Programs for Calculating Stopping-Power and Range Tables for Electrons, Protons, and Helium Ions (version 1.2.3).
- Cremer C and Birk U (2016). Perspectives in Super-Resolved Fluorescence Microscopy: What Comes Next?, Frontiers in Physics 4: 730–9. [Google Scholar]
- Crocker JC and Grier D (1996). Methods of Digital Video Microscopy for Colloidal Studies, Journal of Colloid and Interface Science pp. 298–310. [Google Scholar]
- Davis JA, Ganesan K, Alves ADC, Guatelli S, Petasecca M, Livingstone J, Lerch MLF, Prokopovich DA, Reinhard MI, Siegele RN, Prawer S, Jamieson D, Kuncic Z, Pisacane VL, Dicello JF, Ziegler J, Zaider M and Rosenfeld AB (2008). Characterization of a Novel Diamond-Based Microdosimeter Prototype for Radioprotection Applications in Space Environments, IEEE Transactions on Nuclear Science 59(6): 3110–3116. [Google Scholar]
- Greilich S, Jansen J, Klimpki G, Kouwenberg JJM, Neuholz A, Pfeiler T, Rahmanian S, Stadler A and Ulrich L (2016). Dosimetry for ion-beam therapy using fluorescent nuclear track detectors and an automated reader.
- Greilich S, Osinga JM, Niklas M, Lauer FM, Klimpki G, Bestvater F, Bartz JA, Akselrod MS and Jäkel O (2013). Fluorescent nuclear track detectors as a tool for ion-beam therapy research, Radiation Measurements 56(C): 267–272. [Google Scholar]
- Guan F, Bronk L, Titt U, Lin SH, Mirkovic D, Kerr MD, Zhu XR, Dinh J, Sobieski M, Stephan C, Peeler CR, Taleei R, Mohan R and Grosshans DR (2015). Spatial mapping of the biologic effectiveness of scanned particle beams: towards biologically optimized particle therapy, Scientific Reports 5: 9850–10. [DOI] [PMC free article] [PubMed] [Google Scholar]
- Guatelli S, Reinhard MI, Mascialino B, Prokopovich DA, Dzurak AS, Zaider M and Rosenfeld AB (2012). Tissue Equivalence Correction in Silicon Microdosimetry for Protons Characteristic of the LEO Space Environment, IEEE Transactions on Nuclear Science 55(6): 3407–3413. [Google Scholar]
- Hawkins RB (1994). A statistical theory of cell killing by radiation of varying linear energy transfer, Radiation Research 140(3): 366–374. [PubMed] [Google Scholar]
- Incerti S, Ivanchenko A, Karamitros M, Mantero A, Moretto P, Tran HN, Mascialino B, Champion C, Ivanchenko VN, Bernal MA, Francis Z, Villagrasa C, Baldacchino G, Guèye P, Capra R, Nieminen P and Zacharatou C (2010a). Comparison of GEANT4 very low energy cross section models with experimental data in water, Medical Physics 37(9): 4692–18. [DOI] [PubMed] [Google Scholar]
- Incerti S, Ivanchenko A, Karamitros M, Mantero A, Moretto P, Tran HN, Mascialino B, Champion C, Ivanchenko VN, Bernal MA, Francis Z, Villagrasa C, Baldacchino G, Guèye P, Capra R, Nieminen P and Zacharatou C (2010b). Comparison of GEANT4 very low energy cross section models with experimental data in water, Medical Physics 37(9): 4692–18. [DOI] [PubMed] [Google Scholar]
- Ivanchenko VN, Incerti S, Allison J, Bagulya A, Brown JMC, Champion C, Elles S, Francis Z, Grichine V, Ivantchenko A, Jacquemier J, Karamitros M, Maire M, Mantero A, Marques JP, Pandola L, Raine M, Reis MA, Santin G, Sawkey D, Schaelicke A, Schenk M, Taborda A, Urban L and Yamashita T (2013). Geant4 electromagnetic physics: improving simulation performance and accuracy, Joint International Conference on Supercomputing in Nuclear Applications and Monte Carlo pp. 1–10. [Google Scholar]
- Kellerer AM (1985). Fundamentals of microdosimetry., in Kase KR, Bjarngard BE and Attix FH (eds), The dosimetry of ionizing radiation, pp. 1–88. [Google Scholar]
- Kouwenberg JJM, Ulrich L, Jäkel O and Greilich S (2016). A 3D feature point tracking method for ion radiation, Physics in Medicine and Biology pp. 4088–4104. [DOI] [PubMed] [Google Scholar]
- McNamara A, Geng C, Turner R, Mendez JR, Perl J, Held K, Faddegon B, Paganetti H and Schuemann J (2016). Validation of the radiobiology toolkit TOPAS-nBio in simple DNA geometries, Physica Medica pp. 1–9. [DOI] [PMC free article] [PubMed] [Google Scholar]
- Newville M, Stensitzki T, Allen DB and Ingargiola A (2014). LMFIT: Non-Linear Least-Square Minimization and Curve-Fitting for Python, pp. 1–3. [Google Scholar]
- Niklas M, Greilich S, Melzig C, Akselrod MS, Debus J, Jäkel O and Abdollahi A (2013). Engineering cell-fluorescent ion track hybrid detectors, Radiation Oncology 8(141): 1–10. [DOI] [PMC free article] [PubMed] [Google Scholar]
- Perl J, Shin J, Schümann J, Faddegon B and Paganetti H (2012). TOPAS: An innovative proton Monte Carlo platform for research and clinical applications, Medical Physics 39(11): 6818–20. [DOI] [PMC free article] [PubMed] [Google Scholar]
- Sawakuchi GO, Ferreira FA, McFadden CH, Hallacy TM, Granville DA, Sahoo N and Akselrod MS (2016). Nanoscale measurements of proton tracks using fluorescent nuclear track detectors, Medical Physics 43(5): 2485–2490. [DOI] [PMC free article] [PubMed] [Google Scholar]
- Sykora GJ, Akselrod MS, Benton ER and Yasuda N (2008). Spectroscopic properties of novel fluorescent nuclear track detectors for high and low LET charged particles, Radiation Measurements 43(2–6): 422–426. [Google Scholar]
- Testa M, Schümann J, Lu HM, Shin J, Faddegon B, Perl J and Paganetti H (2013). Experimental validation of the TOPAS Monte Carlo system for passive scattering proton therapy, Medical Physics 40(12): 121719–16. [DOI] [PMC free article] [PubMed] [Google Scholar]
- Tommasino F and Durante M (2015). Proton Radiobiology, Cancers 7(1): 353–381. [DOI] [PMC free article] [PubMed] [Google Scholar]
Associated Data
This section collects any data citations, data availability statements, or supplementary materials included in this article.


