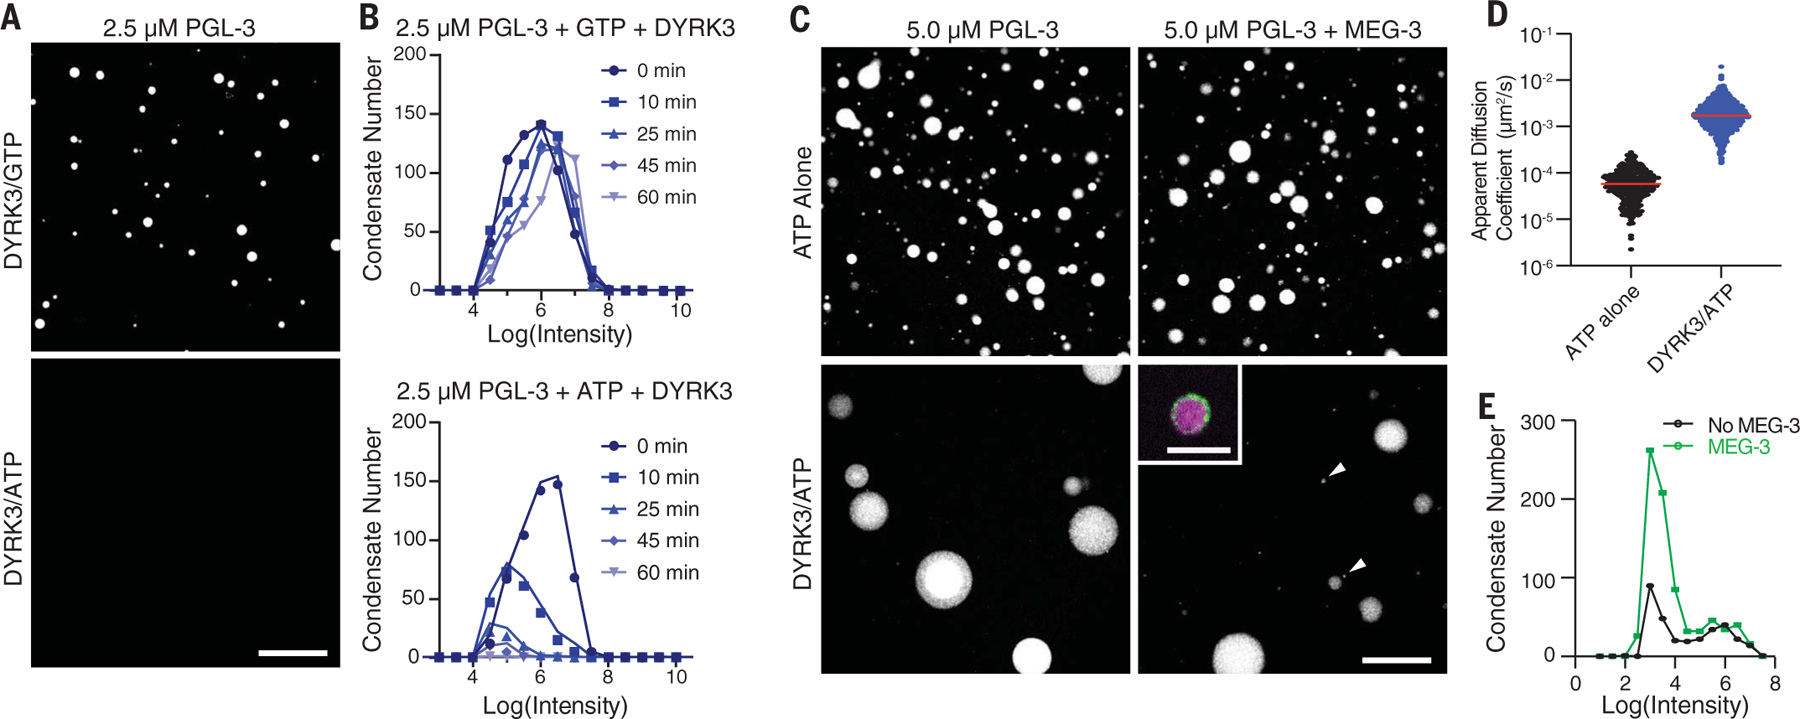
Fig. 3. MEG-3 stabilizes PGL-3 condensates against kinase accelerated coarsening.

(A) Photomicrographs of a 2.5 µM PGL-3488 emulsion after a 60-min treatment with 100 nM DYRK3 kinase in the presence of GTP (top) or ATP (bottom). Scale bar is 50 µm and applies to both images. (B) Histograms of PGL condensates assembled as in (A) with GTP and DYRK3 or ATP and DYRK3 at indicated time points. Circles indicate the number of PGL-3 condensates binned by the log(intensity) of each condensate. Colors indicate the time after addition of DYRK3. (C) Photomicrographs of PGL-3 condensates (max projections) assembled with and without 70 nM MEG-3 and captured 60 min after addition of 100 µM ATP with and without 100 nM DYRK3. Arrows point to small PGL-3 and MEG-3 co-condensates. The inset is a high-resolution image with PGL-3 in magenta and MEG-3 in green (see fig. S4, F and G, for additional examples). Scale bars are 50 µm (applies to all images in the set) and 5 µm (inset). (D) Diffusion coefficients of 200-nm microspheres in PGL-3 condensates (5 µM PGL-3 and 100 µM ATP) with and without 100 nM DYRK3. Each dot represents a single microsphere trajectory. The red line represents the mean. (E) Histograms of PGL-3 condensates assembled with and without 70 nM MEG-3 and incubated for 60 min in 100 µM ATP with 100 nM DYRK3. Circles indicate the number of PGL-3 condensates binned by the log (intensity) of each condensate captured from 17 images. See fig. S4, D and E, for additional MEG-3 concentrations and an additional time point.
