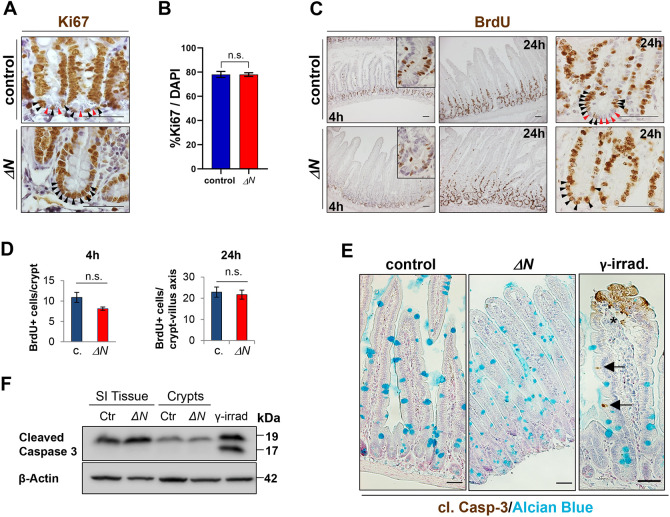
Fig. 2.
Unaltered IEC proliferation and cell death rate in ΔN mice compared with controls. (A) Anti-Ki67 antibody staining on PSI sections of ΔN and control mice indicating proliferative cells. n=3 per group. (B) Quantification of average numbers of Ki67+ cells as a percentage of total DAPI-stained cells. n=3 per group, n>20 crypts per mouse. (C) Anti-BrdU antibody staining on PSI sections of ΔN and control mice indicating BrdU incorporation 4 or 24 h after injection. Insets show magnified images of crypts. In A and C, in crypts of controls proliferating ISCs (black arrowheads) are intermingled with Paneth cells (red arrowheads). (D) Quantification of BrdU+ cells per crypt (4 h) and per crypt-villus axis (24 h) in control or ΔN mice. n=3 per group, n≥20 crypts per mouse. (E) Representative IHC images of anti-cleaved caspase 3 and Alcian Blue staining on PSI sections of ΔN and control (n=3 per group) mice, and of a tissue sample of γ-irradiated control mice (see Kolesnichenko et al., 2021). Black arrows point to caspase 3-positive (apoptotic) cells in villi of irradiated controls. Asterisk indicates nonspecific staining due to handling. (F) Analysis of cleaved caspase-3 protein expression. Total PSI and PSI crypt whole-cell extracts of control and ΔN mice (n=3 per group) were used for SDS-PAGE western blotting. β-Actin was used as loading control. Scale bars: 50 µm (A,C); 200 μm (E). In B,D, error bars represent s.e.m.; n.s., not significant (unpaired Welch's t-test).

