

Abstract
We describe a general Biacore method for measuring equilibrium binding affinities and stoichiometries for interactions between unmodified proteins and their unmodified ligands free in solution. Mixtures of protein and ligand are pre-equilibrated at different ratios in solution, and then analyzed by Biacore using a sensorchip surface that detects only unbound analyte. Performing the Biacore analysis under mass-transport limited conditions allows the concentration of unbound analyte to be determined from the initial velocity of binding. Plots of initial velocity versus the concentration of the varied binding partner are fitted to a quadratic binding equation to give the affinity and stoichiometry of binding. We demonstrate the method using soluble Her2 extracellular domain binding to monovalent, bivalent and trivalent forms of an anti-Her2 antibody. The affinity we measured agrees with that obtained from conventional Biacore kinetic analysis, and the stoichiometries for the resulting 1:1, 1:2 and 1:3 complexes were confirmed by gel filtration with in-line lightscattering. The method is applicable over an affinity range of approximately 100 pM-1 M, and is particularly useful when there is concern that covalently modifying one or other binding partner might affect its binding properties, or where multivalency might otherwise complicate a quantitative analysis of binding.
Keywords: Affinity, Avidity, Label-free, Stoichiometry, Solution binding, Surface plasmon resonance, Multivalency, Quadratic binding, Mass transport
Reversible protein-protein interactions are ubiquitous in biology, and play key roles in very many biologically and medically important processes such as cell signaling, immune recognition, and cell-cell communication. Many methods exist for characterizing protein-protein binding interactions, and the complexes that result, in vitro. Yet conveniently and accurately measuring the affinity and stoichiometry of such interactions, without labeling or modifying one or both binding partners and thus potentially altering their binding properties, remains technically challenging. Biophysical methods for characterizing binding interactions between unlabeled proteins, such as analytical ultracentrifugation and dynamic light scattering, are technically nontrivial, and analyzing the data requires special expertise [1 – 4]. Consequently, these direct and powerful techniques can be daunting for the nonspecialist. Moreover, their ability to provide precise affinity information is limited [3, 5]. Other commonly used approaches for measuring protein-protein binding typically require labeling one or both proteins, for example with a fluorophore, or capturing one of the binding partners onto an assay plate or sensor surface. In either case, at least one of the proteins must be covalently modified or noncovalently captured in a way that has the potential to alter its binding properties. Even radio-iodination of a protein for use in radioligand binding methods, typically considered to be among the most non-perturbing of labeling strategies, can result in substantial changes to its binding characteristics [6]. Competition assays avoid the need to label both receptor and ligand, but most assay technologies still require that one binding partner be captured on an assay plate or bead to facilitate separation of unbound ligand. Moreover, competition methods are generally better suited to measuring binding affinities than for determining binding stoichiometry [7]. Due to the above limitations, fully characterizing the binding affinity and stoichiometry of a protein-protein complex typically requires a combination of biochemical and biophysical methods, and outside the specialized biophysical laboratory the convenient measurement of protein complex stoichiometries remains a particular problem.
A technique that has become widely used for measuring both affinities and stoichiometries of protein-protein interactions is surface plasmon resonance (SPR), for example using a Biacore biosensor instrument [8, 9]. In SPR6, one binding partner is coupled to a sensor surface, and various concentrations of the other are flowed over this surface to allow binding to occur. SPR gives a signal that is proportional to the total mass of protein in the vicinity of the sensor surface, and so if the molecular weights of the interacting proteins are known, then both the binding affinity (and sometimes the kinetics) and also the stoichiometry of the resulting complex can be determined [9], provided the captured receptor can be presumed to be 100% active. SPR is often described as “label free”, in the sense that the instrument detects the protein directly and so no prior labeling of either protein with any optical probe is needed. However, the method does require the direct covalent coupling or indirect capture of one binding partner on the sensor surface, and so when used in the standard way SPR is not measuring interactions between unmodified proteins.
Interactions in which one of the proteins binds bivalent or multivalently present special measurement difficulties when using any method involving capture of the other binding partner on a plate, bead or sensor surface [10, 11]. In Biacore, for example, the sensorchip is typically coated with a dextran matrix that presents carboxylate groups to which one of the binding partners is covalently coupled. For a monovalent, 1:1 binding event, affinity measurements with one partner coupled to a Biacore chip typically mirror the results obtained by isothermal titration calorimetry (ITC), stopped flow fluorescence, [12] or other methods [13, 14]. But this correspondence breaks down when the species in solution has more than one binding site [15-18], as is the case for example when the soluble binding partner is an antibody or Fc-fusion protein. Bivalent or multivalent binding is a cooperative process, and the apparent binding constant that results reflects a complicated combination of affinity and avidity effects [19]. Importantly, the assumption that surface capture of a protein will quantitatively recapitulate how it might be presented on a cell surface, where avidity effects are often important, is quite mistaken. [11, 20-23] The observed binding will be affected by the density and nature of surface capture in a way that renders the apparent binding strength an essentially arbitrary function of the precise methods and conditions used in a particular experiment, with no broader applicability [18]. The problem of quantitatively characterizing multivalent binding events, which also exists for ELISAs and many other common assay methods, can sometimes be avoided by inverting the experiment to couple the multivalent species to the surface, such that the monovalent binding partner in the solution phase [16]. But this is not always feasible or convenient, depending on the structure and properties of the proteins involved.
Here we describe a general method for using Biacore to measure the interactions between unmodified proteins taking place in free solution, and show that it can provide accurate measures of both binding affinity and stoichiometry over a wide range of interaction affinities. We do this by exploiting the phenomenon of “mass transport-limited” binding [24-27], whereby Biacore assay conditions can be established where the initial rate of binding depends only on the concentration of active analyte in solution. This method can be used to investigate protein-protein or receptor-ligand binding if the derivatized sensorchip is constructed such that it detects only the unbound receptor or ligand. The method involves incubating the ligand and receptor at various concentration ratios in separate reactions, until binding equilibrium is reached. Each reaction mixture is then analyzed separately by passing it over a Biacore sensorchip to which the same receptor has previously been coupled, to create a sensor surface that detects free ligand but does not bind the ligand-receptor complex (Figure 1). The Biacore analysis is done under mass-transport-limited conditions, so that the initial rate of binding gives a measure of the concentration of free ligand present in each pre-equilibrated solution. The resulting data for the concentrations of free versus bound ligand are fitted to a quadratic binding equation to determine the binding affinity of the reaction that occurred in the pre-equilibrated solutions, and also the stoichiometry of the resulting solution-phase complex. We describe the application of this method to both monovalent and multivalent protein-protein interactions, using as examples monovalent and bivalent forms of the EGFR family receptor Her2 (ErbB2/Neu) and monovalent, bivalent and trivalent forms of an anti-Her2 antibody. For the monovalent interactions the equilibrium KD value we obtain is compared to that determined from kinetic experiments using conventional Biacore methodology, and we confirm the stoichiometry of the complex by gel filtration with in-line light scattering. We additionally test the underlying assumptions and limitations of the method by simulation and experiment, and describe a simple method to eliminate errors associated with the presence of inactive protein contaminant in the reagent preparations. Overall, we find that the method provides a convenient approach to characterizing binding interactions in 10−6 – 10−10 M affinity range, and provides a particularly straightforward approach to characterizing the stoichiometry of protein-protein complexes and also for measuring single-site binding affinities without labeling or modifying either binding partner in any way.
Figure 1. Schematic representation of the initial rates method.
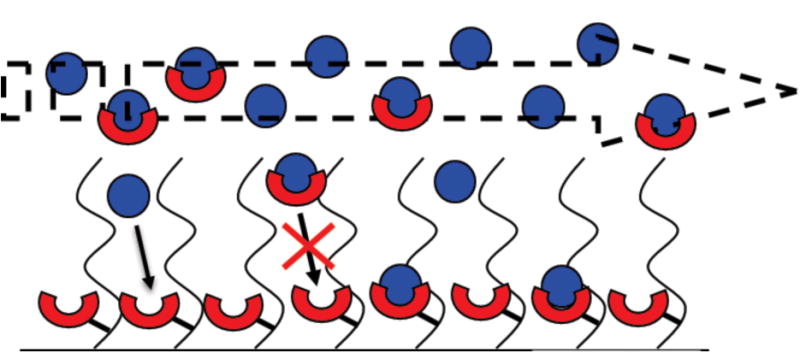
A diagrammatic representation of a flow cell in which receptor (red cups) has been immobilized. An equilibrium mixture of ligand (blue balls) and receptor (red cups) diffuses from the bulk flow into the matrix where receptor is immobilized. Ligand bound to receptor in solution is unable to bind to the chip, whereas free ligand is able to bind to the immobilized receptor.
Methods
Preparation of protein reagents
A portion of the extracellular domain of human HER2 (residues 1-564, which includes the native signal sequence) was cloned into a pCMVSport vector with an 8× His C-terminal tag. Protein was expressed transiently in HEK293S GnTI- cells to reduce glycosylation heterogeneity [28]. HER2 was then purified using affinity capture on an Ni Sepharose 6 FF column (GE Lifesciences), followed by gel filtration on a Superdex 200 10/300 GL column (GE Lifesciences). To remove the high mannose N-linked glycans, HER2 was treated with Endo H according to manufacturer's protocols (New England Biolabs) followed by a second gel filtration step on a Superdex 200 10/300 GL column. Mass spec analysis confirmed the N-terminal residue to be T23. Final purified material stored at −80 °C.
For Her2-Fc, residues 1-652 of the extracellular domain of human HER2 was cloned upstream to the Fc portion of human IgG1. Protein was expressed in Chinese hamster ovary (CHO) DG44 cells. Her2-Fc was purified by affinity capture on a Protein A FF column (GE Lifesciences), followed by gel filtration on a Superdex 200 10/300 GL column (GE Lifesciences). Mass spec analysis confirmed the N-terminal residue to be T23.
65C10-human IgG1 mAb was stably expressed in CHO DG44 cells. Clarified and filtered culture supernatants were purified on recombinant Protein A sepharose FF (GE Lifesciences), followed by gel filtration on a Superdex 200 column (GE Lifesciences).
65C10 Fab was prepared by papain digestion of the 65C10-human IgG1 mAb at 37 °C for 2 hr at an enzyme:mAb ratio of 1:100 in 10 mM Phosphate, 5 mM EDTA, 20 mM Cysteine-HCl, pH 7.5. 65C10 Fab was then purified in flow-through mode by capturing the digested Fc with IgSelect (GE Lifesciences). Purified 65C10 Fab was then dialyzed into 10 mM HEPES, 100 mM NaCl, pH 7 and stored at −80°C.
65C10-THD was generated by cloning the heavy chain of the 65C10 Fab (HV and CH1) upstream of a sequence encoding a (G4S)4 linker and a TNF homology domain. Stable CHO DG44 cell lines were then generated by co-transfection of this construct along with the light chain of 65C10. Since 65C10 Fab binds Protein A, this was used as the initial capture step. Aggregates and high molecular weight species were purified away using gel filtration on a Superdex 200 column (GE Lifesciences). SDS-PAGE analysis showed that the 65C10 Fab Heavy chain-(G4S)4-TNF protein to be intact with no major proteolysis. Comparison of reduced and non-reduced conditions showed that the Fab was disulfide linked.
Biacore surface preparation
All experiments were performed at 25 °C using a Biacore 3000 instrument (GE Healthcare). Her2-Fc or 65C10 mAb were immobilized on CM5 sensorchips using the Biacore Amine Coupling kit according to manufacturer's instructions. Briefly, for kinetic experiments proteins were diluted to 50 g/ml in 10 mM acetate, pH 5.0 and 5 l was injected over chip surfaces that had been activated with a 5 l injection of 1:1 N-hydroxsuccinimide (NHS): 1-Ethyl-3(3-dimethylaminopropyl)-carbodiimide hydrochloride (EDC). Excess free amine groups were then capped with a 50 l injection of 1 M Ethanolamine. Typical immobilization levels were 500-1000 RU. For initial-rates equilibrium experiments proteins were diluted to 50 g/ml in 10 mM acetate, pH 5.0 and 15 l was injected over chip surfaces that had been activated with a 15 l injection of 1:1 N-hydroxsuccinimide (NHS): 1-Ethyl-3(3-dimethylaminopropyl)-carbodiimide hydrochloride (EDC). Excess free amine groups were then capped with a 50 l injection of 1 M Ethanolamine. Typical immobilization levels were 3000-4000 RU. Underivitized control surfaces were prepared in exactly the same manner as the active surfaces except that 10 mM Acetate, pH 5.0 was injected in place of the ligand. For immobilizations the running buffer was biacore buffer (10 mM HEPES pH 7.0, 150 mM NaCl, 3 mM EDTA, 0.005% detergent P-20).
Biacore kinetic binding assays
All samples were prepared in biacore buffer + BSA (10 mM HEPES pH 7.0, 150 mM NaCl, 3 mM EDTA, 0.005% detergent P-20, 0.05% BSA). This same buffer was used as the running buffer during sample analysis. Analytes were diluted in biacore buffer + BSA to the indicated concentrations and injected over the derivatized surface, or an underivatized surface as a background control, at a flow rate of 50 l/min followed by 20 min dissociation with biacore buffer + BSA alone. The surface was then regenerated with 2 × 30 s injections of 5 mM NaOH at a flow rate of 20 l/min. In all cases binding to the blank chip was negligible.
Biacore Initial-rates Equilibrium binding assays
Indicated Her2 and 65C10 constructs were mixed in various ratios in biacore buffer + BSA and incubated at 4 °C for a minimum of 12 hours. 50 l of these solutions were then injected at 5 l/min over a Her2-Fc derivatized surface or an underivatized surface as a background control, followed by a 3 minute dissociation in biacore buffer + BSA. The surface was regenerated with 2 × 20 l injections of 10 mM NaH2PO4 following each sample injection. Using these experimental conditions the binding is mass transport limited during approximately the first minute of binding. The mass transport limited region was determined from the region of the sensorgrams where the slope of the first derivative plot is zero. During the mass transport limited binding phase the initial rate of binding (Vi) is proportional to the concentration of free ligand in solution. As only free the 65C10 construct (65C10 Fab or 65C10 THD) is able to bind to the Her2-Fc surface this method measures the concentration of free 65C10 construct in each solution.
Curve fitting and modeling
Kinetic experiments
Monovalent binding analysis: Affinity and rate constants were determined by global fitting of all concentration sensorgrams to the 1:1 kinetic model for the reaction scheme A + B = AB where ka is the rate of the forward reaction and kd is the rate of the backward reaction shown below within the BIAevaluation software:
Equilibrium experiments
Initial rates data: The affinity and stoichiometry of the interaction of Her2 and 65C10 in solution was determined by plotting Vi versus the concentration of the ligand alone to generate the standard curve. The slope of the standard curve is then used to convert Vi to [L]free. A plot of free ligand concentration in each mixture versus total ligand concentration was fitted to the following quadratic equation, which has the KD and stoichiometric ratio (n) as variables:
Where:
Vi = initial rate of binding
m = slope of the standard curve
[L]f = free Ligand concentration
[L]t = total Ligand concentration
[R]t = total Receptor concentration
Gel filtration with in line static light scattering
SEC was performed using a 300 × 7.8 mm BioSep SEC-S 3000 column (Phenomenex) in Phosphate Buffer consisting of 80 mM Na2HPO4•7H2O, 20 mM NaH2PO4•H2O, 200 mM NaCl, pH 6.8; using a Waters Alliance HPLC instrument coupled to a refractive index detector (Waters, Milford, MA) and light-scattering detector (PD2000, Precision Detectors). The weight average molar mass was determined using the Precision Detector Software. The system was calibrated using BSA assuming isotropic light scattering. Since 65C10-THD, when injected alone, showed non-specific binding to the BioSep-S 3000 column, a TSKgel6000PW xL-CP cationic polymer column was used to determine the molar mass by light scattering.
Immunodepletion
200 g of Receptor antigen-Fc fusion protein was coupled to 200 L settled Pierce Seize-X sepharose beads (Pierce/Thermo Scientific, Rockford IL) in PBS according to manufacturer's instructions. Coupled beads were resuspended in a 1:1 slurry in PBS and aliquoted in 50 L volumes in eppendorf tubes. Tubes were flash spun to pellet beads and allowed to sit at ambient temperature until used. Supernatant from one aliquot of coupled beads was carefully aspirated and a 200 L solution of antibody Fab fragments generated by papain digestion of intact mAb in PBS at an absorbance at 280 nm of 1.35 AU was added. After 30 min incubation at ambient temperature with rotation, beads were pelleted and discarded while the supernatant was carefully recovered and the A280 was measured. The Fab solution was then transferred to a second aliquot of coupled beads from which the PBS supernatant had been carefully aspirated and incubated for 30 min at ambient temperature with rotation. Again the beads were pelleted and discarded while the supernatant was carefully recovered and the A280 was again measured. This procedure was repeated until no further change in A280 was detected. Fraction binding competent Fab was calculated by 1-(A280 final/A280 initial).
Results
We first tested the method for the simple case of the 1:1 interaction between the soluble extracellular domain of the EGFR family receptor Her2 and a monovalent fragment of the anti-Her2 antibody 65C10. Figure 2A shows the results of a conventional Biacore kinetic experiment in which Her2-Fc was immobilized on a CM5 sensorchip at a low density (600 RU), and various concentrations of 65C10 Fab were flowed over at a high flow rate (50 L/min), as described in Materials and Methods. Fitting the data to a 1:1 kinetic binding model yielded the association and dissociation rate constants ka = 1.9 ± 0.1 × 10⁶ M−1s−1 and kd = 3.4 ± 0.2 × 10⁻³ s−1 (n = 3), corresponding to an equilibrium dissociation constant of KD = 1.9 ± 0.1 nM. Figures 2B-E show the equilibrium binding of 65C10 Fab and the soluble, monomeric extracellular domain of Her2 (rsHer2), taking place in free solution, measured using our initial rates method. Figure 2B (upper panel) shows Biacore data for various concentrations of 65C10 Fab from 0-150 nM passed over a biacore chip to which Her2-Fc had been coupled at the high immobilization level of 3500 RU. These runs were performed at a flow rate of 5 μL/min, because it is known that low flow rates combined with high immobilization densities on the chip tend to favor mass-transport limited binding [8, 29]. That binding is indeed mass-transport limited under these conditions is shown by the fact that the initial region of each progress curve is linear [24, 30]. The lower panel of Figure 2B shows the progress curves transformed to represent the first derivative of the signal, dRU/dt, versus time, showing that each curve has a prolonged initial rate region where the slope is constant. The initial rate region persists for longer at lower concentration of analyte, because it takes longer for enough binding sites on the chip to become occupied such that receptor-ligand binding within the dextran matrix becomes rate-limiting compared with diffusion into the matrix [29, 30]. Figure 2C shows that a plot of the initial rates for the curves from Figure 2B against analyte concentration gives a straight line, establishing that under these conditions the initial rate of binding provides a measure of the concentration of free 65C10 Fab present in the test solutions.
Figure 2. Kinetic and equilibrium (initial rates) analysis of monomeric Her2 – 65C10 Fab binding.
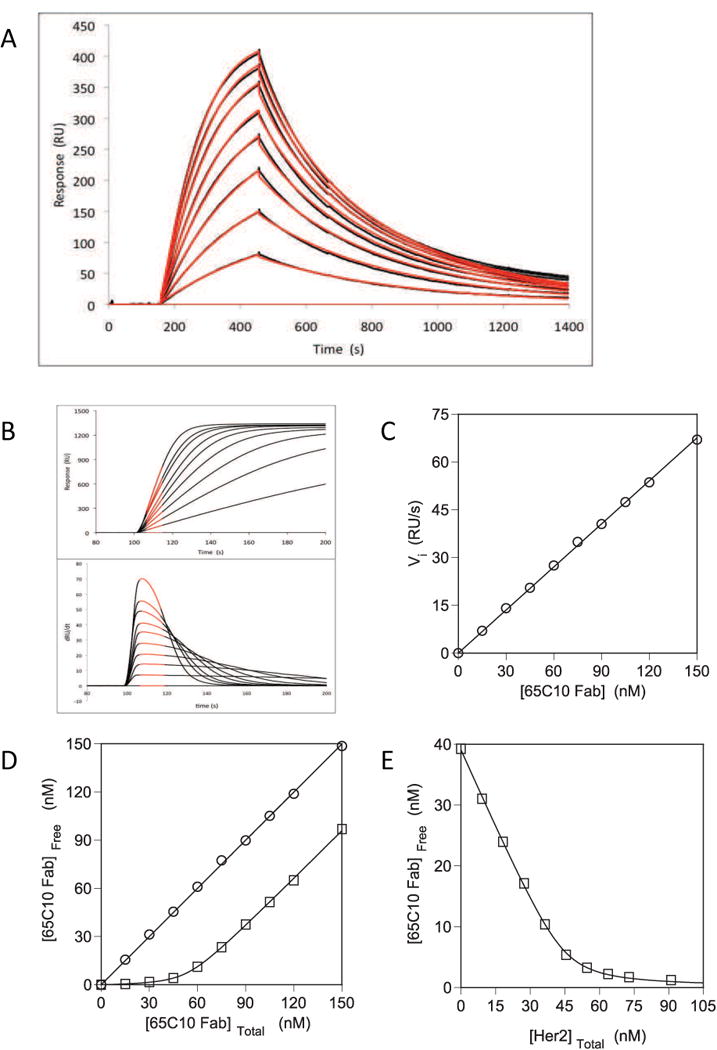
(A) Sensorgrams for 0.6 – 6 nM 65C10 Fab binding to Her2-Fc immobilized at a low density (600 RU) on a Biacore CM5 sensorchip. The affinity of 65C10 Fab binding to immobilized Her2-Fc was calculated from KD = kd/ka as determined using the rate equations within the BIAevaluation software as described in Methods. Data are representative of at least 4 experiments. (B) Upper panel: Association phase of sensorgrams for 15 – 150 nM 65C10 Fab bindng to Her2-Fc immobilized at a high density (3500 RU) on a Biacore CM5 sensorchip. Lower panel: Derivative plot of sensorgrams shown in upper panel showing an extended region of linear slope indicating that binding is mass transport limited. (C) Separate solutions containing the indicated concentration of 65C10 Fab (open circles) run over a Her2-Fc derivatized CM5 chip as described in Methods. The slope of this standard curve is used to convert the initial rate of binding (Vi) to concentration of free 65C10 Fab in solution. (D) Separate solutions containing the indicated concentration of 65C10 Fab alone (open circles) or 65C10 Fab plus 60 nM soluble, monomeric Her2 (open squares) were preincubated for 8 hours and then run over a Her2-Fc derivatized CM5 chip as described in Methods. The concentration of free 65C10 Fab in solution can be determined by reference to the standard curve. (E) Separate solutions containing the indicated concentration of soluble, monomeric Her2 plus 60 nM 65C10 Fab (open squares) were preincubated for 8 hours and then run over a Her2-Fc derivatized CM5 chip as described in Materials and Methods. The affinities and stoichiometries of the solution phase binding of Her2-Fc fusion protein to 65C10 Fab were determined by fitting the data to the appropriate quadratic equation (solid lines) as described in Methods.
To measure the binding of 65C10 Fab to Her2 various concentrations of 65C10 were incubated with or without 60 nM rsHer2 at 4 °C for 12 h, and then each solution was analyzed by Biacore using an Her2-Fc-derivatized chip under the same conditions shown in Figure 2B. Figure 2D shows the results obtained for analysis of the test samples containing Fab alone or Fab plus 60 nM rsHer2 after the raw Vi measurements were converted to [65C10]free values using the standard curve from panel C. The open squares in Figure 2D show that pre-incubation with 60 nM rsHer2 decreased the concentration of free Fab in all samples, consistent with a portion of the Fab being bound by rsHer2 in solution and thus being unavailable to bind to the Her2-Fc-derivatived Biacore chip surface. At low total Fab the free Fab concentration is very low, indicating that all or most of the Fab is bound to rsHer2 in solution. However, at Fab concentrations above ∼60 nM the curve becomes parallel to the Fab-only control curve (circles), indicating that additional equivalents of Fab above this amount contributes directly to the free Fab concentration in solution, as expected if each rsHer2 molecule can bind only one equivalent of Fab. Fitting these data to a quadratic binding equation (see Materials and Methods) returns an affinity of KD = 1.7 ± 0.8 nM (n = 5), in excellent agreement with the kinetic data shown in Figure 2A, and also a stoichiometry of 0.9 ± 0.1 (n = 5) equivalents of 65C10 Fab bound to each molecule of soluble monomeric Her2. Figure 2E shows an alternative way to perform this binding analysis, in which the concentration of 65C10 Fab is held constant (at 40 nM, in this example) and the concentration of Her2 in the different solutions is varied. As the concentration of Her2 is increased, a greater fraction of the Fab in solution become bound, reducing the concentration of free Fab that can be detected by the Her2-Fc chip and thus causing Vi to decrease to zero. Fitting these data to the same quadratic binding equation yielded values of KD = 1.7 ± 0.8 nM and stoichiometry = 0.8 ± 0.1 (n = 5), nearly identical to those obtained from the experiment shown in Figure 2D.
To test the ability of the method to characterize a protein-protein binding interaction with a more complicated stoichiometry we performed similar experiments, but using the dimeric receptor construct Her2-Fc, in which the soluble extracellular domain of Her2 has been fused to the Fc portion of human IgG1, and a trimeric form of the 65C10 antibody in which the Fab fragment had been fused to the C-terminus of the soluble, homotrimeric TNF homology domain (THD) of a TNF family ligand (65C10-THD). Figure 3A shows the conventional Biacore kinetic analysis of 65C10-THD (0.2 – 2 nM) binding to Her2-Fc immobilized at a low density (400 RU) on the Biacore sensorchip. Fitting these data to a 1:1 binding model yielded an apparent binding affinity of KD(app) ≤ 0.01 nM, obtained from the ratio of the rate constants ka ≥ 1 × 10⁶ M−1 s −1 and kd ≤ 1 × 10⁻⁵ s−1. This estimate for KD(app) is an upper limit only, because dissociation of the trivalent Fab construct is too slow to be reliably measured during the 20 minute dissociation time used in these experiments. Even with a long-term dissociation experiment in which the dissociation was monitored for 20 hours dissociation was not sufficient to obtain a reliable estimate of the off-rate (data not shown). Stronger binding for this multivalent construct is expected, because the 65C10-THD construct in the mobile phase contains three antibody domains and therefore has a substantial avidity advantage over the monomeric Fab fragment characterized in Figure 2. However, the extent of this avidity advantage will depend not only on the valency of the soluble binding partner but also on factors such as the density of the immobilized Her2-Fc on the chip surface, the spatial distribution of the Her2 domains, the flexibility and mobility of the receptor and ligand binding domains and other physical chemical factors that are specific to the particular conditions used. Even relative KD(app) values obtained by comparing the binding of different multivalent constructs under identical conditions will vary depending on the precise set-up [18, 31, 32]. Thus, KD(app) values measured for the binding of multivalent ligands to a binding partner that is captured on a surface or matrix cannot in general be quantitatively interpreted in a meaningful way. (The effects of ligand density on the chip surface and of analyte valency on the shape of the sensorgams and on the measured off rate are shown as supplementary material in supplementary figure S1).
Figure 3. Kinetic and equilibrium (initial rates) analysis of dimeric Her2-Fc – trimeric 65C10-THD binding.
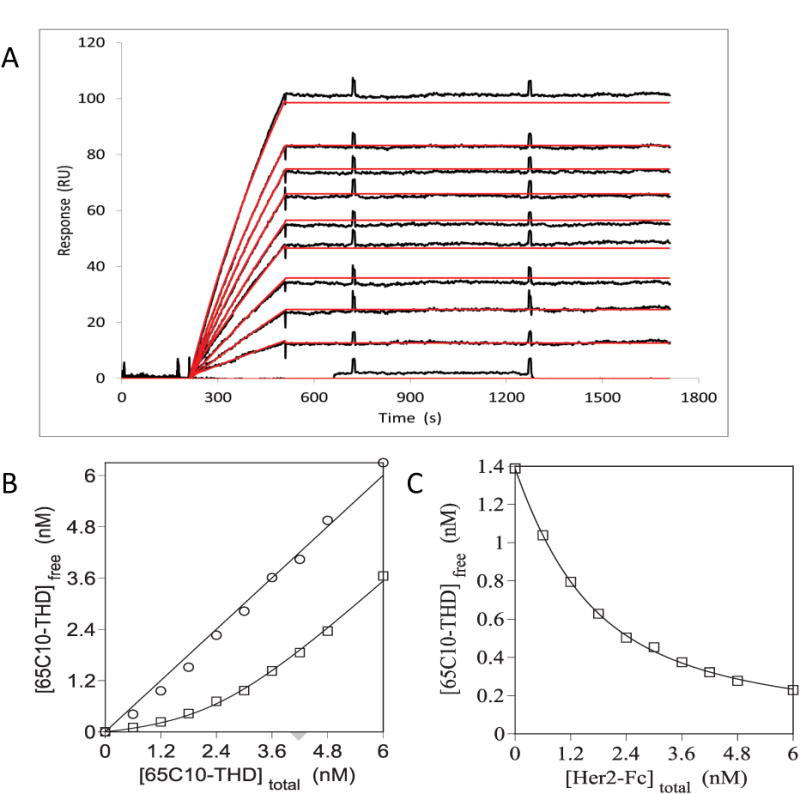
(A) Sensorgrams for 0.2 – 2 nM 65C10 THD binding to Her2-Fc immobilized on a Biacore CM5 sensorchip. The affinity of 65C10 THD binding to immobilized Her2-Fc was calculated from KD = kd/ka as determined using the rate equations within the BIAevaluation software as described in Methods. (B) Separate solutions containing the indicated concentration of 65C10 THD alone (open circles) or 65C10 THD plus 3.6 nM Her2-Fc (open squares) were preincubated for 8 hours and then run over a Her2-Fc derivatized CM5 chip as described in Methods. The concentration of free 65C10 THD in solution can be determined by reference to the standard curve. (C) Separate solutions containing the indicated concentration of soluble, monomeric Her2-Fc plus 1.6 nM 65C10 THD (open squares) were preincubated for 8 hours and then run over a Her2-Fc derivatized CM5 chip as described in Materials and Methods. The affinities and stoichiometries of the solution phase binding of Her2-Fc fusion protein to 65C10 THD were determined by fitting the data to the appropriate quadratic equation (solid lines) as described in Methods.
Figures 3B and C show the results of applying our initial rates binding method to the multivalent interaction of 65C10-THD with Her2-Fc in solution. In Figure 3B various concentrations of 65C10-THD from 0.6 – 6 nM were incubated with or without 3.6 nM Her2-Fc, and after equilibrium was reached the solutions were analyzed under mass transport-limited conditions over a Biacore chip surface derivatized with Her2-Fc. The initial rate data for the solutions containing 65C10-THD alone were used to construct a standard curve (not shown) for converting Vi values into free 65C10-THD concentrations, exactly as was done for monovalent Fab in Figures 2B and C. Figure 3B shows the free 65C10-THD values plotted as a function of total added 65C10-THD for the solutions incubated with and without the 3.6 nM Her2-Fc. Fitting these data to the quadratic binding equation yielded an apparent affinity of KD(app) = 0.4 ± 0.1 nM and a Her2-Fc:65C10-THD stoichiometry of 1.4 ± 0.1:1 (n = 5), equivalent to a stoichiometric ratio of 3:2. Figure 3C shows the reverse titration in which 65C10-THD was held constant at 1.6 nM and the concentration of Her2-Fc was varied in each solution. The quadratic fit to these data yields an apparent affinity of KD(app) = 0.5 ± 0.2 nM and a stoichiometry of Her2-Fc:65C10-THD = 1.6 ± 0.1:1 (n = 5), again equivalent to 3:2, essentially identical to the values obtained from Figure 3B. Note that the apparent KD value determined in these experiments reflects the true solution-phase binding properties of these multivalent constructs and so, unlike apparent KD values measured using a surface-captured protein, this value and should be essentially independent of the precise method or conditions used and thus provides information about the inherent in binding properties of the proteins used.
To further test the reliability and precision of stoichiometry measurements made using our solution-phase Biacore method, we used this approach to compare the binding of monomeric rsHer2 to monovalent (Fab), bivalent (full monoclonal antibody) and trivalent (THD fusion) forms of antibody 65C10. Figure 4A shows the results of incubating various concentrations of rsHer2 with fixed concentrations of each of the three antibody constructs. Fitting the results of each binding curve to the quadratic binding equation returned rsHer2:65C10 ratios of 0.9 ± 0.1 (n = 2), 0.52 ± 0.02 (n = 2) and 0.30 ± 0.08, (n = 3) for Fab, mAb and THD fusion, respectively, consistent with the expected result that these three forms of the antibody respectively bind 1, 2 and 3 equivalents of monomeric rsHer2. To confirm these results we also determined the stoichiometry of each of these three complexes by gel filtration with in-line static light scattering (GF/LS). In these experiments monomeric rsHer2 and the various forms of 65C10 were run individually over a gel filtration column, and static light scattering (LS) was used to determine the molecular weights as described in Materials and Methods. Figure 4B shows GF chromatograms for rsHer2 and each form of 65C10 antibody alone, and for each form of the antibody in complex with rsHer2. The stoichiometry of each complex was determined by comparing its molecular weight measured by LS to the expected molecular weight of a complex containing the form of 65C10 used plus one, two or three Her2 molecules. Figure 4C shows that the stoichiometries measured by GF/LS agree in each case with the stoichiometric ratios determined using our initial rates Biacore method. (Light scattering homogeneity plots are shown as supplementary material in supplementary figure S2).
Figure 4. Stoichiometry of Her2 binding to mono- bi- and trivalent forms of 65C10.
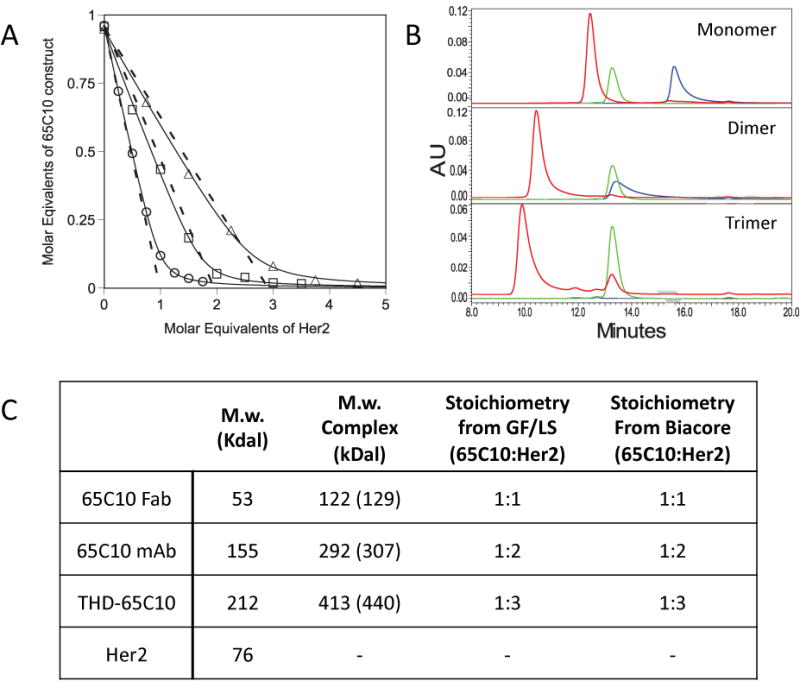
(A) Stoichiometries determined by initial rates analysis. Her2-Fc was immobilized at a high density on one flow cell of a CM5 sensorchip as described in Methods. Various molar ratios of monomeric Her2 and monovalent (open circles), bivalent (open squares), or trivalent (open triangles) 65C10 were mixed in biacore buffer and allowed to come to equilibrium. Mixtures were then run over the Her2-Fc chip at flow rate of 5 l/min and the initial rate of binding was determined as described in Methods. Data were fit to a quadratic binding equation to determine the stoichiometry of binding. Stoichiometries determined are shown in (C). (B) Stoichiometries determined by SEC/LS. 10 M Monomeric Her2 and 4 M monovalent, 2 M bivalent, or 1 M trivalent 65C10 were mixed in PBS and allowed to come to equilibrium. Her2 (green traces), indicated form of 65C10 (blue traces) and mixtures (red traces) were run over a size exclusion column and elution was monitored by A280. Molecular weights of the eluted proteins were determined by in-line static light scattering (SLS). All SLS profiles are in Supplemental Figure S2. (C) Stoichiometry was determined by comparing the observed molecular weight to the expected mw of the fully occupied complex (shown in parentheses) based on the amino acid sequence mw of the individual proteins. These are compared to the stoichiomeric ratios determined by the initial rates method shown in (A).
The ability of our method to define interaction stoichiometries as well as binding affinities depends on the concentrations of the interacting species used in the experiment. As is well known, when binding is measured using concentrations of both binding partners that are close to the KD for their interaction, the observed binding curve becomes quadratic in form rather than hyperbolic (Figure 5), because the approximation that [Ligand]free ∼ [Ligand]Total cannot be applied [33, 34]. Specifically, the binding curve will be noticeably quadratic if the concentration of the component held constant is greater than about 0.1 times the interaction KD. Under these conditions the concentration of the fixed component and the stoichiometry of the interaction become explicit variables in the binding equation, and so can be determined by fitting experimental data. The higher the concentration of the fixed component in relation to KD, the more pronounced the quadratic behavior, and the more precisely the stoichiometry is defined. Indeed, if the fixed component is present at a concentration far above the KD then the binding curve becomes simply a direct titration of one component against the other, and the ability to determine the affinity of the interaction is lost (Figure 5). In our experience using the solution-phase Biacore method, the measurements fall into three concentration domains, as illustrated in Figure 5: (i) When the concentration of the fixed component is <0.1 × KD then the binding curve is approximately hyperbolic, and the data return precise values for binding affinity but the stoichiometry of binding cannot be reliable determined. When the concentration of the fixed component is 0.1-100 × KD then the binding curve is clearly quadratic, and the data return reasonably precise values for both binding affinity and stoichiometry. (iii) When the concentration of the fixed component is >100 × KD then the binding curve is essentially a direct titration with a sharp end-point, and the data return a precise value for the stoichiometry but affinity cannot be determined. In practice, whether the binding affinity and/or stoichiometry can be accurately determined or not under a given set of conditions depends also on the number and the precision of data points in the titration curve, especially in the region around the stoichiometric equivalence point.
Figure 5. Simulated binding isotherms showing how curve shape varies with KD.
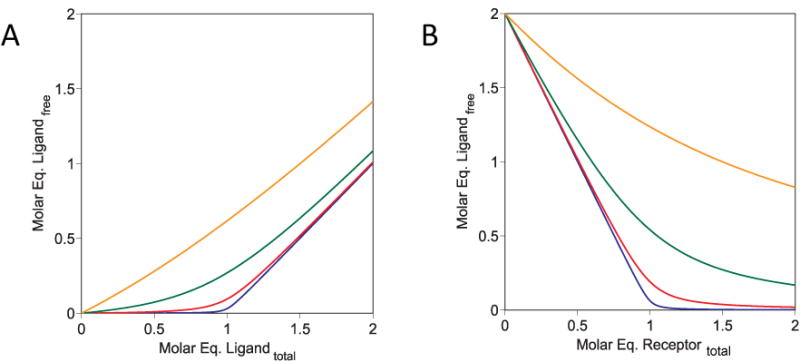
Binding data simulated using the quadratic binding equation with the stoichiometric ratio fixed at 1 arbitrary molar unit. (A) The concentration of receptor was fixed at 1 unit, and the concentration of ligand varied from 0.01 to 100 units. (B) The concentration of ligand was fixed at 1 unit, and the concentration of receptor varied from 0.01 to 100 units. For each isotherm KD was fixed at 0.001 (blue line), 0.01 (red line), 0.1 (green line), or 1 (orange line) units respectively.
It is important to recognize that the stoichiometry value returned by our method represents the stoichiometric ratio between the components in the complex, not directly the molecular composition of the complex. Thus, an observed stoichiometry of 1:1 could indicate a complex composition of 1:1, 2:2 or any equimolar ratio n:n. In many cases the structures of the proteins indicate which absolute stoichiometry is more likely, but where this is not the case then some absolute method for determining the size of the complex must be used to resolve the ambiguity. Moreover, as with any biochemical binding assay, the accuracy of the results obtained depends on the accuracy with which the concentrations of ligand and receptor present in each reaction mixture are known. In the present experiments the protein concentrations were determined from absorbance at 280 nm using extinction coefficients calculated from the amino acid sequence, using the method of Pace et al. [35]. This method is usually considered accurate to within a few percent for determination of the total concentration of a pure protein. However, a systematic error in both affinity and stoichiometry values will be introduced if any significant fraction of the protein is inactive in terms of its ability to engage in the binding interaction under study. The impact of an error in the concentration of active protein is greater for stoichiometry determination than for affinity measurement. Typically, even a two-fold error in binding affinity will not greatly affect the utility of this information, but for stoichiometry a two-fold error could lead to a fundamentally incorrect conclusion about the composition of the complex. This problem is especially acute for higher order complexes, where for example the difference in stoichiometric ratio between a 3:2 complex and a 1:1 complex is just 33%. It is therefore useful to have some method for verifying that the proteins being used in these or any other binding experiments are fully active.
To validate the functional homogeneity of the proteins we use in our solution phase Biacore assay we have developed a method based on the ability of the protein in question to bind to beads coated with its binding partner. Figure 6 shows an illustrative example of this method, for a Fab fragment (unrelated to the antibodies described above) generated by papain digestion of its parent monoclonal antibody. The digestion products from this reaction looked clean by SDS-PAGE, but when titrated against soluble antigen using our solution-phase Biacore method the results indicated a stoichiometry that was not a simple ratio of whole numbers. To test the functional homogeneity of the Fab preparation we tested its ability to be immunoprecipitated using Pierce Seize-X sepharose beads to which we had chemically coupled its cognate antigen, expressed as an Ig-fusion protein. A starting solution of Fab at a concentration giving A280 = 1.35 absorbance units was incubated with 25 μL of the derivatized beads. After 30 min the beads were pelleted, and the absorbance of the supernatant was read at 280 nm. This supernatant was then incubated with another 25 μL of beads for 30 min, after which the beads were pelleted and again the absorbance of the supernatant was read. This procedure was repeated until no further decrease in absorbance was achieved by exposure to fresh aliquots of antigen-derivatized beads. Figure 6 shows that after three cycles of immune-depletion the absorbance of the supernatant remained constant, at A280 ∼ 0.5, or ∼ 35% of the initial absorbance, implying that ∼35% of the protein in the Fab preparation was inactive in respect to its ability to bind antigen. When the concentration of the Fab preparation was corrected to account for the presence of this inactive material, the results of the Biacore titration now gave the expected value of 1:1 for the stoichiometry of the complex, indicating that the immuno-depletion method had identified and eliminated the error in the concentration of active Fab. An assessment of the fraction of active material can be critical for the correct interpretation of the stoichiometry results obtained by the Biacore method. In our experience the fraction of inactive material present in a given protein preparation is highly variable, even when the protein appears homogeneous by SDS-PAGE, and has ranged from none (100% active material) to nearly 60% inactive material. In particular, 10% to 20% inactive material is not uncommon in Fabs generated by papain digestion, or in proteins that require harsh elution conditions from immuno-affinity columns (data not shown). Clearly, the immuno-depletion approach described above could equally well be performed using more sensitive methods for assessing the concentration of unbound protein remaining in the supernatant, such as ELISA, allowing it to be performed at lower protein concentrations, provided the interaction with the binding partner on the bead is of sufficiently high affinity to achieve effective depletion under the desired conditions.
Figure 6. Determination of the binding-competent fraction.
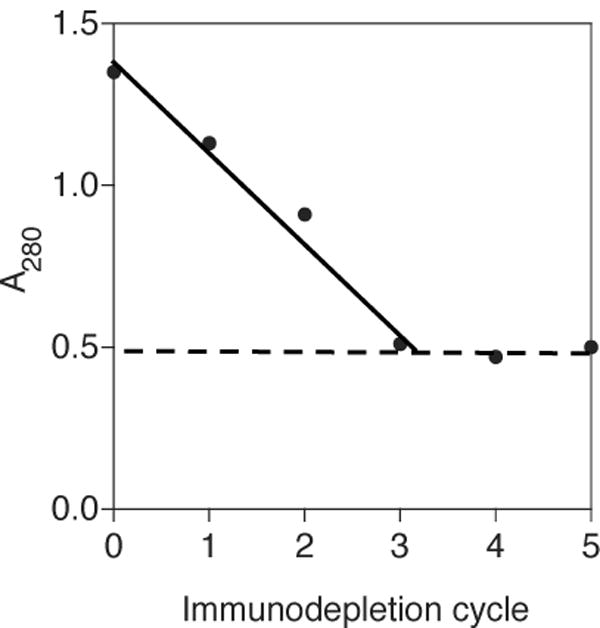
The fraction of a Fab solution competent to bind to its antigen was determined by serial immunodepletion of the Fab. A280 of the starting stock was measured and then exposed to antigen immobilized on sepharose beads for 10 min. Beads were removed by centrifugation and the amount of protein remaining in the supernatant was determined by A280. This procedure was repeated until no further reduction in A280 was observed. The competent fraction was determined by 1- (A280 final/A280 initial).
To determine the robustness of the stoichiometry values obtained using our method, with respect to errors in the concentrations of the protein reagents, we generated binding data with protein stock solutions containing intentional, systematic errors in the nominal protein concentration, varying from 2-fold below to 2-fold above the true concentration. The resulting binding curves obtained by the solution phase method were fitted using the quadratic binding equation, with the total ligand and receptor concentrations fixed at their nominal (i.e. mostly erroneous) values. The results showed that errors in KD and stoichiometric ratio were roughly proportional to the error in protein concentration. Thus, users of the method need not be concerned that small errors in the concentrations of the protein reagents might propagate into large errors in the resulting affinity and stoichiometry values. In our experience, if the concentrations of the protein reagents are each known to a precision of about 10% then in most instances the correct stoichiometry will be observed, and even larger errors can usually be tolerated for the purpose of measuring affinity values. (Results of the protein concentration error experiments are collected in supplementary table 1).
A condition of the initial rates Biacore method, as described above, is that only free ligand is able to bind to the receptor immobilized on the chip. However, in experiments involving multivalent ligands it might sometimes be possible for partly occupied ligand species to accumulate that can also bind to the receptor-derivatized Biacore chip surface. For example, Figure 7A shows the different species that can form when a trivalent ligand such as a TNF family cytokine is incubated with a soluble, monomeric form of its receptor. If a mixture of these species is analyzed over a sensor surface presenting the receptor protein, then we can predict that the free trimeric ligand will be bind to that surface and be detected, while the fully occupied LR3 complex will not. However, whether the partially occupied ligand complexes, LR and LR2 will bind to the sensor surface will depend on the affinity of monovalent or bivalent binding between L and R, and potentially also on the density with which the receptor is presented on the sensor surface. In some cases this complexity can be eliminated by immobilizing the ligand rather than the receptor on the Biacore chip (the designations “ligand” and “receptor” are entirely arbitrary for the purposes of this method). For example, in the case shown in Figure 7A, while there are several different forms of unoccupied or partially-occupied ligand that might be detected on a sensorchip surface presenting immobilized receptor, only one species – the free receptor – can interact with a Biacore chip to which ligand has been coupled. However, performing the experiment in this format might sometimes not be practical, leaving the set-up shown in Figure 7A as the only option. Fortunately, situations in which species other than free ligand can bind to the sensorchip are easily diagnosed due to distinctive features of the resulting binding curves. The possible outcomes can be understood as follows: Figure 7B shows, for the trivalent ligand in Figure 7A, how the distribution of possible receptor-ligand complexes (free ligand, LR, LR2 and LR3) varies as a function of the ligand-receptor molar ratio, in the case where the proteins are present at concentrations well above their KD for binding, and the three binding sites on the ligand are independent of each other and so no cooperativity is observed. This simulation shows that substantial amounts of the partly occupied complexes LR and LR2 accumulate at intermediate ligand-receptor ratios, such that if these species can bind to the sensor surface they would be expected to have a substantial effect on the magnitude of the observed signal. Exactly how much the signal will be affected depends not only on the extent to which these intermediate complexes bind to the sensor surface, but also on their molecular weight and rate of diffusion relative to free ligand. Large complexes generate more SPR signal per binding event and thus contribute more to the initial velocity dRU/dt; slowly diffusing complexes diffuse more slowly from free solution into the dextran matrix that coats the chip surface, and thus accumulate on the sensor surface at a lower rate, reducing the initial velocity that is observed. These two effects cancel to some extent, though not necessarily exactly, such that on a mole for mole basis the partially occupied complexes might contribute more or less to the observed initial velocity than does free L, or about the same. Figure 7C shows a simulated binding curve for a situation in which RL and RL2 can bind to the sensor surface where these complexes give a larger signal per mole than does free L. In this instance the titration curve looks very different from the behavior observed in the standard case, as was shown for example in Figures 2E, 3C or 4A. The detection of the large complexes, which accumulate at intermediate ligand-receptor ratios, causes the initial velocity to increase with increasing [R], before it begins to decrease as all of the ligand is converted into the undetectable LR3. (Deviations from simple quadratic behavior that are expected if the titrations are performed in the reverse format, keeping [R] fixed and varying [L] are shown as supplementary material in supplementary figure S3).
Figure 7. Effect of multiple species binding to the sensorchip on the curve shape of the initial rates data.
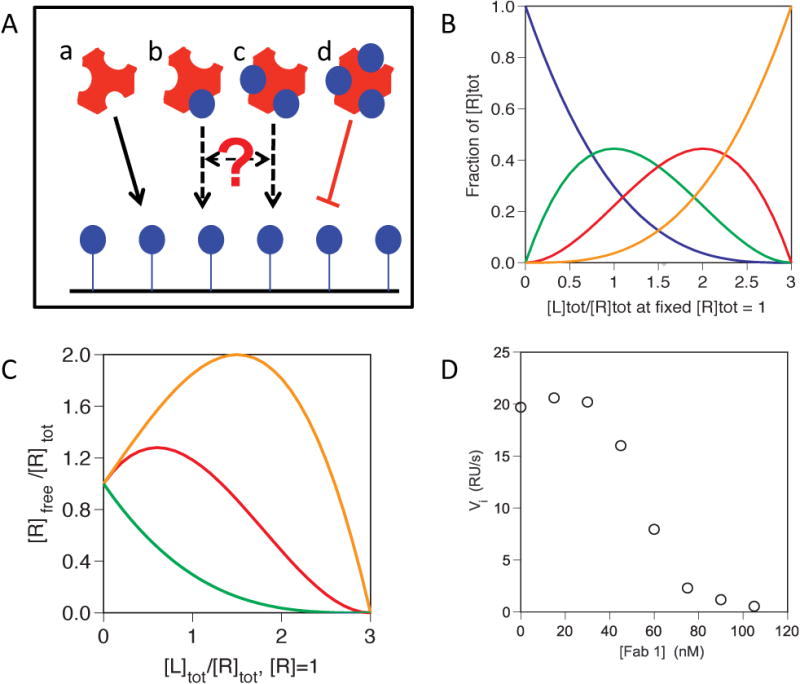
(A) Cartoon of species that could form in solution with a trivalent ligand and monomeric receptor: a, b, c, d represent Ligand with 0, 1, 2 or 3 sites occupied respectively. (B) Statistical distribution of species present at equilibrium assuming independent, equivalent sites of infinite affinity as molar ratios of ligand and receptor vary and 0 (blue line), 1 (red line), 2 (green line) or 3 (orange line) ligand sites become occupied with receptor. (C) Simulated binding isotherms holding ligand constant at 1 arbitrary molar unit and varying [R], showing how the curve shape changes as free L alone (green line), L + LR (red line) or L + LR +LR2 (orange line) bind to an R derivatized chip. (D) Binding isotherm observed for a homotrimeric TNF family ligand and Fab fragments of an anti-ligand antibody. Ligand was held constant at 20 nM and [Fab] was varied as indicated.
The validity of these simulations was confirmed by experiment, shown in Figure 7D. These data were generated using Fab fragments derived from a murine monoclonal antibody raised against a TNF family cytokine, titrated against a fixed concentration of 20 nM of the cytokine. The reaction mixtures were analyzed using a Biacore sensorchip presenting the cognate receptor for the TNF family ligand, creating a surface that could detect the free ligand and also partially occupied ligand complexes present in solution. The results show a titration curve with the non-quadratic form expected from the simulation in Figure 7C, consistent with the notion that the partially occupied species contribute more SPR signal per binding event than free ligand alone. The first data point where [R] = 0 is the signal obtained with 20 nM ligand alone binding to the chip. As the [R] is increased the SPR response initially increases, and then begins to decrease as the predominant species present in solution become the fully occupied ligand (i.e. LR3) which is unable to bind to the chip. These results cannot be used in any straightforward way to derive the affinity or stoichiometry of the interactions, because the curve shape depends on a large number of variable parameters, but they serve as a diagnostic indication that multiple forms of the ligand can bind to the chip, and that an alternative format for the experiment should be sought. In addition these confirm that the Fab used in this experiment is indeed able to block the interaction of this TNF family ligand with its cognate receptor, used as the detection reagent on the Biacore chip. If this were a non-blocking Fab one would expect that even the fully occupied species, LR3 (ligand with 3 Fabs bound) would also be able to bind to the receptor-derivitized surface. It should be noted that in cases where a partially occupied multivalent ligand species is able to bind to the chip, but where the slower diffusion rate expected for a larger species exactly cancels the increased SPR signal, the resulting binding curve may look quadratic in nature, and the quadratic equation may reasonably fit the data, but incorrect values for KD and particularly for the stoichiometry will be returned. The stoichiometric ratio may be a non-integral value, or may not make sense based on what is known about the structures of the proteins used. In any case an orthogonal method for determining the binding competence of the proteins in question, such as the immunoprecipitation method presented here, should be used to confirm the activity of the proteins and thereby the validity of the results obtained.
Discussion
The method we describe here provides a versatile and complementary alternative to the more common kinetic Biacore methodology for characterizing ligand-receptor interactions. Measuring binding kinetics by Biacore is a well-established method for characterizing noncovalent binding interactions that has been applied to numerous types of biomolecules including proteins, nucleic acids, polysaccharides, lipids and small molecule ligands [36-38]. For anything but the simplest situations detailed kinetic analysis can, however, become quite complex. Even for a ‘simple’ 1:1 binding interaction interpretation of binding kinetics is not always straightforward. Factors such as heterogeneity in the presentation of the binding partner on the sensor surface, multi-step binding mechanisms, re-binding effects, and mass-transport limitations, can complicate the data and make definitive analysis very difficult [39-43]. For multivalent analytes in particular, avidity effects can complicate both the kinetics of binding and also interpretation of equilibrium binding levels in ways that can be dependent on the particular experimental conditions used [18, 19]. Depending on the nature of the molecules being investigated, some of these complications can sometimes be circumvented by careful experimental design. However, there are many situations where the nature of the interaction mechanism will ineluctably lead to kinetic behavior that is intractably complex.
The method we describe here can be used to characterize a wide range of protein-ligand interactions. After applying the technique across many different protein-protein interaction systems, over more than a decade, we have found it to be useful for characterizing binding events with affinities that span the range from 10−6-10−10 M (data not shown). The method is especially useful in instances where there is concern that covalently modifying one or other binding partner, for example by coupling it to the Biacore sensorchip, might affect its binding properties, and also in situations where the analyte can potentially bind multivalently such that the observed binding affinity in a conventional experiment will be an arbitrarily affected by the density with which its binding partner is presented on the sensor surface [44, 45]. When one of the binding partners is used as the capture molecule for detection of the free fraction of the other, the potential exists for the covalent modification of the capture molecule by direct immobilization on the chip to alter its affinity for its binding partner. However, the solution-phase method we describe requires only that the chip surface specifically detects the free ligand in solution, and is independent of the precise affinity of the reaction on the surface. Because the method involves pre-equilibration of unlabeled ligand and receptor in solution, and only uses Biacore to assess the distribution of bound and free forms that exist in these reaction mixtures, many complications are avoided, and the results obtained will in general reflect the intrinsic interaction properties of the molecules under investigation. In concept, the method is closely related to the ELISA method of Friguet et al. [46], in which binding partners are pre-equilibrated in solution and then the distribution of bound versus free components is measured by means of an ELISA assay in which one of the binding partners is used as the capture reagent. The KinExA instrument, marketed by Sapidyne Instruments, is designed to perform similar experiments, but with free ligand detected using antibody-coated beads. The main advantage of performing these experiments using Biacore, as compared to by ELISA or KinExA, is that the Biacore does not require a secondary detection reagent. Even in KinExA, while the interaction of interest is between two unmodified proteins, free in solution; generation of the signal requires a fluorescently labeled, non-blocking secondary reagent to detect free ligand captured onto the micro affinity column [47]. A few examples of the use of Biacore to measure the interaction between soluble binding partners have been reported, by us [18, 48] and by others [49, 50]. In the current work we evaluate the utility of this method for measuring both binding affinity and the stoichiometry of the resulting complex, and we systematically explore the scope and limitations of the method, and also the impact of systematic error arising from poor quality protein preparations and how to experimentally identify and correct for this error.
The method is not a competition assay per se, in that there is no competitive binding equilibrium established between the binding partners interacting with each other in solution versus interacting with the sensor surface. Rather, the method is designed such that the Biacore analysis provides essentially an instantaneous snapshot of the distribution of bound versus free species that exist at equilibrium in the pre-incubated reaction mixtures. In the Biacore 3000 instrument the volume of the flow cell is 20 nL. At a flow rate of 5 L/min used in these experiments each 20 nL volume is in contact with the chip for 0.24 seconds. Thus, any complex with a half-life for dissociation of more than ∼1 s will not be in contact with the chip surface for long enough for appreciable re-equilibration to occur. Assuming a typical association rate constant for a macromolecular complex of no more than 106 M−1s−1, complexes with KD < 1 μM (i.e. 1 s−1/10−6 M−1s−1) should typically have sufficient kinetic stability for the method to work. In cases of very low affinity or fast-dissociating interactions, if the potential for re-equilibration is a concern this possibility might be tested by changing the flow-rate and seeing if it affects the titration curve in the expected manner (i.e. a slower flow would give more opportunity for re-equilibration and therefore would presumably make the binding in solution appear weaker).
The method requires that the biosensor surface can detect the free fraction of one or other of the binding partners. However, it is not necessary to use one of the binding partners as the detection reagent. If covalently attaching one of the binding partners as the capture molecule renders it unable to bind its ligand, a different molecule, for example a blocking antibody, can be used instead as the basis for the detection surface. The only requirement is that the resulting sensor surface selectively detects the free form of one of the binding partners, and does not significantly detect the bound complex. This flexibility allows a wide choice of detection reagents, giving various options for biosensor surface preparation in the event that good regeneration conditions cannot be found for a particular capture reagent. Furthermore, the method relies on establishing mass transport limited binding, because this is the condition under which the initial rate of binding is proportional to the concentration of free analyte in solution. This is achieved, as described in the Methods, by utilizing a high surface density and slow flow rate [43]. Mass-transport limited binding is a common feature of kinetic Biacore assays that must be accounted for in the binding model, and can significantly complicate the kinetic analysis [16, 29]. Mass-transport limited binding in practice is easier to achieve than to eliminate, and so it is an advantage of our method that such conditions are required.
An important feature of the method we describe is its ability to precisely determine the stoichiometry of reversible noncovalent complexes, and to do this over a wide range of interaction affinities. As shown in Figures 2 and 3, the data directly establish the concentration of the varied component required to fill all binding sites in the component present at fixed concentration. With appropriate choice of concentrations it is possible to get both affinity and stoichiometry data from a single experiment. If one or other of these piece of information is more desired, it is possible to bias the data in favor of one over the other for a more precise determination. For example, by using a concentration of the fixed component that exceeds KD by >10-fold, more of the data points contribute to precisely defining the stoichiometry of the interaction at the expense of affinity information. Conversely, by carrying out the titration at concentrations of the fixed component that are ≤KD, more of the data points contribute to precise affinity determination with a corresponding loss in precision in the stoichiometry determination. Our experience indicates that a concentration of the fixed component that is ∼5-10-fold above the KD is optimal when good precision for both affinity and stoichiometry is desired.
A limitation of the approach is that, like any titration method, the accuracy of the titration end-point from which the stoichiometry of the complex is inferred depends on the accuracy with which the concentrations of the interacting reagents are known. For good quality protein preparations we have found that determining protein concentrations by absorbance at 280 nm, using extinction coefficients calculated from the amino acid sequence, are typically accurate enough to give unambiguous results. However, it is the concentration of active protein that must be known, not the concentration of total protein, so if significant amounts of inactive protein are present in the preparation this must be corrected for. For interactions of reasonably high affinity, such as most antibody-antigen interactions, we have found the immuno-depletion approach we describe to be a good method for testing whether significant amounts of inactive protein are present in a preparation, and if so for establishing the necessary correction factor to ensure that the Biacore analysis returns accurate results. We have also established that small errors in the concentration of the protein reagents, such as might result from ordinary experimental uncertainty, cause only correspondingly small errors in the affinity values and stoichiometric ratios that are obtained from the Biacore experiments. For application of the method to proteins that contain two or more ligand binding sites it is also important to use a sensorchip that can bind only free analyte and not complexes that contain both free and bound sites. As we show, this problem is easily identified due to the characteristic shapes of the titrations curves that result, and if detected can often be avoided by changing the experimental design to use a sensorchip that detects the other binding partner in the interaction.
Summary
We describe a generally applicable Biacore-based method for determining the equilibrium binding affinity and stoichiometry for interactions between unmodified proteins and their ligands in free solution. The method involves incubating the protein and ligand together in solution to equilibrium, and then analyzing the reaction mixtures by Biacore to determine the distribution of free and bound states. The Biacore measurements use a sensorchip that is derivatized either with one of the binding partners, or with a competitive ligand to one of the binding partners, such that only free analyte is detected. Performing the Biacore analysis under mass-transport limited conditions allows the initial velocity of binding to the sensorchip surface to be used as a measure of free analyte concentration. Successful application of this method is requires that the ligand derivitized surface is capable of detecting only free analyte, and that the protein concentrations are known with reasonable accuracy. The method can measure binding affinities and stoichiometries over an affinity range of 10−6-10−10 M, and is particularly useful in cases where there is concern that covalently modifying one or other binding partner, might affect its binding properties, and also in situations where the analyte can potentially bind multivalently.
Supplementary Material
Supplementary Figure S1. Effect of ligand valency and surface density on Kobs. (A) Increased ligand valency decreases observed dissociation rate. Sensorgrams, normalized to percent binding response, for 20 nM each of monovalent Fab fragment (green), bivalent mAb (blue) or trivalent THD-Fab (red) forms of an anti Her2 antibody (distinct from the 65C10 based antibodies shown elsewhere in this paper) binding to Her2-fc immobilized at 600 RU. (B) Increased receptor density decreases observed dissociation rate. Sensorgrams, normalized to percent binding response, for 20 nM of the mAb shown in (A) binding to Her2-Fc immobilized at 2000 (magenta), 4000 (dark blue), or 8000 (dark red) RU.
Supplementary Figure S2. Determination of molecular weights by size exclusion chromatography with in-line static light scattering. Homogeneity plots of regions of the main peak integrated for molecular weight determination by SEC/LS. Normalized traces shown are refractive index (blue) and 90° light scatter (green) and calculated molecular weight (red). (A) 10 M Her2 (B) 4 M 65C10 Fab (C) 2 M 65C10 mAb (D) 15 M 65C10-THD (E) 10 M Her2 + 4 M 65C10 Fab (F) 10 M Her2 + 2 M 65C10 mAb (G) 10 M Her2 + 1 M 65C10-THD
Supplementary Figure S3. Simulating the effect of multiple species binding to the sensorchip on the curve shape of the initial rates data. (A) Simulated binding isotherms using conditions similar to those shown in figure 7C, however this time holding concentration of receptor constant at 1 molar unit and varying [L] as indicated. As expected, when [L] is low relative to fixed [R] very little R remains free and SPR signal is low. As [L] increases the expected quadratic binding isotherm is observed when only free L can bind to the chip (green line). As partially occupied species that are able to bind to the chip accumulate the SPR signal approaches and eventually crosses the ligand standard curve (blue line) as L + LR (red line) or L + LR + LR2 (orange line) bind. (B, C) Simulated binding isotherms using conditions similar to those shown in figure 7C and S3A, except allowing complexes LR and LR2 to gen e rate an SPR signal similar in magnitude to free L alone. (D) Binding isotherm observed for various concentrations of the same homotrimeric TNF family ligand shown in Figure 7D binding to its cognate receptor derivatized chip, either alone (open circles) or pre-incubated to equilibrium with 6 nM anti-Ligand monoclonal antibody.
Footnotes
Abbreviations used:
ELISA – Enzyme linked immunosobant assay
GF/LS – Gel filtration with in-line light scattering
ITC – Isothermal titration calorimetry
KD(app) – Apparent equilibrium dissociation constant
LR, LR2, LR3 – Ligand in complex with one, two or three receptor molecules respectively
rsHer2 – recombinant, soluble Her2 extracellular domain
RTK – Receptor tyrosine kinase
RU – resonance unit
SPR – Surface Plasmon resonance
THD – TNF homology domain
TNF – Tumor necrosis factor
Publisher's Disclaimer: This is a PDF file of an unedited manuscript that has been accepted for publication. As a service to our customers we are providing this early version of the manuscript. The manuscript will undergo copyediting, typesetting, and review of the resulting proof before it is published in its final form. Please note that during the production process errors may be discovered which could affect the content, and all legal disclaimers that apply to the journal pertain.
References
- 1.Scott DJ, Schuck P. A brief introduction to the analytical ultracentrifugation of proteins for beginners. In: Scott D, Harding SE, Rowe A, editors. Analytical Ultracentrifugation: Techniques and methods. RSC Publishing; London: 2005. pp. 1–25. [Google Scholar]
- 2.Laue TM, Stafford WF., III Modern applications of analytical ultracentrifugation. Annu Rev Biophys Biomol Struct. 1999;28:75–100. doi: 10.1146/annurev.biophys.28.1.75. [DOI] [PubMed] [Google Scholar]
- 3.Some D, Kenrick S. Characterization of protein-protein interactions via static and dynamic light scattering. In: Cai J, editor. Protein Interactions. InTech, Rijeka, Croatia: 2012. pp. 401–426. [Google Scholar]
- 4.Sharma P, Rajalingam D, Kumar TKS, Singh S. A light scattering study of the interaction of fibroblast growth factor (FGF) with its receptor. Biophys J Biophysical Letters. 2008:L71–L75. doi: 10.1529/biophysj.108.129569. [DOI] [PMC free article] [PubMed] [Google Scholar]
- 5.Cole JL, Lary JW, Moody T, Laue TM. Analytical Ultracentrifugation: Sedimentation Velocity and Sedimentation Equilibrium. Methods Cell Biol. 2008;84:143–179. doi: 10.1016/S0091-679X(07)84006-4. [DOI] [PMC free article] [PubMed] [Google Scholar]
- 6.Whitty A, Raskin N, Olson DL, Borysenko CW, Ambrose CM, Benjamin CD, Burkly LC. Interaction affinity between cytokine receptor components on the cell surface. Proc Natl Acad Sci USA. 1998;95:13165–13170. doi: 10.1073/pnas.95.22.13165. [DOI] [PMC free article] [PubMed] [Google Scholar]
- 7.DiBiasi A, O'Reilly K, Motulsky HJ. Calculating receptor number from binding experiments using same compound as radioligand and competitor. TiPS. 1989;10:227–229. doi: 10.1016/0165-6147(89)90266-6. [DOI] [PubMed] [Google Scholar]
- 8.Karlsson R, Michaelsson A, Mattsson L. Kinetic analysis of monoclonal antibody-antigen interactions with a new biosensor based analytical system. J Immunol Methods. 1991;145:229–240. doi: 10.1016/0022-1759(91)90331-9. [DOI] [PubMed] [Google Scholar]
- 9.Mistrík P, Moreau F, Allen JM. BiaCore analysis of leptin–leptin receptor interaction: evidence for 1:1 stoichiometry. Anal Biochem. 2004;327:271–277. doi: 10.1016/j.ab.2004.01.022. [DOI] [PubMed] [Google Scholar]
- 10.Underwood PA. Problems and pitfalls with measurement of antibody affinity using solid phase binding in the ELISA. J Immunol Methods. 1993;164:119–130. doi: 10.1016/0022-1759(93)90282-c. [DOI] [PubMed] [Google Scholar]
- 11.Reynolds JA. Interaction of divalent antibody with cell surface antigens. Biochemistry. 1979;18:264–269. doi: 10.1021/bi00569a004. [DOI] [PubMed] [Google Scholar]
- 12.Day YSN, Baird CL, Rich RL, Myszka DG. Direct comparison of binding equilibrium, thermodynamic, and rate constants determined by surface- and solution-based biophysical methods. Protein Science. 2002;11:1017–1025. doi: 10.1110/ps.4330102. [DOI] [PMC free article] [PubMed] [Google Scholar]
- 13.Matsumoto-Takasaki A, Hanashima S, Aoki A, Yuasa N, Ogawa H, Sato R, Kawakami H, Mizuno M, Nakada H, Yamaguchi Y, Fujita-Yamaguchi Y. Surface plasmon resonance and NMR analyses of anti Tn-antigen MLS128 monoclonal antibody binding to two or three consecutive Tn-antigen clusters. Journal of Biochemistry. 2011;151:273–282. doi: 10.1093/jb/mvr138. [DOI] [PubMed] [Google Scholar]
- 14.Drake A, Myszka DG, Klakamp SL. Characterizing high-affinity antigen/antibody complexes by kinetic- and equilibrium-based methods. Anal Biochem. 2004;328:35–43. doi: 10.1016/j.ab.2003.12.025. [DOI] [PubMed] [Google Scholar]
- 15.van der Merwe PA, Barclay AN. Analysis of cell-adhesion molecule interactions using surface plasmon resonance. Curr Opinion Immunol. 1996;8:257–61. doi: 10.1016/s0952-7915(96)80065-3. [DOI] [PubMed] [Google Scholar]
- 16.Myszka DG. Improving biosensor analysis. J Mol Recognit. 1996;12:279–284. doi: 10.1002/(SICI)1099-1352(199909/10)12:5<279::AID-JMR473>3.0.CO;2-3. [DOI] [PubMed] [Google Scholar]
- 17.Myszka DG. Kinetic analysis of macromolecular interactions using surface plasmon resonance biosensors. Curr Opin Biotech. 1997;8:50–57. doi: 10.1016/s0958-1669(97)80157-7. [DOI] [PubMed] [Google Scholar]
- 18.Day ES, Cachero TG, Qian F, Sun Y, Wen D, Pelletier M, Hsu YM, Whitty A. Selectivity of BAFF/BLyS and APRIL for Binding to the TNF Family Receptors BAFFR/BR3 and BCMA. Biochemistry. 2005;44:1919–1931. doi: 10.1021/bi048227k. [DOI] [PubMed] [Google Scholar]
- 19.Whitty A. Cooperativity and biological complexity. Nat Chem Biol. 2008;4(8):435–439. doi: 10.1038/nchembio0808-435. [DOI] [PubMed] [Google Scholar]
- 20.Mattes MJ. Binding parameters of antibodies: pseudo-affinity and other misconceptions. Cancer Immunology, Immunotherapy. 2004;54:513–516. doi: 10.1007/s00262-004-0644-3. [DOI] [PMC free article] [PubMed] [Google Scholar]
- 21.Mason DW, Williams AF. The Kinetics of Antibody Binding to Membrane Antigens in Solution and at the Cell Surface. Biochem J. 1980;187:1–20. doi: 10.1042/bj1870001. [DOI] [PMC free article] [PubMed] [Google Scholar]
- 22.Butler JE. Solid Supports in Enzyme-Linked Immunosorbent Assay and Other Solid-Phase Immunoassays. Methods. 2000;22:4–23. doi: 10.1006/meth.2000.1031. [DOI] [PubMed] [Google Scholar]
- 23.Erickson J, Goldstein B, Holowka D, Baird B. The Effect of Receptor Density on the Forward Rate Constant for Binding of Ligands to Cell Surface Receptors. Biophysical Journal. 1987;52:657–662. doi: 10.1016/S0006-3495(87)83258-7. [DOI] [PMC free article] [PubMed] [Google Scholar]
- 24.Sjolander S, Urbaniczky C. Integrated Fluid Handling System for Biomolecular Interaction Analysis. Anal Chem. 1991;63:2338–2345. doi: 10.1021/ac00020a025. [DOI] [PubMed] [Google Scholar]
- 25.Glaser R. Antigen – Antibody Binding and Mass Transport by Convection and Diffusion to a Surface: A Two-Dimensional Computer Model of Binding and Dissociation Kinetics. Anal Biochem. 1993;213:152–161. doi: 10.1006/abio.1993.1399. [DOI] [PubMed] [Google Scholar]
- 26.Karlsson R. Real-Time Competitive Kinetic Analysis of Interactions Between Low-Molecular-Weight Ligands in Solution and Surface Immobilized Receptors. Anal Biochem. 1994;221:142–151. doi: 10.1006/abio.1994.1390. [DOI] [PubMed] [Google Scholar]
- 27.Christensen LLH. Theoretical Analysis of Protein Concentration Determination Using Biosensor Technology under Conditions of Partial Mass Transport Limitation. Anal Biochem. 1997;249:153–164. doi: 10.1006/abio.1997.2182. [DOI] [PubMed] [Google Scholar]
- 28.Reeves PL, Callewaert N, Contreras R, Khorana HG. Structure and function in rhodopsin: high-level expression of rhodopsin with restricted and homogeneous N-glycosylation by a tetracycline-inducible N-acetylglucosaminyltransferase I-negative HEK293S stable mammalian cell line. Proc Natl Acad Sci U S A. 2002;99(21):13419–13424. doi: 10.1073/pnas.212519299. [DOI] [PMC free article] [PubMed] [Google Scholar]
- 29.Fägerstam LG, Frostell-Karlsson Å, Karlsson R, Persson B, Rijnnberg I. Biospecific interaction analysis using surface Plasmon resonance detection applied to kinetic, binding site and concentration analysis. J Chrom. 1992;597:397–410. doi: 10.1016/0021-9673(92)80137-j. [DOI] [PubMed] [Google Scholar]
- 30.Karlsson R, Fägerstam LG, Nilshans H, Persson B. Analysis of active antibody concentration. Separation of affinity and concentration parameters. J Immunol Methods. 1993;166:75–84. doi: 10.1016/0022-1759(93)90330-a. [DOI] [PubMed] [Google Scholar]
- 31.van der Merwe PA, Barclay AN. Analysis of cell-adhesion molecule interactions using surface plasmon resonance. Curr Opin Immunol. 1996;8:257–261. doi: 10.1016/s0952-7915(96)80065-3. [DOI] [PubMed] [Google Scholar]
- 32.Mattes MJ. Binding parameters of antibodies reacting with multivalent antigens: functional affinity or pseudo-affinity. J Immunol Methods. 1997;202:97–101. doi: 10.1016/s0022-1759(96)00228-1. [DOI] [PubMed] [Google Scholar]
- 33.Hulme EC, Birdsall NJM. Strategy and tactics in receptor binding studies. In: Hulme EC, editor. Receptor–Ligand Interactions – A Practical Approach. IRL Press; Oxford: 1992. pp. 63–176. [Google Scholar]
- 34.Hulme EC, Trevethick MA. Ligand binding assays at equilibrium: validation and interpretation. Brit J Pharmacol. 2010;161:1219–1237. doi: 10.1111/j.1476-5381.2009.00604.x. [DOI] [PMC free article] [PubMed] [Google Scholar]
- 35.Pace CN, Vajdos F, Fee L, Grimsley G, Gray T. How to measure and predict the molar absorption coefficient of a protein. Protein Science. 1995;4:2441–2423. doi: 10.1002/pro.5560041120. [DOI] [PMC free article] [PubMed] [Google Scholar]
- 36.Szabo A, Stolz L, Granzow R. Surface plasmon resonance and its use in biomolecular interaction analysis (BIA) Curr Opin Struct Biol. 1995;5:699–705. doi: 10.1016/0959-440x(95)80064-6. [DOI] [PubMed] [Google Scholar]
- 37.Fivash M, Towlert EM, Fisher RJ. BIAcore for macromolecular interaction. Curr Opin Biotech. 1998;9:97–101. doi: 10.1016/s0958-1669(98)80091-8. [DOI] [PubMed] [Google Scholar]
- 38.Rich RL, Myszka DG. Advances in surface plasmon resonance biosensor analysis. Curr Opin Biotech. 2000;11:54–61. doi: 10.1016/s0958-1669(99)00054-3. [DOI] [PubMed] [Google Scholar]
- 39.Schuck P, Zhao H. The role of mass transport limitation and surface heterogeneity in the biophysical characterization of macromolecular binding processes by SPR biosensing. Methods Mol Biol. 2010;627:15–54. doi: 10.1007/978-1-60761-670-2_2. [DOI] [PMC free article] [PubMed] [Google Scholar]
- 40.O'Shannessy DJ, Winzor DJ. Interpretation of Deviations from Pseudo-First-Order Kinetic Behavior in the Characterization of Ligand Binding by Biosensor Technology. Anal Biochem. 1996;236:275–283. doi: 10.1006/abio.1996.0167. [DOI] [PubMed] [Google Scholar]
- 41.Edwards PR, Lowe1 PA, Leatherbarrow RJ. Ligand Loading at the Surface of an Optical Biosensor and its Effect upon the Kinetics of Protein–Protein Interactions. J Mol Rec. 1997;10:128–134. doi: 10.1002/(SICI)1099-1352(199705/06)10:3<128::AID-JMR357>3.0.CO;2-Y. [DOI] [PubMed] [Google Scholar]
- 42.Edwards PR, Gill A, Pollard-Knight DV, Hoare M, Buckle PE, Lowe PA, Leatherbarrow RJ. Kinetics of protein-protein interactions at the surface of an optical biosensor. Anal Biochem. 1995;231(1):210–217. doi: 10.1006/abio.1995.1522. [DOI] [PubMed] [Google Scholar]
- 43.Kortt AA, Nice E, Gruen LC. Analysis of the binding of the Fab fragment of monoclonal antibody NC10 to influenza virus N9 neuraminidase from tern and whale using the BIAcore biosensor: effect of immobilization level and flow rate on kinetic analysis. Anal Biochem. 1999;273(1):133–141. doi: 10.1006/abio.1999.4183. [DOI] [PubMed] [Google Scholar]
- 44.Kalinin NL, Ward LD, Winzor DJ. Effects of solute multivalence on the evaluation of binding constants by biosensor technology: studies with concanavalin A and interleukin-6 as partitioning proteins. Anal Biochem. 1995;228(2):238–44. doi: 10.1006/abio.1995.1345. [DOI] [PubMed] [Google Scholar]
- 45.Ong GL, Mattes MJ. Re-evaluation of the concept of functional affinity as applied to bivalent antibody binding to cell surface antigens. Mol Immunol. 1993;30(16):1455–1462. doi: 10.1016/0161-5890(93)90107-m. [DOI] [PubMed] [Google Scholar]
- 46.Friguet B, Chaffotte AF, Djavadi-Ohaniance L, Goldberg ME. Measurements of the true affinity constant in solution of antigen-antibody complexes by enzyme-linked immunosorbent assay. J Immunol Methods. 1985;77(2):305–319. doi: 10.1016/0022-1759(85)90044-4. [DOI] [PubMed] [Google Scholar]
- 47.Blake RC, II, Pavlov AR, Blake DA. Automated Kinetic Exclusion Assays to Quantify Protein Binding Interactions in Homogeneous Solution. Anal Biochem. 1999;272:123–134. doi: 10.1006/abio.1999.4176. [DOI] [PubMed] [Google Scholar]
- 48.Silvian LF, Friedman JE, Strauch K, Cachero TG, Day ES, Qian F, Cunningham B, Fung A, Sun L, Shipps GW, Su L, Zheng Z, Kumaravel G, Whitty A. Small molecule inhibition of the TNF family cytokine CD40 ligand through a subunit fracture mechanism. ACS Chem Biol. 2011;6(6):636–647. doi: 10.1021/cb2000346. [DOI] [PMC free article] [PubMed] [Google Scholar]
- 49.Cochran S, Li C, Fairweather JK, Kett WC, Coombe DR, Ferro V. Probing the Interactions of Phosphosulfomannans with Angiogenic Growth Factors by Surface Plasmon Resonance. J Med Chem. 2003;46:4601–4608. doi: 10.1021/jm030180y. [DOI] [PubMed] [Google Scholar]
- 50.Cochran S, Li C, Ferro V. A surface plasmon resonance-based solution affinity assay for heparansulfate-binding proteins. Glycoconj J. 2009;26:577–587. doi: 10.1007/s10719-008-9210-0. [DOI] [PubMed] [Google Scholar]
Associated Data
This section collects any data citations, data availability statements, or supplementary materials included in this article.
Supplementary Materials
Supplementary Figure S1. Effect of ligand valency and surface density on Kobs. (A) Increased ligand valency decreases observed dissociation rate. Sensorgrams, normalized to percent binding response, for 20 nM each of monovalent Fab fragment (green), bivalent mAb (blue) or trivalent THD-Fab (red) forms of an anti Her2 antibody (distinct from the 65C10 based antibodies shown elsewhere in this paper) binding to Her2-fc immobilized at 600 RU. (B) Increased receptor density decreases observed dissociation rate. Sensorgrams, normalized to percent binding response, for 20 nM of the mAb shown in (A) binding to Her2-Fc immobilized at 2000 (magenta), 4000 (dark blue), or 8000 (dark red) RU.
Supplementary Figure S2. Determination of molecular weights by size exclusion chromatography with in-line static light scattering. Homogeneity plots of regions of the main peak integrated for molecular weight determination by SEC/LS. Normalized traces shown are refractive index (blue) and 90° light scatter (green) and calculated molecular weight (red). (A) 10 M Her2 (B) 4 M 65C10 Fab (C) 2 M 65C10 mAb (D) 15 M 65C10-THD (E) 10 M Her2 + 4 M 65C10 Fab (F) 10 M Her2 + 2 M 65C10 mAb (G) 10 M Her2 + 1 M 65C10-THD
Supplementary Figure S3. Simulating the effect of multiple species binding to the sensorchip on the curve shape of the initial rates data. (A) Simulated binding isotherms using conditions similar to those shown in figure 7C, however this time holding concentration of receptor constant at 1 molar unit and varying [L] as indicated. As expected, when [L] is low relative to fixed [R] very little R remains free and SPR signal is low. As [L] increases the expected quadratic binding isotherm is observed when only free L can bind to the chip (green line). As partially occupied species that are able to bind to the chip accumulate the SPR signal approaches and eventually crosses the ligand standard curve (blue line) as L + LR (red line) or L + LR + LR2 (orange line) bind. (B, C) Simulated binding isotherms using conditions similar to those shown in figure 7C and S3A, except allowing complexes LR and LR2 to gen e rate an SPR signal similar in magnitude to free L alone. (D) Binding isotherm observed for various concentrations of the same homotrimeric TNF family ligand shown in Figure 7D binding to its cognate receptor derivatized chip, either alone (open circles) or pre-incubated to equilibrium with 6 nM anti-Ligand monoclonal antibody.