

Abstract
T cell immunoglobulin and mucin-containing molecule 3 (TIM-3), first identified as a molecule expressed on interferon-γ producing T cells1, is emerging as an important immune-checkpoint molecule, with therapeutic blockade of TIM-3 being investigated in multiple human malignancies. Expression of TIM-3 on CD8+ T cells in the tumour microenvironment is considered a cardinal sign of T cell dysfunction; however, TIM-3 is also expressed on several other types of immune cell, confounding interpretation of results following blockade using anti-TIM-3 monoclonal antibodies. Here, using conditional knockouts of TIM-3 together with single-cell RNA sequencing, we demonstrate the singular importance of TIM-3 on dendritic cells (DCs), whereby loss of TIM-3 on DCs–but not on CD4+ or CD8+ T cells–promotes strong anti-tumour immunity. Loss of TIM-3 prevented DCs from expressing a regulatory program and facilitated the maintenance of CD8+ effector and stem-like T cells. Conditional deletion of TIM-3 in DCs led to increased accumulation of reactive oxygen species resulting in NLRP3 inflammasome activation. Inhibition of inflammasome activation, or downstream effector cytokines interleukin-1β (IL-1β) and IL-18, completely abrogated the protective anti-tumour immunity observed with TIM-3 deletion in DCs. Together, our findings reveal an important role for TIM-3 in regulating DC function and underscore the potential of TIM-3 blockade in promoting anti-tumour immunity by regulating inflammasome activation.
TIM-3 has emerged as an important checkpoint molecule whose expression correlates with terminal differentiation and exhaustion in tumours1,2 and chronic viral infection3,4. A number of clinical trials are under way using blocking monoclonal antibodies directed against TIM-3, however the exact mechanisms underlying the anti-tumour activity of these antibodies are not well understood.
To address the specific function of TIM-3 in T cells, we generated conditional-knockout mice (Extended Data Fig. 1a), deleting TIM-3 in CD4+ and CD8+ T cells, CD8+ T cells or T regulatory (Treg) cells. Deletion in both CD4+ and CD8+ T cells led to a modest reduction in tumour burden using immunogenic MC38 colon carcinoma cells expressing ovalbumin (MC38-OVAdim) (Fig. 1a), whereas deletion in either CD8+ T cells (Fig. 1b) or Treg cells (Fig. 1c) had no effect. TIM-3 is also expressed on natural killer (NK) cells5; however, specific deletion using Ncr1cre had no effect on tumour growth (Fig. 1d). These observations, although unexpected, led us to consider that the role of TIM-3 in regulating anti-tumour immunity may be predominantly mediated through myeloid cells6,7 and especially DCs, in which TIM-3 is constitutively expressed at high levels8–10. Recently, the importance of TIM-3 expression on myeloid cells has become apparent from observations made in human disease, where germline mutations in HAVCR2, the gene that encodes TIM-3, are associated with hyperactivation of myeloid cells and elevated circulating levels of IL-1811. Furthermore, the therapeutic efficacy of TIM-3 blocking antibodies in acute myeloid leukaemia (AML) and myelodysplastic syndrome12–14, suggested that TIM-3 may be particularly important in regulating myeloid cell function.
Fig. 1 |. Deletion of TIM-3 on DCs leads to reduced tumour burden.

a-d, MC38-OVAdim cells were implanted subcutaneously into Havcr2fl/fl and Havcr2fl/flCd4cre (n = 4) (a), Havcr2fl/flE8icre (n = 5) (b), Havcr2fl/flFoxp3-ERT2cre (n = 5) (c) and Havcr2fl/flNcr1cre (n = 4) (d) mice and tumour growth was measured over time. e, Day 14 MC38-OVAdim tumours were explanted. CD45+ cells from tumour, draining lymph nodes (dLN) and non-draining lymph nodes (ndLN) were analysed by scRNA-seq. Top, uniform manifold approximation and projection (UMAP) clustering and Havcr2 expression (exp.) in each cluster. Middle, clustering of CD45+ cells from wild-type tumours with cell annotation and Havcr2 expression. Bottom, violin plot showing normalized expression of Havcr2 in each CD45+ tumour cluster. CMP, common myeloid progenitors; LN, lymph node; mac, macrophages; mono, monocytes; mono-mac, monocyte-derived macrophages; PMN, polymorphonuclear cells. f, g, Growth curve of MC38-OVAdim cells subcutaneously implanted into Havcr2fl/fl and Havcr2fl/flCx3cr1cre (n = 3) (f) and Havcr2fl/flCd11ccre (n = 13) (g) mice. h, KP1.9 cells were injected intravenously into Havcr2fl/fl and Havcr2fl/fl Cd11ccre mice (n = 5). Tumour burden was assessed by histological analyses of explanted lung tissue collected 4 weeks after implantation. i, Wild-type mice were subcutaneously implanted with B16-OVA cells (n = 4). In vitro-derived DC1 cells were generated from Havcr2fl/fl and Havcr2fl/flCd11ccre mice, cultured with soluble OVA and injected subcutaneously after three days of culture. PBS was injected into non-transfer controls. j, k, Tumour growth in Havcr2fl/fl and Havcr2fl/flZbtb46cre mice subcutaneously implanted with MC38-OVAdim (n = 4) (j) or MC38 (n = 5) (k) cells. l, Growth curve of MC38-OVAdim cells subcutaneously implanted in Havcr2fl/fl, Havcr2fl/flCd4cre (n = 4) and Havcr2fl/flCd11ccre (n = 8) mice. Results are shown from one experiment, representative of at least three independent experiments. Data are mean ± s.e.m. *P < 0.05, **P < 0.01, ***P < 0.001 and ****P < 0.0001; two-way ANOVA.
To fully probe the expression profile of TIM-3 we performed single-cell RNA sequencing analysis (scRNA-seq) of tumour-infiltrating CD45+ cells (tumour-infiltrating lymphocytes (TILs)), with CD45+ cells from the draining and non-draining lymph nodes of wild-type mice bearing MC38-OVAdim tumours. In lymphoid tissues, Havcr2 expression was most prominent in a cluster of cells expressing canonical DC1 markers including Xcr1 and Clec9a (Extended Data Fig. 1b). However, in tumours, Havcr2 was expressed in multiple cell types including DCs (clusters 1, 5 and 12), CD8+ T cells (cluster 7), Treg cells (cluster 8), monocytes (cluster 3) and macrophages (cluster 0) (Fig. 1e). Flow cytometry analysis of CD45+ leukocytes from MC38-OVAdim verified these expression patterns, with TIM-3 being most highly expressed on DC1s and migratory DCs (migDCs) (Extended Data Fig. 1c, d), a DC population that shares properties of both DC1s and DC2s and has been proposed in several studies to be important in mediating robust anti-tumour immune responses15,16. We also identified abundant expression of TIM-3 on intratumoural macrophages and monocytes. These data, together with clinical observations made regarding the role of TIM-3 in human disease11,17, prompted us to systematically Investigate the effect of deletion of TIM-3 in myeloid cells on tumour burden. Despite efficient deletion of TIM-3 in monocytes, macrophages and DC2s (Extended Data Fig. 1e, f), we did not observe any effect on tumour growth using Lysmcre (Lysm is also known as Lyz2) or Cx3cr1cre mice (Fig. 1f, Extended Data Fig. 2a), excluding a role for TIM-3 on macrophages, monocytes and DC2s In these models. By contrast, using Cd11ccre (Cd11c Is also known as Itgax) to delete TIM-3 In DCs (TIM-3 conditional knockout (Havcr2cko)), we observed significantly reduced tumour growth (Fig. 1g, Extended Data Fig. 2b). We further Investigated the effect of TIM-3 deletion on DCs In a model of non-small-cell lung carcinoma, using KP1.9 lung adenocarcinoma cells18 and found that Havcr2cko mice had significantly reduced tumour burden (Fig. 1h). We additionally performed DC-transfer experiments (Fig. 1i) demonstrating that intrinsic loss of TIM-3 on DCs Is sufficient to drive anti-tumour Immunity, with increased frequency of functional antigen-specific effector CD8+ T cells (Extended Data Fig. 2c–h). Although we had not observed deletion of TIM-3 on non-myeloid cells using Cd11ccre, we additionally confirmed our results using a Zbtb46cre mouse line that specifically targets conventional DCs (cDCs) (Fig. 1j). Using less immunogenic MC38 tumour (Fig. 1k, Extended Data Fig. 2i,j) and B16F10 melanoma (Extended Data Fig. 2k) cells, we again found that loss of TIM-3 on DCs led to significant inhibition of tumour growth. Finally, we compared deletion of TIM-3 on DCs and T cells In parallel, and found that deletion of TIM-3 In DC populations led to superior Inhibition of tumour growth (Fig. 1l; Extended Data Fig. 2l–o).
There were no substantial differences in tumour immune infiltrates between Havcr2fl/fl and Havcr2cko mice (Extended Data Fig. 3a–k), except for a significant increase In CD8+ T cells in Havcr2cko mice (Extended Data Fig. 3l). We assessed the expression of cytokine, chemokine, co-inhibitory and co-stimulatory molecules on intratumoural DC1s and migDCs (Extended Data Fig. 3m) but found no substantial changes. Together, these results indicated that TIM-3 has a dominant role In regulating DC function to promote anti-tumour Immunity, prompting us to comprehensively Investigate differences between tumours in Havcr2fl/fl and Havcr2cko mice.
TIM-3-deficient DCs expand stem-like CD8+ T cells
Using scRNA-seq, we profiled TILs from Havcr2fl/fl and Havcr2cko mice bearing MC38-OVAdim tumours, identifying 15 distinct cell types, Including four lymphoid clusters, a NK cell cluster, seven distinct myeloid clusters and three cDC clusters (Extended Data Fig. 4a–c). All clusters were represented In samples from both Havcr2fl/fl and Havcr2cko mice (Extended Data Fig. 4d), but in different proportions. In particular cluster 0 (containing monocyte-derived macrophages; P = 4.74 × 10⁻⁵), clusters 10 and 12 (containing activated B cells; P = 1.16 × 10⁻² and P = 4.16 × 10⁻³, respectively), and cluster 7 (containing CD8+ T cells; P = 1.3 × 10⁻⁴), were more highly represented in tumours from Havcr2cko mice (Fig. 2a, Extended Data Fig. 4e).
Fig. 2 |. Expansion of stem-like memory-precursor CD8+ T cells in Havcr2cko tumours.
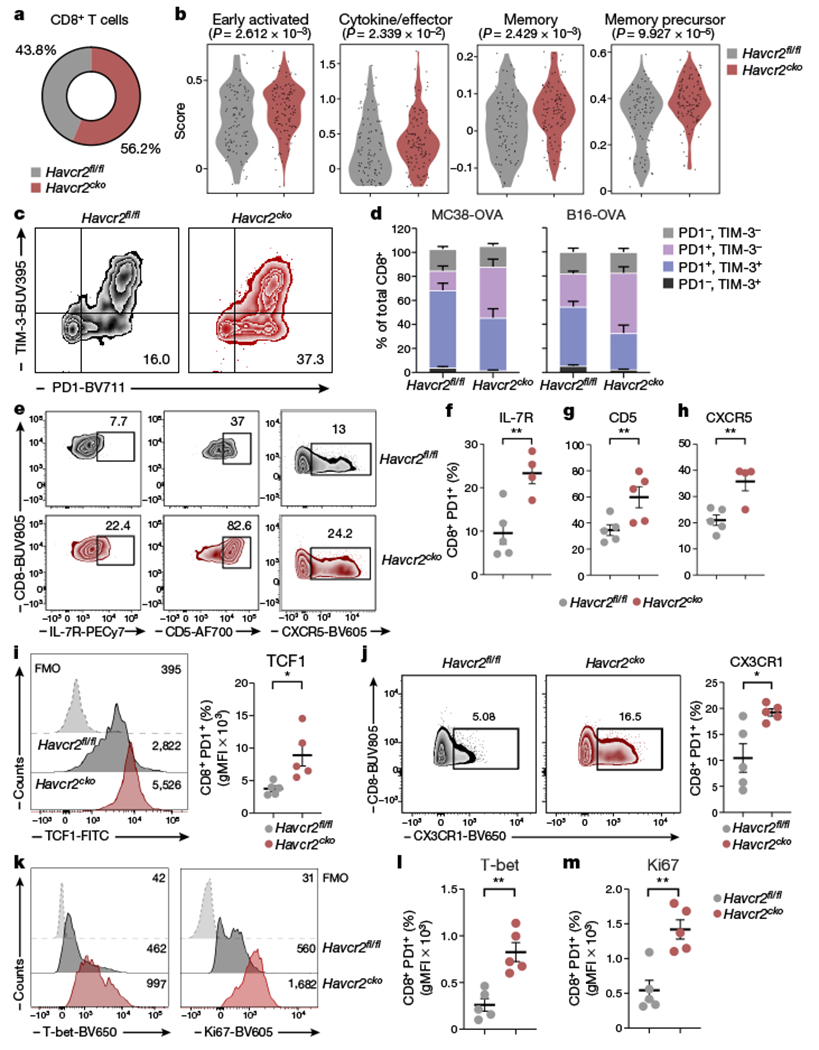
MC38-OVAdim cells were implanted subcutaneously into Havcr2fl/fl and Havcr2fl/fl Cd11ccre (Havcr2cko) mice and explanted on day 14. CD45+ cells were Isolated from tumour for analysis by scRNA-seq. a, Proportions of CD8+ T cells in scRNA-seq data. b, Transcripts from CD8+ T cells in tumours from Havcr2fl/fl and Havcr2cko mice were assessed for enrichment of signatures of early-activated, effector, memory and memory-precursor T cells. c, d, Flow cytometry analysis of TIM-3 and PD1 expression on CD8+ TILs from MC38-OVAdim (n = 10) and B16-OVA tumours (n = 4 or 5) on day 14 after implantation (c) and quantification of CD8+ cells expressing TIM-3 and PD1 (d). e-h, Flow cytometry analysis of IL-7R, CD5 and CXCR5 expression in CD8+PD1+ TILs (e) and proportions of cells expressing IL-7R (f), CD5 (g) and CXCR5 (h). i, TCF1 expression among CD8+PD1+ TILs. FMO, fluorescence minus one; gMFI, geometric mean fluorescence intensity. j, Representative CX3CR1 expression among CD8+PD1+ TILs. k, Representative histograms (k) showing expression of T-bet (summarized in l) and Ki67 (summarized in m) among CD8+PD1+ TILs. Results shown are from one experiment, representative of at least three independent experiments. n = 4 or 5. Student’s two-tailed t-test.
Analysing CD8+ T cells (cluster 7), we observed that cells from tumours in Havcr2cko mice expressed higher levels of gene signatures found in a spectrum of functional states, including early activated19 (P = 2.6 × 10⁻³), effector20 (P = 2.3 × 10⁻²), memory20 (P = 2.4 × 10−03) and memory precursor21 (P = 9.9 × 10⁻⁵) (Fig. 2b). Memory precursor cells are ‘stem-like’ CD8+ T cells that have been identified in several human cancers19,22,23 and have been shown to be essential for providing a proliferative burst that supplies the effector T cell pool in response to checkpoint immunotherapy21,24,25. We hypothesized that the loss of TIM-3 on DCs could contribute to induction or maintenance of stem-like CD8+ T cells. Supporting our hypothesis, we observed a significant increase in the frequency and absolute number of PD-1 single-positive TILs in tumours from Havcr2cko mice (Fig. 2c, d, Extended Data Fig. 5a, b). PD1+ TILs have been shown to contain both stem-like and effector-like CD8+ TILs21; we therefore assessed the expression of cell surface markers that distinguish these two populations21,26–28. We found increased expression of IL-7R, CD5 and CXCR5 on PD-1+ CD8+ T cells infiltrating tumours in Havcr2cko mice (Fig 2e–h), indicating increased numbers of stem-like CD8+ TILs. In line with these results, we observed a significant expansion of CXCR5+TIM-3−CD8+ T cells in tumours from Havcr2cko mice (Extended Data Fig. 5c), together with TCF1 (Fig 2i) which is a hallmark of memory precursor T cells.
We further found increased expression of CX3CR1, T-bet and Ki67 (Fig. 2j–m, Extended Data Fig. 5d), indicating an increase in the number of cells entering the effector lineage. These results indicate that loss of TIM-3 expression on DCs promotes the maintenance of stem-like CD8+ T cells and effector T cells, which together promote protective immune responses in tumours from Havcr2cko mice.
TIM-3 deficiency boosts antigen-specific immunity
Subclustering only the myeloid cells from our single-cell dataset, we identified ten transcriptionally distinct subsets (Fig. 3a, Extended Data Fig. 6a–c), which were represented in tumours from both Havcr2fl/fl and Havcr2cko mice, but in different proportions. In particular, cluster 0 (CCR5-expressing monocyte-derived macrophages), was enriched in tumours from Havcr2cko mice, consistent with increased levels of RANTES in these tumours (data not shown). Conversely, there was a smaller proportion of Havcr2cko cells in cluster 9 (neutrophils), cluster 6 (DC1s) and cluster 8 (migDCs,) (Fig. 3b, Extended Data Fig. 6d, e).
Fig. 3 |. TIM-3 deficiency promotes DC functionality and enhances antigen-specific anti-tumour immunity.
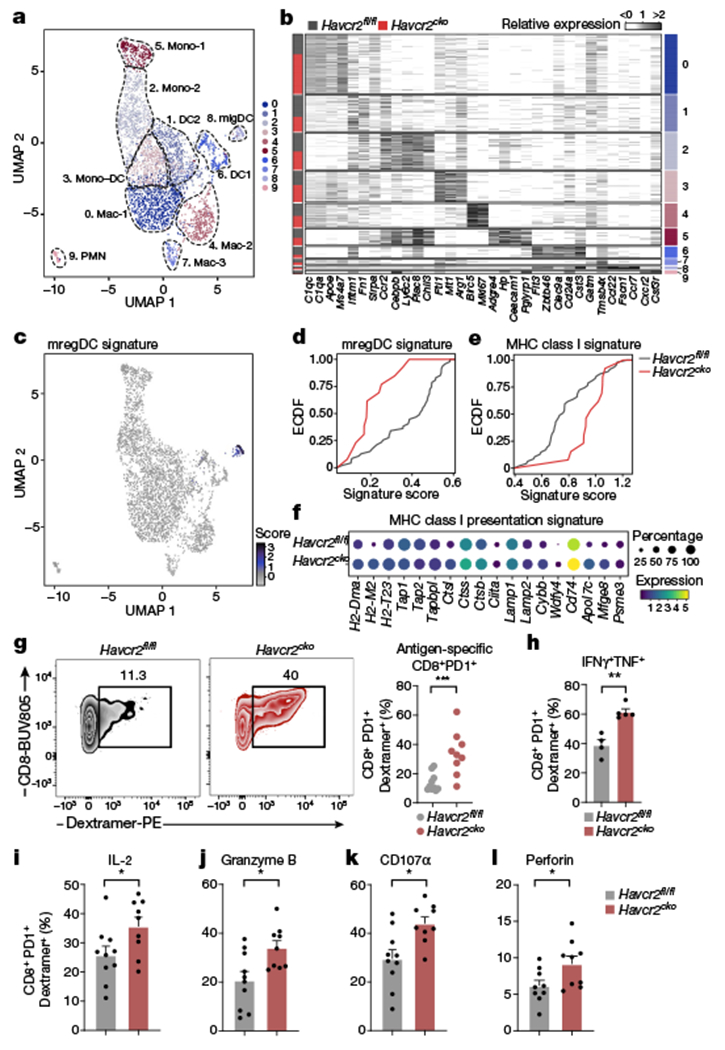
a, Annotated UMAP plot showing scRNA-seq analysis of myeloid cells from tumours in Havcr2fl/fl and Havcr2fl/fl Cd11ccre (Havcr2cko) mice. b, Heat map showing expression of selected genes, cluster as identified in a is indicated on the right, the bar on the left indicates Havcr2fl/fl (grey) or Havcr2cko (red). c, UMAP showing enrichment of mreg DC signature in cluster 8 (migDCs). d, Empirical cumulative distribution function (ECDF) plot of enrichment score for mregDC signature in Havcr2fl/fl (grey) or Havcr2cko (red) migDCs, (P = 9.4 × 10⁻⁴). e, ECDF plot of MHC class I presentation signature (P = 1.01 × 10⁻³). f, Dot plot of selected genes from MHC class I presentation signature. g, Frequency of OVA-specific CD8+ T cells from tumours in Havcr2fl/fl and Havcr2cko mice at day 14. h-l, MC38-OVAdim cells were implanted subcutaneously into Havcr2fl/fl and Havcr2cko mice. Tumours were collected on day 14 and CD8+ TILs were analysed by flow cytometry for expression of IFN-γ and TNF (h), IL-2 (i), granzyme B (j), CD107α (k) and perforin (l). Results shown are representative of at least three independent experiments; n = 4 (h), n = 9 per group (other panels). Student’s two-tailed t-test.
The migDC population has been shown to acquire a regulatory program in the tumour microenvironment (resulting in mature DCs enriched in immunoregulatory molecules (mregDCs)), restraining the immunogenic potential of these cells16. Scoring this signature on our myeloid cells indeed highlighted cluster 8, migDCs (Fig. 3c) with a lower enrichment score in Havcr2cko mice (Fig. 3d; P = 9.4 × 10−04), concomitant with reduced expression of immunoregulatory molecules enriched in mregDCs16 including IL-4R, CD200, CD83 and OX-40 (Extended Data Fig. 7a). As a key cytokine driving the mregDC program, we investigated the effect of IL-4 blockade in Havcr2cko tumour-bearing mice (Extended Data Fig. 7b). Treatment with anti-IL-4 led to a profound delay in tumour growth in Havcr2fl/fl mice but had no effect in Havcr2cko mice. This suggests that deficiency of TIM-3 might curtail acquisition of the mregDC program, enabling migDCs to attain a full immunogenic program.
In the context of tumour, a critical function of DCs15,29,30, is to promote and educate antigen-specific CD8+ T cells for durable anti-tumour immunity. Scoring the myeloid clusters for a major histocompatibility complex (MHC) class I presentation signature, we found significant enrichment in Havcr2cko cluster 8 migDCs (Fig. 3e; P = 1.01 × 10⁻³), in which several genes related to MHC class I antigen presentation, including Wdfy4, Cybb, Tapbpl and H2-M2 were upregulated (Fig. 3f). To investigate the role of TIM-3 in cross-presentation we performed in vitro assays using particulate antigen. OT-I T cells cultured with dead-cell-associated or bead-coupled OVA had a higher rate of proliferation and activation (CD44+CTVlo) when cultured with Havcr2cko DC1s (Extended Data Fig. 7c). In line with this result, we found an increased frequency of antigen-specific CD8+ T cells in tumours in Havcr2cko mice (Fig. 3g), producing increased levels of effector cytokines interferon-γ (IFN-γ), TNF and IL-2 (Fig. 3h, i) with greater cytotoxic potential, assessed by increased expression of granzyme B, CD107α and perforin (Fig. 3j–l). This resulted in increased lytic activity of CD8+ T cells in vivo (Extended Data Fig. 7d).
Loss of TIM-3 increases inflammasome activation
To identify potential cell-cell interactions between CD8+ T cells (expanded and activated in Havcr2cko mice) and migDCs (with enhanced antigen-presentation) in Havcr2cko tumours, we used a method recently developed31 as part of the Waddington OT package. Although multiple ligand-receptor gene pairs scored similarly between tumours in Havcr2fl/fl and Havcr2cko mice, (for example, Il12b-Il12rb2), several putative ligand-receptor gene pairs had a higher interaction score in tumours from Havcr2cko mice, notably Il18-Il18r1 and Il18-Il18rap (Fig. 4a). In line with this finding, expression of Il18rap was significantly higher in CD8+ T cells from tumours in Havcr2cko mice (Extended Data Fig. 7e, f). Although Il1r1 transcript was undetectable in our dataset, we scored CD8+ T cells from tumours in Havcr2fl/fl and Havcr2cko mice for enrichment of Il18 and Il1 gene signatures, finding that both were enriched in CD8+ T cells from tumours in Havcr2cko mice (Fig. 4b, c; P = 2.8 × 10⁻⁴ and 7.02 × 10⁻⁴, respectively). Cytokine analysis of homogenates of tumours from Havcr2fl/fl and Havcr2cko mice also showed higher levels of IL-1β and IL-18 (Extended Data Fig. 7g).
Fig. 4 |. Loss of TIM-3 on DCs promotes inflammasome activation.

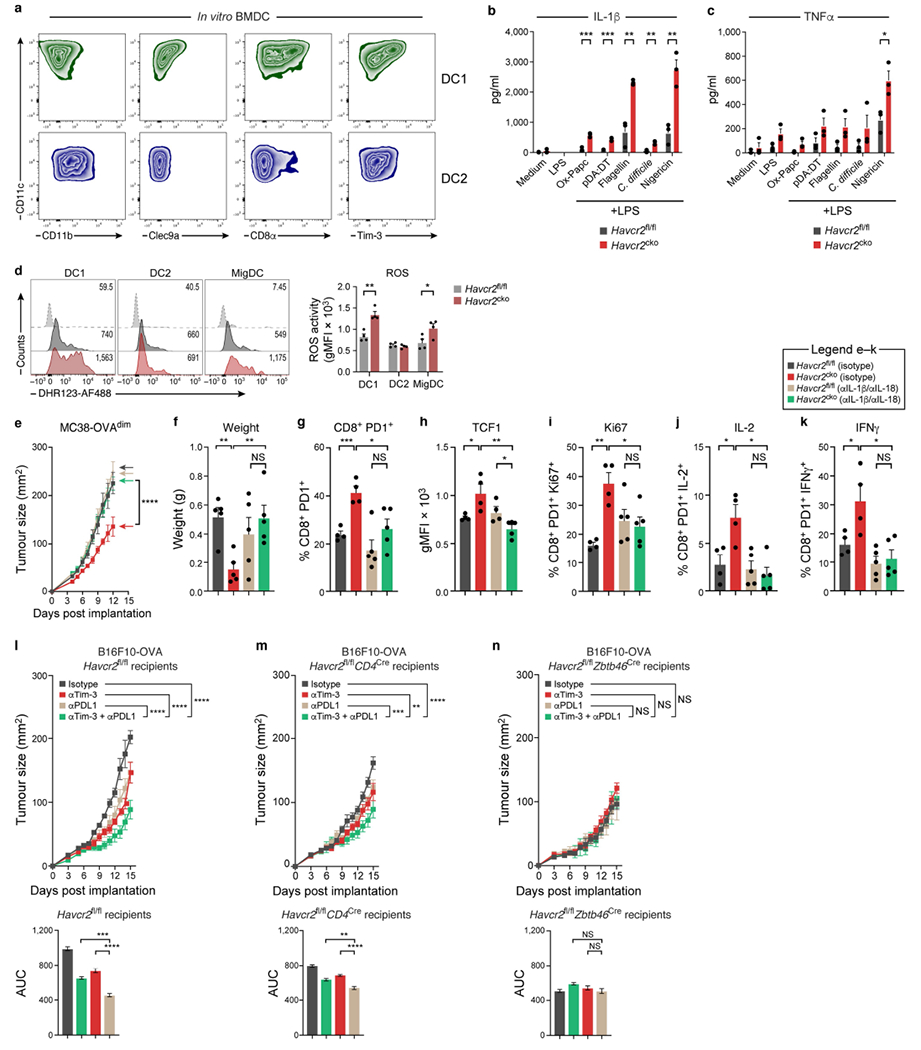
a, Unidirectional analysis of the fraction of DCs expressing a ligand and the fraction of T cells expressing the cognate receptor; ligand (migDCs)-receptor (CD8) interaction from tumours in Havcr2fl/fl (left) and Havcr2cko (right) mice. b, c, ECDF plots showing enrichment of IL-18 (b) and IL-1 (c) signatures in Havcr2fl/fl (grey) and Havcr2cko (red) CD8+ TILs. d, e, ECDF plot of enrichment score for inflammasome signature (d; P = 1.5 × 10⁻³) and dot plot for selected genes from inflammasome signature (e) in Havcr2fl/fl (grey) and Havcr2cko (red) migratory DCs. f, g, ECDF plot of enrichment score for oxidative stress signature (f) and dot plot of selected genes from oxidative stress signature (g) in Havcr2fl/fl (grey) and Havcr2cko (red) migratory DCs. h, i, MC38-OVAdim cells implanted subcutaneously in Havcr2fl/fl and Havcr2cko mice treated with N-acetylcysteine (NAC) (n = 4 or 5). h, Tumour size. i, Tumour supernatant was collected, and levels of IL-1β were determined by ELISA. Data are mean ± s.e.m. Student’s two-tailed t-test. j-l, Tumour growth curve of MC38-OVAdim cells implanted subcutaneously in Havcr2fl/fl and Havcr2cko mice treated with vehicle control or caspase 1 inhibitor (Casp1) (j; n = 4), MCC950 (k; n = 5) or anti-IL-1β and anti-IL-18 (l; n = 4 or 5). m-q, B16-OVA cells were implanted subcutaneously in Havcr2fl/fl and Havcr2cko mice treated with anti-IL-1β and anti-IL-18 (n = 5). Flow cytometry analysis of CD8+ TILs (m) from Havcr2fl/fl and Havcr2cko mice bearing B16-OVA tumours and treated with isotype control or anti-IL-1β and anti-IL-18. Expression of TCF1+ (n), Ki67 (o), T-bet (p) and IFN-γ (q). Results shown are from one experiment, representative of at least two independent experiments; n = 4 or 5 per group; h, j-l, two-way ANOVA; i, m-q, one-way ANOVA.
IL-1β and IL-18 are both tightly regulated cytokines that are released as mature proteins in a process mediated by inflammasomes32,33. Investigation of genes that were differentially expressed in Havcr2fl/fl and Havcr2cko mice, we found significant enrichment for an inflammasome gene signature in Havcr2cko migDCs (Fig. 4d; P = 1.5 × 10⁻³) including adaptor molecules involved upstream (Aim2 and Nlrp3) and downstream (Casp1, Casp4 and Il18) of inflammasome activation (Fig. 4e). Furthermore, agonists of NLRP3, AIM2 and NLRC4 substantially increased levels of IL-1β in supernatants from Havcr2cko bone-marrow-derived DC1s, whereas levels of TNF were only moderately increased (Extended Data Fig. 8a–c).
We hypothesized that endogenous damage-associated molecular patterns, including reactive oxygen species, oxidized lipids and oxidized DNA34–37, might be driving inflammasome activation in tumour-infiltrating Havcr2cko DCs. Indeed, Havcr2cko migDCs scored more highly on a gene signature associated with oxidative stress (Fig. 4f; P = 1.9 × 10⁻⁶), with upregulation of the key enzymes SOD1, SOD2, BAG3 and PRDX538,39 (Fig. 4g). We investigated the reactive oxygen species activity of DCs from MC38-OVAdim tumours, and found significantly increased activity in Havcr2cko DC1s and migDCs (Extended Data Fig. 8d). Furthermore, treatment with antioxidant N-acetylcysteine completely reversed the protective inhibition of tumour growth in Havcr2cko mice (Fig. 4h). Mitigation of oxidative stress in tumours in Havcr2cko mice also completely abrogated tumour IL-1β levels (Fig. 4i).
Finally, we used three different approaches to target the inflammasome pathway in vivo: (1) a caspase 1 inhibitor to interfere with pro-IL1β and pro-IL-18 cleavage (Fig. 4j); (2) MCC950 to perturb oligomerisation of the inflammasome complex protein ASC40 (Fig. 4k); and (3) anti-IL-1β and anti-IL-18 blocking antibodies (anti-IL-1β/IL-18) to inhibit the downstream effector cytokines (Fig. 4l). Each of these approaches abolished the protective anti-tumour immunity in Havcr2cko, with anti-IL-1β/IL-18 having the most potent effect (Fig. 4l). Furthermore, flow cytometry analysis of the treated tumours from Havcr2cko mice showed complete reversal of the CD8+ phenotype (Fig. 4m–q, Extended Data Fig. 8e–k). Together with recent findings, these data highlight the role that innate cytokines such as IL-1 and IL-18 can have in curtailing an exhaustion trajectory, sustaining effector T cell responses for anti-tumour immunity. It is noteworthy that TIM-3 has also been shown to negatively regulate signalling through the IL-1 and IL-18 receptors by interacting with TIR841. How this interaction may function in DCs remains unknown, but could potentially implicate an autocrine feed-forward loop where loss of TIM-3 on DCs leads to more IL-1β production and also heightened responses to IL-1β, together promoting immunogenic DCs.
Previous preclinical studies have observed high expression of TIM-3 on intratumoural DCs and concluded that the therapeutic efficacy of anti-TIM-3 was probably mediated by DC1s9. However, TIM-3 is expressed by multiple cell types, confounding the interpretation of these studies. We implanted B16-OVA tumour cells in Havcr2fl/fl, Havcr2fl/fl Cd4cre and Havcr2fl/fl Zbtb46cre mice and treated the mice therapeutically with anti-TIM-3 and anti-PDL1. Havcr2fl/fl recipients showed a modest reduction in tumour burden with either anti-TIM-3 or anti-PDL1, with a further reduction using combined blockade (Extended Data Fig. 8l). Whereas the additive effect of anti-TIM-3 and anti-PDL1 was also observed in Havcr2fl/fl Cd4cre tumour-bearing mice, (Extended Data Fig. 8m), it was completely lost in the Havcr2fl/fl Zbtb46cre mice (Extended Data Fig. 8n), suggesting that anti-TIM-3 works primarily on DCs to induce anti-tumour immunity. Of note, TIM-3 has been identified as a marker for leukaemic stem cells in AML12, with particularly high expression in patients with refractory AML13. Therefore, TIM-3 has become an attractive therapeutic target, and emerging data indicate that TIM-3 blockade in AML and myelodysplastic syndrome induces 50–60% response rates14, suggesting TIM-3 blockade as a therapeutic strategy for myeloid tumours where other checkpoint inhibitors have shown limited success42–44.
Together, we show that loss of TIM-3 prevents migDCs from acquiring a regulatory program, facilitating the maintenance of the CD8+ effector T cell pool driven by IL-1β and IL-18. These results build on growing interest in stimulating inflammasome pathways for cancer treatment45, and underscore the value of TIM-3 blockade in liberating inflammasome activity to potentiate anti-tumour immunity.
Methods
No statistical methods were used to predetermine sample size. The experiments were not randomized. The investigators were not blinded to allocation during experiments and outcome assessment.
Mice
Six-to eight-week-old C57BL/6, Cd11ccre, Zbtb46cre, Cd4cre, E8icre, Lysmcre, Cx3cr1cre and Foxp3-ERT2cre mice were purchased from the Jackson Laboratory. Havcr2fl/fl mice were generated as described in supplementary materials. TIM-3 conditional knockout mice were generated by crossing to the above cre lines. For knockin/knockout alleles (Lysmcre) the appropriate controls were used; that is, Havcr2fl/+ × Lysmcre+/−, for all other cre lines fl/fl mice were used as controls. For experiments with Foxp3-ERT2cre mice, mice were orally gavaged with 8 mg tamoxifen 3 days before tumour implantation and every 3 days thereafter for the duration of the experiments. Havcr2+/+ Foxp3-ERT2cre were used as an additional wild-type control but results were comparable to Havcr2fl/fl and were therefore not included. Deletion efficiency was determined by flow cytometry (not shown). Animal experiments were done in accordance with the guidelines of the institutional Animal Care and Use Committee (IACUC) at Brigham and Women’s Hospital and Harvard Medical School. All animals were euthanized before reaching humane endpoint, with tumour growth no greater than 2 cm in any one direction or of a total of 400 mm2 overall. Mice of both sexes were used throughout the study; sex-matched and age-matched (8–12 weeks) controls were used in individual experiments.
Gene-targeted deletion of mouse Havcr2 locus
To generate TIM-3 floxed mice on the C57BL/6 background, targeting vectors containing genomic fragments of the Havcr2 gene were constructed by using C57BL/6 BAC clones. Linearized targeting vector was transfected into B6 embryonic stem (ES) cells. Homologous recombinants were identified by Southern blot analysis and implanted into foster B6 albino mothers. Chimeric mice were bred to C57BL/6 mice, and the F1 generation was screened for germline transmission. The Neo gene was removed by breeding F1 mice with a strain of actin promoter-driven flipase transgenic mice (Jackson Laboratory) (Extended Data Fig. 1).
Tumour induction
The C57BL/6-derived colon carcinoma MC38 and MC38-OVAdim cells were maintained at 37 °C with 5% CO2 in DMEM supplemented with 10% heat-inactivated fetal calf serum (FCS), penicillin and streptomycin and 1% sodium pyruvate. The C57BL/6-derived melanoma cell lines B16- and B16-OVA-transfected clones were maintained at 37 °C with 5% CO2 in RPMI medium supplemented with 10% heat-inactivated fetal calf serum, penicillin and streptomycin. All cell lines used in this study tested negative for murine pathogens. MC38-OVAdim (0.5 × 10⁶), B16F10 or B16-OVA (0.25 × 10⁶) and MC38 (1.0 × 10⁶) cells were injected subcutaneously in 100 μl PBS on the flank. Tumour size was determined by the formula L × W, where L is length and W is width. In some experiments, mice were treated with anti-IL-1β (B122) and anti-IL-18 (YIGIF74-1G7) or appropriate control hamster immunoglobulin and rat IgG2a (all at 8 mg kg−1) intraperitoneally on days 3, 6 and 9 after tumour implantations. For immune-checkpoint experiments anti-TIM-3 was administered at a dose of 8 mg kg−1 and anti-PDL1 at a dose of 2 mg kg−1. Isotype controls were used at the same concentration in control mice. Neutralizing anti-IL-4 was used at 1.25 mg kg−1, anti-IL-12 at 25 mg kg−1. For MCC950 experiments, mice were treated with MCC950 (R&D Systems) at a dose of 8 mg kg−1 or PBS as control intraperitoneally on days 0, 2, 4, 6, 8 and 10 until the end of the experiment. For caspase 1 inhibitor (Invivogen) experiments, mice were orally gavaged with 8 mg kg−1 inhibitor or control (water) at on days 0, 2, 4, 6, 8 and 10 until the end of the experiment. For N-acetylcysteine experiments mice were given N-acetylcysteine daily in drinking water at a concentration of 40 mM.
Lung tumour
Lung tumour experiments were conducted using orthotopic syngeneic KP1.9 lung adenocarcinoma cells. These cells are derived from lung tumours of C57BL/6 KP mice harbouring Kras and Trp53 mutations46. Tumour cells were injected intravenously (2.5 × 10⁵ cells in 100 μl PBS) to develop orthotopic tumours. Animals reproducibly show macroscopic lung tumour nodules at 3–4 weeks post injection. Evaluation of lung tumour burden was assessed by histological analyses based on haematoxylin and eosin (H&E) staining of explanted lung tissue collected 4 weeks post implantation. Tumour area was calculated as a percentage of area occupied by the tumour as a part of total lung tissue.
Preparation of cell suspensions
Single-cell suspension was obtained after tumour digestion with 20 μg ml−1 Liberase (Roche) and 20 ng ml−1 DNase I (Roche) at 37 °C for 30 min. Haematopoietic cells were enriched by density gradient centrifugation with 30% Percoll (GE Healthcare Life Sciences) for 20 min at 1,800 rpm (no brake) followed by passing through a 40-μm cell strainer. DCs were obtained from LNs after 20 μg ml−1 Liberase (Roche) and 20 ng ml−1 DNase I (Roche) at 37 °C for 30 min.
Flow cytometry
Single cell suspensions were incubated with anti-CD16/32 (BioXcell) for 15 min at 4 °C, followed by staining with fluorescently conjugated antibodies for 30–45 min at 4 °C.
The following cell populations were identified based on cell marker expression: neutrophils (CD45+CD11b+Ly6C−Ly6G+), monocytes (CD45+ CD11b+Ly-6G−Ly-6Chigh), CD11b+ macrophage (CD45+CD11b+Ly6G−Ly6C−F4/80+), T cells (CD45+CD3+CD4+ or CD8+), B cells (CD45+B220+CD19+), NK cells (CD45+CD3−NK1.1+), DC1 (CD45+CD3−CD19−NK1.1−, MHCII+CD11c+ CD64−CD11b−CD103+ (tumour) XCR1+ (lymphoid tissue)), DC2 (CD45+ CD3−CD19−NK1.1−MHCII+CD11c+CD64−CD11b+CD103/XCR1−), migDC DC1 (CD45+CD3−CD19−NK1.1−MHCII+CD11c+CD64−CD11b+CD103+).
The following antibodies (Biolegend and BD) were used: CD45 (30-F11), CD4 (RM4-5), CD8a (53-6.7), B220 (RA3-6B2), NK1.1 (PK136), CD11b (M1/70), CD11c (N418), CD103 (P84), XCR1 (ZET), CD64 (X54-5/7.1), CD86 (GL-1), PDL1 (10F.9G2), CD27 (LG.3A10), IL-7Ra (A7R34), CXCR5 (L138D7), CX3CR1 (SA011F11), CD5 (53-7.3), CD24 (M1/69), PDL2 (122), Lag3 (C9B7W), TIGIT (GIGD7), TIM-3 (5D12), Ly6C (HK1.4), Ly6G (1A8), TCRb (H57-597), F4/80 (BM8), Ki67 (16A8), T-bet (4B10) and TCF1 (C63D9).
Re-stimulation and intracellular cytokine staining
For intra-cellular cytokine (ICC) staining cells were stimulated with phorbol-12-myristate 13-acetate (PMA) (50 ng ml−1, Sigma-Aldrich) and ionomycin (1 μg ml−1, Sigma-Aldrich) in the presence of Golgi Plug (BD Biosciences) and Golgi Stop (BD Biosciences) for 4 h before cell surface and ICC staining. Antibody detecting CD107α (1D4B) was added to the cells during cell culture incubation. Following fixation and permeabilization, staining with antibodies against the following was performed with the following antibodies purchased from Biolegend or BD Biosciences: IL-2 (JES6-5H4), TNF (MP6-XT22), IFN-γ (XMG-1.2), granzyme B (GB11), IL-10 (JES5-16E3), Perforin (eBioOMAK-D), IL-12p40 (C17.8), IL-27p28 (MM27-7B1), LAP (TW7-20B9), CXCL9 (MIG-2F5.5). Antigen specific T cells were determined by H-2Kb/OVA257-264 dextramer staining following the manufacturer’s protocol (Immudex). All data were collected on a BD Fortessa or Symphony (BD Biosciences) and analysed with FlowJo 10.4.2 software (TreeStar).
In vitro bone-marrow-derived DC cultures and DC transfer
Bone marrow cells were isolated by flushing femurs, tibias and humeri with PBS, supplemented with 0.5% BSA, 2 mM EDTA, and 1% penicillin/streptomycin (P/S). Bone marrow cells were strained through a 70-μm filter and centrifuged before resuspension in 1 × Ack lysis buffer (Gibco) for 5 min on ice. For generation of DC2 cells were plated in RPMI medium with 10% FCS, 1% L-glutamine, 1% sodium pyruvate, 1% MEM non-essential amino acids, 1% P/S, 55 μM 2-mercaptoethanol 10 ng ml−1 GMCSF (Peprotech) and 5 ng ml−1 IL-4 (R&D). DC1 cells were plated as above but with 200 ng ml−1 recombinant Flt-3 ligand (Biolegend). DCs were analysed on days 7-9. For transfer experiments, cells were sorted for expression of XCR1/CD103 (DC1) or Sirpα (DC2). On day 3 after tumour implantation DCs were transferred (0.5 × 10⁶ per mouse) in 50 μl PBS subcutaneously adjacent to the tumour. For sham control mice PBS alone was injected.
In vitro cross-presentation assays
Splenic DC1 s were cultured with Cell Trace Violet (CTV) labelled OT-I cells together with (1) HLA mismatched apoptotic splenocytes osmotically loaded with ovalbumin, or (2) latex beads passively coupled with OVA. Non-OVA loaded dead cells or non-OVA coupled beads served as control, respectively. After 72 h co-culture the proliferation of CD8+ T cells was assessed by flowcytometry where expression of CD44 together with dilution of CTV dye was indicative of activation and proliferation.
In vivo killing assay
On day 12 of tumour growth mice were injected intravenously with splenocytes differentially labelled with CFSE or CTV (Invitrogen) and loaded with 100 nM OVA257-264 or MOG37-46 (Irrelevant Antigen). Cells were injected at 50:50 ratio into MC38-OVAdim bearing Havcr2fl/fl or Haver2cko mice respectively and collected 24 h after injection. Percentage cytotoxicity calculated as 100 − ([CTV]/[CTV] + [CFSE]).
ROS activity assay
Single cell suspensions were generated as described and cells were resuspended in HBSS containing 0.1% BSA followed by FACS antibody surface marker staining for 30 min on ice. Cells were then washed and resuspended in PBS-EGG buffer (1 mM EDTA, 0.05% gelatine, 0.09% glucose) and 5.0 μM DHR123 probe (Thermo Fisher Scientific) was added for 30 min at 37 °C. The reaction was stopped by placing the cells on ice and washing with PBS-EGG buffer. Cells were resuspended in PBS containing 0.1% BSA and activated rhodamine 123 signal (activated DHR 123) was analysed in the FITC channel on a BD Symphony within 30 min. Hydrogen peroxide was added to some samples to serve as a positive control.
Inflammasome activation
Bone-marrow-derived DC1s were generated as described above. XCR1+ cells were sorted after 10 days of differentiation and seeded at a density of 0.5 × 10⁶. Sorted cells were either unstimulated or primed with LPS for 3 h followed by the addition of oxidised phospholipids (ox-PAPC) (100 μg ml−1; Invivogen), pdA:dT (1 μg ml−1; Invivogen), flagellin (1 μg ml−1; Invivogen), Clostridium difficile (1 μg ml−1; List Biologicals) or nigericin (10 mM; Invivogen). Following overnight cultures supernatants were collected and ELISA was performed to detect IL-1β and TNF (non-inflammasome regulated control).
Statistical analysis
Graphs were compiled and statistical analyses were performed with Prism software (GraphPad). Statistical significance was evaluated with the two-tailed unpaired t -test when comparing two groups and two-way ANOVA when comparing more than two groups. *P < 0.05, **P < 0.01, ***P < 0.001, ****P < 0.0001; NS, not significant.
Multiplexing samples by cell-hashing
After flow sorting, cells from each sample (tumour or dLN or ndLN from an individual mouse) was resuspended in PBS containing 2% FCS and stained with oligo tagged TotalSeq antibodies directed against CD45 for 30 min on ice. Cells were washed and pooled accordingly, centrifuged at 1,200 rcf for 5 min at 4 °C and resuspended in PBS + 2% FCS. For each 10X channel, 6 samples were combined: Havcr2fl/fl 1-Tumour, dLN, ndLN; KO1-Tumour, dLN, ndLN; Havcr2fl/fl 2-Tumour, dLN, ndLN; KO2- Tumour, dLN, ndLN.
scRNA-seq library preparation
Droplet-based 3′ end massively parallel single-cell RNA sequencing (scRNA-seq) was performed by encapsulating sorted live CD45+ tumour-infiltrating cells into droplets and libraries were prepared using Chromium Single Cell 5′ Reagent Kits v2 according to the manufacturer’s protocol (10X Genomics). The generated scRNA-seq libraries were sequenced using an Illumina HiSeq2500 to an average depth of 60.4 million paired end reads per sample.
scRNA-seq data analysis
We conducted all the pre-processing steps: generating, demultiplexing FASTQ files from the raw sequencing reads (bclfastq, v2.20), aligning to UCSC mm10 mouse transcriptome (cellranger, v3.0.2, 10X Genomics), demultiplexing cell-hashing data, and generating of raw gene count matrices using Cumulus (v0.8.0), a cloud based data analysis framework47. The pipelines were run in Terra Cloud Platform47 (http://app.terra.bio).
Downstream analysis was performed using the R software package Seurat48 (v2.3.4; http://satijalab.org/seurat/). We removed low-quality cells with less than 500 genes detected and removed genes expressed in fewer than 50 cells. The filtered raw gene expression matrix was cell-normalized over total number of counts, multiplied by 10,000 and log transformed. Principal component analysis (PCA) was performed on a submatrix of the top 1,000 most variable genes (computed using FindVariableGenes from Seurat), and the number of top principal components for further analysis was determined by the elbow method, keeping 12 and 15 principal components for analysis of tumour only or all cells (plus dLN, ndLN). We clustered cells used a shared nearest neighbour (SNN) modularity optimization-based clustering algorithm as implemented in a function FindClusters from the Seurat package. We computed cluster-specific differentially expressed genes using function FindAllMarkers from Seurat with default test parameters. Gene expression values, gene signature scores, and clustering results were visualized by embedding cells in a UMAP49 of the same dimensionally-reduced space as in clustering of cells. Annotating cell clusters was performed by assessing known cell-type markers and comparison with public myeloid tumour datasets16,50,51.
Creating gene signatures
Curated gene signatures were constructed from various databases of gene signatures as summarized in Supplementary Table 1. IL-1 signature was determined from differential genes between IL-1b-treated and vehicle CD8+ T cells52. The expression matrix was created from data downloaded from GEO database, accession number GSE127234. We used edgeR53 to compute the differentially expressed genes, and the IL-1 signature was created from top genes upregulated in IL-1b-treated cells (log(fold change) > 3, false discovery rate < 0.1).
Given a set of genes, we computed signature score activity levels using the AddModuleScore function in Seurat with the parameters defining the control gene-sets specified by n.bin = 25 and ctrl.size = 100. The difference in gene signature score activity levels between Havcr2fl/fl and Havcr2cko was examined using Wilcoxon rank-sum test and visualized using violin or ECDF plots.
Determining potential receptor-ligand Interactions
To characterize potential paracrine signalling between migDCs and CD8+ T cells, we used the method proposed by Schiebinger et al.31. In particular, we defined a list of ligands from the following GO terms: cytokine activity (GO:0005125), growth factor activity (GO:0008083), and hormone activity (GO:0005179). The set of receptors was defined by the GO term receptor activity (GO:0004872). We determined the set of potential ligand-receptor pairs using a curated database of mouse protein-protein interactions54. We quantified the potential ligand-receptor interactions by an interaction score defined as the product of the fraction of cells in the cell cluster expressing ligand and the fraction of cells in the cell cluster expressing the cognate receptor. To remove ubiquitously expressed ligands and receptors, we used 10,000 permutations to generate empirical null distribution of interaction scores by randomly shuffling the cell labels. Then we standardized each ligand-receptor interaction score by computing the distance between the interaction score and the mean interaction score in units of standard deviations from the permuted data as described31.
Reporting summary
Further information on research design is available in the Nature Research Reporting Summary linked to this paper.
Data availability
Data have been uploaded to NCBI Gene Expression Omnibus (https://www.ncbi.nlm.nih.gov/geo/) under data repository accession number GSE151914. Source data are provided with this paper.
Extended Data
Extended Data Fig. 1 |. Generation of conditional knockout mice for TIM-3.
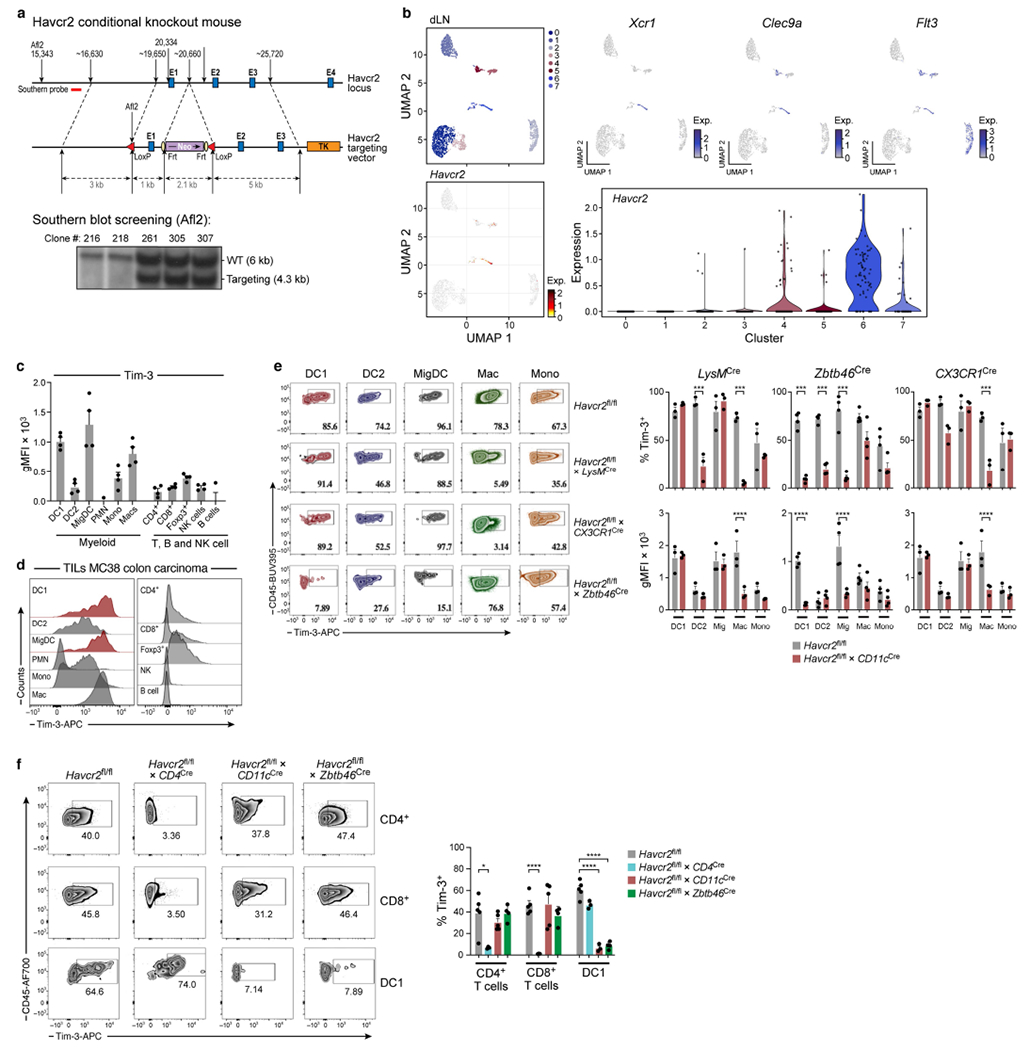
a, Strategy for generating the Havcr2-targeting vector to target the Havcr2 allele. Blue boxes represent exons (E). The 5′ external probes for Southern Blot are indicated by thick red line. Targeted events were identified by Southern blot analysis of Afl2-digested genomic ES cell DNAs with the 5′ flanking probe as shown in A. b, MC38-OVAdim (0.5 × 10⁶ cells) were subcutaneously implanted into Havcr2fl/fl and Havcr2fl/fl Cd11cCre mice. On D14 dLNs were explanted followed by cell sorting for sc-RNA-seq of CD45+ cells. UMAPs of canonical cDC1 markers Xcr1, Clec9a and Flt3, (bottom) UMAP of Havcr2 expression among clusters found in dLN, violin plot from scRNA-seq displaying normalized expression of Havcr2 in each cluster. c, d, WT mice were implanted with MC38 cells (1.0 × 10⁶). On D21 tumours were explanted followed by flow cytometric analysis of TIM-3 (gMFI) on tumour infiltrating immune cells (n = 3-4). e, MC38-OVAdim (0.5 × 10⁶ cells) tumour cells were subcutaneously implanted into Havcr2fl/fl, Havcr2fl/fl LysMCre (n = 3), Havcr2fl/flCx3cr1Cre (n = 3) and Havcr2fl/flZbtb46Cre (n = 4) animals. Representative Flow cytometric analysis of TIM-3 expression on DC1, DC2, migDCs, macrophages and monocytes. DCs were gated as in Ext Fig. 2: CD45+, CD3−CD19−NK1.1−, ClassII+CD11c+, Ly6c−CD64− and DC1: CD103+CD11b−, DC2: CD11b+ CD103− migDCs CD11b+CD103+. Macrophages: CD45+, CD3−CD19−NK1.1−, ClassIIlo Ly6cloCD64+F480+CX3CR1+, monocytes ClassIIlo Ly6chiCD64loLy6g−. (right) Percentage expression and gMFI of TIM-3. f, MC38-OVAdim (0.5 × 10⁶ cells) were subcutaneously implanted into Havcr2fl/fl (n = 5), Havcr2fl/flCd4Cre (n = 3), Havcr2fl/flCd11cCre (n = 5) and Havcr2fl/fl Zbtb46Cre (n = 4) mice. On D14 tumours were explanted followed by flow cytometric analysis of TIM-3 expression on CD4 TILs, CD8 TILs and tumour infiltrating DC1 from Havcr2fl/fl, Havcr2fl/fl × CD4Cre, Havcr2fl/fl × CD11cCre and Havcr2fl/fl × Zbtb46Cre. The results shown are from one experiment, representative of at least 3 independent experiments. ***P < 0.001; ****P < 0.0001 (One-Way ANOVA). Data shown (f) as mean ± s.e.m. *P < 0.05; ****P < 0.0001 (Student Two-Tailed t-test).
Extended Data Fig. 2 |. Deletion of TIM-3 in cDC using Zbtb46 recapitulates findings using CD11c cre.
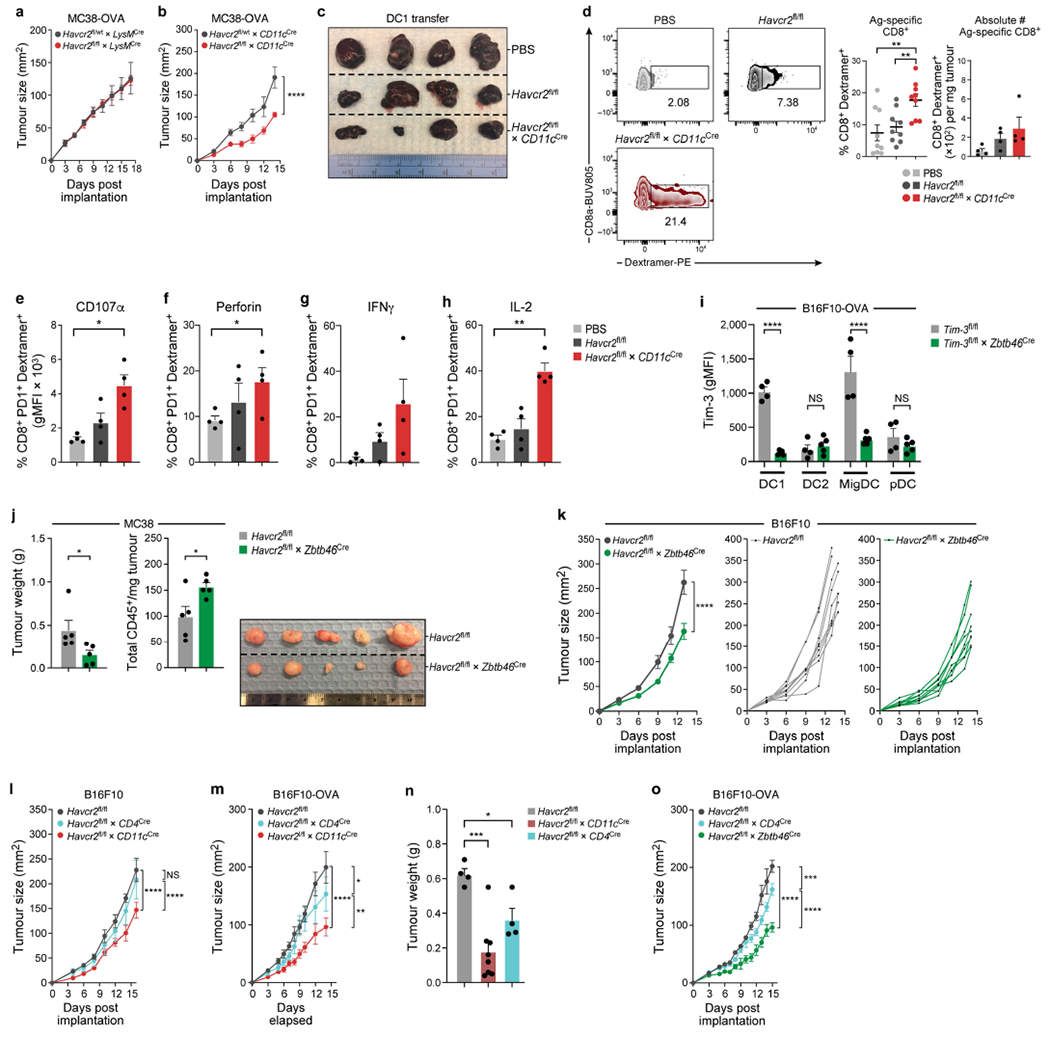
a, Tumour growth curve of MC38-OVAdim subcutaneously implanted into Havcr2fl/fl and Havcr2fl/flLysMCre (n = 6). b, Tumour growth curve MC38-OVAdim OVA subcutaneously implanted Havcr2fl/+ × CD11cCre and Havcr2fl/fl × CD11cCre (n = 5). c, Tumour of Havcr2fl/fl mice implanted with B16-OVA. On D3 XCR1+ BMDC1 were sorted, pulsed with OVA and injected into tumour bearing mice. d, Flow-cytometric analysis of frequency (n = 9), and absolute number (n = 4) of OVA specific CD8+ T cells from tumours injected with Havcr2fl/fl or Havcr2cko DC1. e-h, Flow-cytometric analysis of OVA specific CD8+ T cells from tumours injected with Havcr2fl/fl or Havcr2cko DC1 (n = 4). i, MC38-OVAdim (0.5 × 10⁶ cells) tumour cells were subcutaneously implanted into Havcr2fl/fl and Havcr2fl/fl × Zbtb46Cre animals (n = 4-5). Flow cytometric analysis (d14) of TIM-3 expression on tumour infiltrating DC1, DC2, migDCs and pDC from Havcr2fl/fl and Havcr2fl/fl × Zbtb46Cre. j, Tumour weight and total CD45+ cells of MC38 subcutaneously implanted Havcr2fl/fl and Havcr2fl/fl × Zbtb46Cre (n = 5). k, Tumour growth curve of B16 subcutaneously implanted Havcr2fl/fl and Havcr2fl/fl × Zbtb46Cre (n = 9). l, m, Tumour growth curve of B16F10 melanoma (l) and B16-OVA (m) subcutaneously implanted Havcr2fl/fl, Havcr2fl/fl × CD4Cre and Havcr2fl/fl × CD11cCre cre in parallel (n = 4-5). n, Weights of tumours from (Fig. 1l). o, B16-OVA subcutaneously implanted Havcr2fl/fl, Havcr2fl/fl × CD4Cre and Havcr2fl/fl × Zbtb46Cre in parallel (n = 4). The results shown are from one experiment, representative of at least three independent experiments. *P < 0.05; **P < 0.01; ***P < 0.001; ****P < 0.0001 (Two-Way ANOVA). Data shown (d-h) as mean ± s.e.m. *P < 0.05; **P < 0.01 (Student Two-Tailed t-test).
Extended Data Fig. 3 |. Deficiency of TIM-3 on DC leads to increased numbers of tumour infiltrating CD8+ T cells.
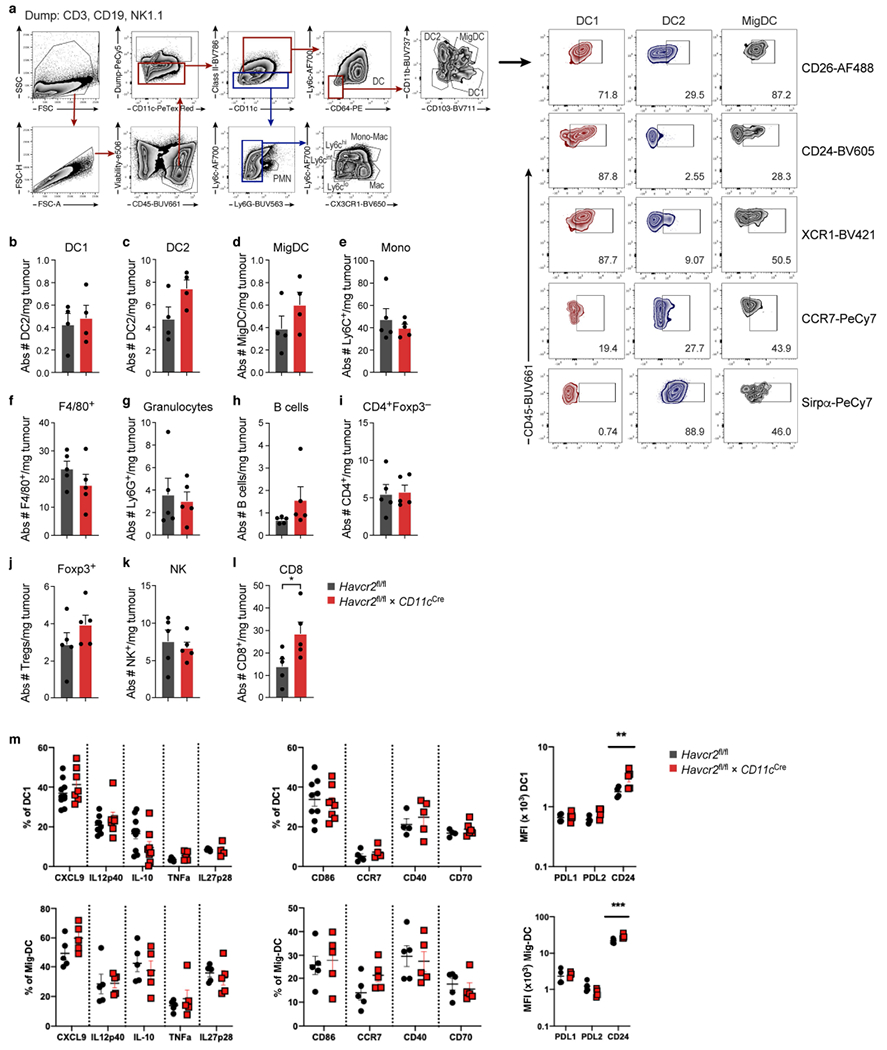
MC38-OVAdim (0.5 × 10⁶ cells) tumour cells were subcutaneously implanted into Havcr2fl/fl and isolated at D14. a, Gating strategy and phenotype of intratumoral myeloid cells. b-l, Flow cytometric quantification of immune cells in tumours from Havcr2fl/fl and Havcr2fl/fl × CD11cCre mice at d14 harvest. m, Flow cytometric analysis of DC1 and Mig DC from Havcr2fl/fl and Havcr2cko tumours at d14 harvest following in vitro stimulation for 4 h in the presence of Brefeldin A and Monensin. Data shown (l) as mean ± s.e.m. *P < 0.05 (Student Two-Tailed t-test) n = 5-9/group.
Extended Data Fig. 4 |. scRNA-seq of Havcr2fl/fl and Havcr2cko total CD45+ cells.

a, UMAP scRNA-seq plot of annotated total cells from Havcr2fl/fl and Havcr2fl/fl × CD11cCre (Havcr2cko) tumours. b, UMAP scRNA-seq plots showing select marker gene expression. c, Heat map from scRNA-seq displaying normalized expression of select genes in each cluster. d, UMAP scRNA-seq plot showing distribution of Havcr2fl/fl (blue) and Havcr2cko (orange) cells. e, Bar graph showing frequency of Havcr2fl/fl (blue) and Havcr2cko (orange) cells in each cluster.
Extended Data Fig. 5 |. Expansion of CD8+ PD1+ cells in Havcr2cko tumours.
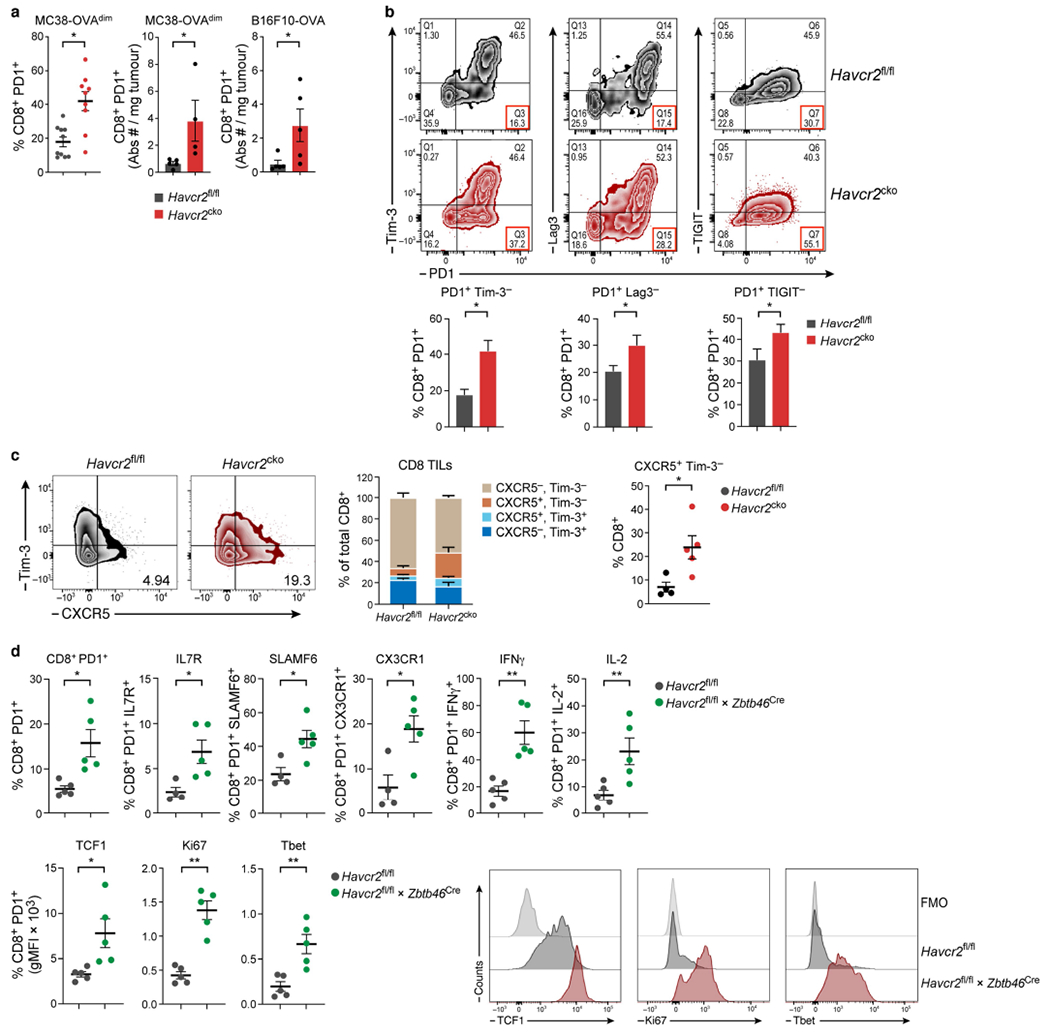
MC38-OVAdim (0.5 × 10⁶ cells) were subcutaneously implanted into Havcr2fl/fl and Havcr2fl/fl × CD11cCre (Havcr2cko) mice and harvested on D14. a, Frequency (n = 9-10) and absolute numbers (n = 4-5) of CD8+ PD1+ TILs from Havcr2fl/fl and Havcr2cko tumours. b, Analysis of expression of PD1 versus TIM-3, Lag3 and TIGIT in CD8+ TILs (n = 4-5). c, Flow cytometry (d14 harvest) of CD8 TILs from Havcr2fl/fl and Havcr2cko for expression of TIM-3 and CXCR5 (n = 4-5). d, Flow cytometry of CD8+ PD1+ TILs from Havcr2fl/fl and Havcr2fl/fl × Zbtb46Cre for expression of IL-7R, SLAMF6 CX3CR1, IFNγ, IL-2, TCF1, Ki67 and T-bet (bottom right) Representative histograms of data in d. The results shown are from one experiment, representative of at least three independent experiments, n = 4-5 group. *P < 0.05; **P < 0.01; (Student Two-Tailed t-test).
Extended Data Fig. 6 |. Identification of tumour infiltrating myeloid cells in Havcr2fl/fl and Havcr2cko tumours.
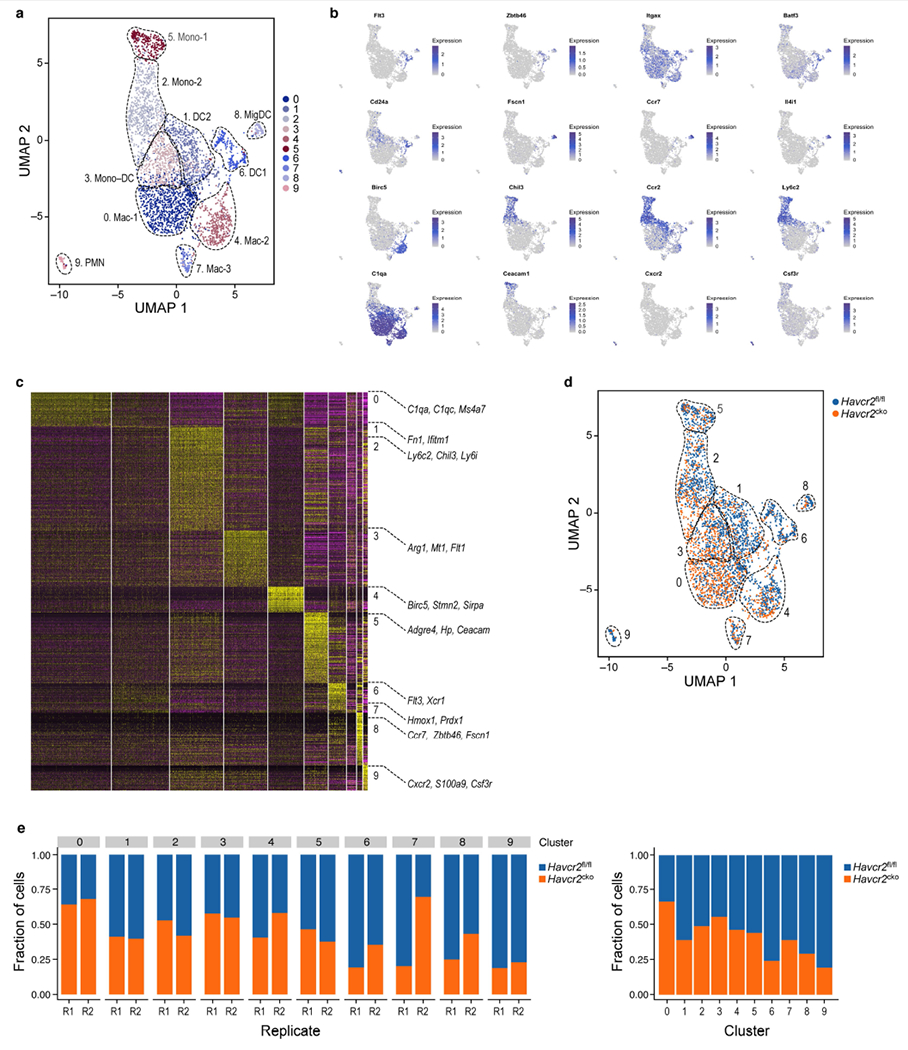
a, UMAP scRNA-seq plot of annotated total myeloid cells from Havcr2fl/fl and Havcr2fl/fl × CD11cCre (Havcr2cko) tumours. b, UMAP scRNA-seq plots showing select marker gene expression. c, Heat map from scRNA-seq displaying normalized expression of select genes in each cluster. d, UMAP scRNA-seq plot showing distribution of Havcr2fl/fl (blue) and Havcr2cko (orange) cells. e, Bar graph showing frequency of Havcr2fl/fl (blue) and Havcr2cko (orange) cells in each cluster.
Extended Data Fig. 7 |. Decreased expression of mregDC markers in TIM-3-deficient migDCs.
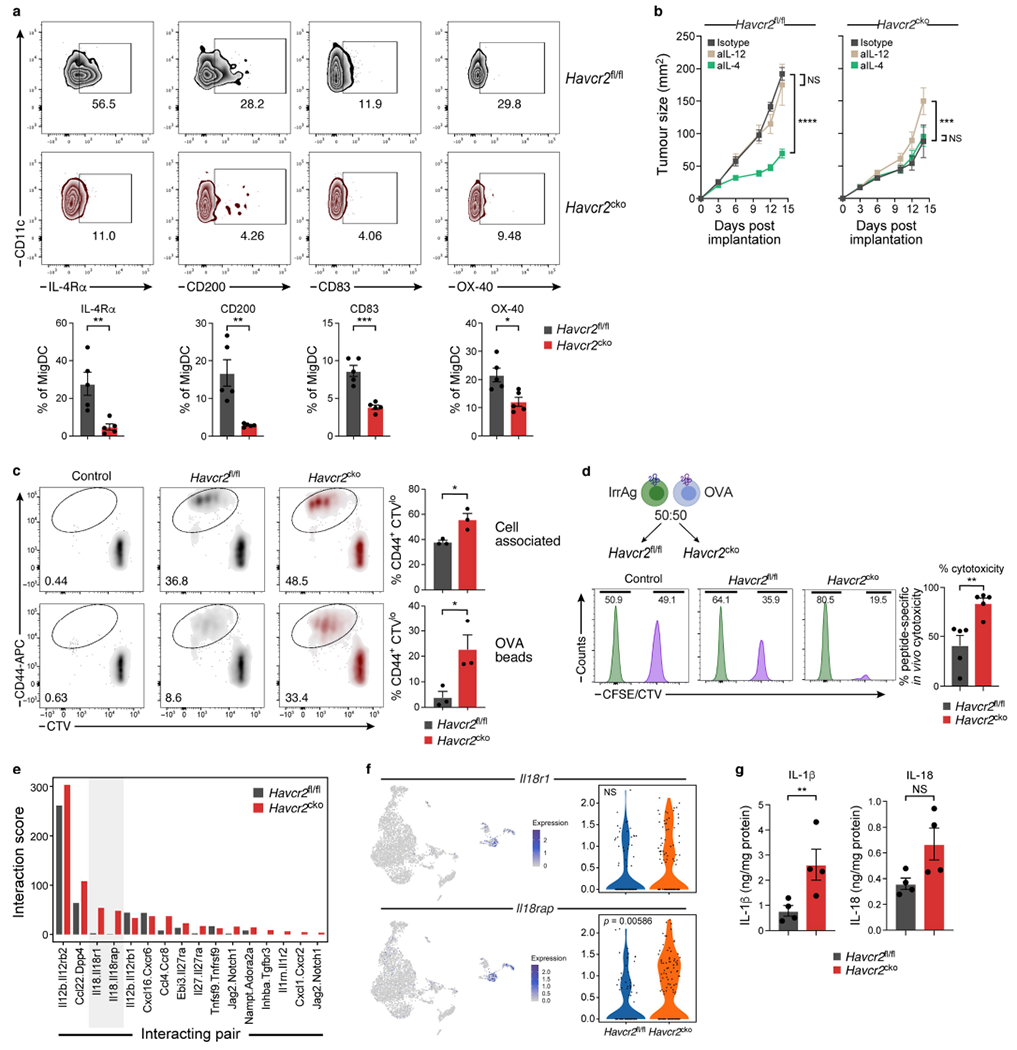
a, MC38-OVAdim (0.5 × 10⁶ cells) tumour cells were subcutaneously implanted into Havcr2fl/fl and Havcr2fl/fl × CD11cCre (Havcr2cko) animals and Flow cytometric analysis of DC populations was performed on D14 to assess expression of described mregDC markers including CD200, CD83, 1L4R and OX40. The results shown are from one experiment, n = 5 per group. *P < 0.05; **P < 0.01; ***P < 0.001; (One-Way ANOVA). b, Tumour growth curves of MC38-OVAdim (0.5 × 10⁶ cells) subcutaneously implanted into Havcr2fl/fl and Havcr2cko mice treated with either Isotype control, anti-IL-12 (500μg/mouse) or anti-IL-4 (25μg/mouse). Treatment was initiated on D3 and antibodies were delivered i.p. every 3 days until experiment cessation. The results shown are from one experiment, n = 4-5 per group. ***P < 0.001; ****P < 0.0001 (Two-Way ANOVA). c, Splenic DC were sorted from Havcr2fl/fl and Havcr2cko animals and cultured with dead HLA mismatched splenocytes osmotically loaded with 10mg/ml Ova together with CTV labelled naïve OTI cells. Representative plots of CD44+ CTVlo T cells after 72-h co-culture. Mean ± s.e.m. of 3 individual mice. Alternatively, DC from Havcr2fl/fl and Havcr2cko animals, were cultured with beads passively adsorbed with Ova together with CTV labelled naïve OTI cells. Representative plots of CD44+CTVlo T cells after 72-h co-culture. Mean ± s.e.m. of 3 individual mice, *P < 0.0001 (Student Two-Tailed t-test). d, CFSE or CTV labelled splenocytes were pulsed with OVA257-264 or MOG37-46 (Irrelevant Antigen) and injected at 50:50 ratio into MC38-OVAdim bearing Havcr2fl/fl or Havcr2cko mice. Percentage cytotoxicity calculated as 100-(CTV/CTV+CFSE) (n = 5). e, Bar plot of data from Fig. 4a, demonstrating unidirectional analysis of the fraction of DCs expressing ligand X and the fraction of T cells expressing the cognate Receptor; Ligand (migDCs): Receptor (CD8) interaction from Havcr2fl/fl (grey) and Havcr2cko (red) tumours. f, UMAP showing expression of Il18r1 and Il18rap on cluster 7 (CD8+ T cells), with violin plots showing the differential expression of both receptor in of Havcr2fl/fl (blue) and Havcr2cko (orange) CD8+ T cells, Havcr2fl/fl and Havcr2cko (e) tumours were harvested and mechanically dissociated. Tissue supernatant was collected, and levels of cytokines were determined relative to mg protein per sample, n = 4/group, **P < 0.01; (Student Two-Tailed t-test).
Extended Data Fig. 8 |. Enhanced inflammasome activation in TIM-3-deficientcko DC.
BMDC were differentiated in the presence of FLT3L for 10 days. a, Flow cytometric analysis assessing typical DC1 and DC2 markers. XCR1+ cells were sorted after 10 days of differentiation and seeded at a density of 0.25 × 10⁶. Sorted cells were either unstimulated or primed with LPS (1μg/ml) for 3 h followed by the addition of oxidised phospholipids (ox-PAPC) (100μg/ml), pdA: dT (1μg/ml), Flagellin (1μg/ml), C. difficile (1μg/ml), or Nigericin (10mM). b, c, Following overnight cultures supernatants were harvested and ELISA was performed to detect IL-1β (b) and TNF (c) (non-inflammasome regulated control). The results shown are from one experiment (n = 3 per group), representative of at least 3 individual experiments, *P < 0.05 **P < 0.01; ***P < 0.001 (Student Two Tailed t-test). d, MC38-OVAdim was subcutaneously implanted into Havcr2fl/fl and Havcr2cko mice and on D14 mononuclear cells were isolated and incubated with DHR123 as a measure of ROS activity (n = 4). e, Tumour growth curve of MC38-OVAdim subcutaneously implanted Havcr2fl/fl and Havcr2cko treated with control or anti-IL-1β and anti-IL-18 (n = 4). f, Weights of B16-OVA (0.25 × 10⁶ cells) subcutaneously implanted into Havcr2fl/fl and Havcr2fl/fl × Zbtb46Cre and treated with either Isotype control (Hamster IgG and Rat IgG2a) or anti-IL-1β and anti-IL-18 (Hamster IgG and Rat IgG2a respectively), all at a dose of 8mg/kg. g-k, Flow cytometric analysis of CD8+ TILs harvested from MC38-OVAdim tumours subcutaneously implanted into Havcr2fl/fl and Havcr2fl/fl × Zbtb46Cre and treated with either Isotype control upon termination of experiment (d15). The results shown are from one experiment, representative of at least two independent experiments n = 4-5/group. ***P < 0.001; ****P < 0.0001 (Two-Way ANOVA). l-n, Havcr2fl/fl (l), Havcr2fl/fl × CD4Cre (m) and and Havcr2fl/fl × Zbtb46Cre (n) mice were implanted with B16-OVA and monitored for development of a palpable tumour. On D6 when tumours reached ~30-50mm2 mice were randomized and treated with either (i) Isotype controls (IgG2a and IgG2b), (ii) anti-TIM-3, (iii) anti PD-L1 and (iv) anti-TIM-3 + PD-L1. Anti-TIM-3 was administered at a dose of 200μg/mouse and anti-PDL1 at a dose of 50μg/mouse. All tumours were measured daily for the duration of the experiment. Antibody treatment was initiated on D6 and administered again on D9 and D12. Area under the curve (AUC) was calculated from graphs in (k-m). The results shown are from one experiment, n = 4 per group. **P < 0.01; ***P < 0.001; ****P < 0.0001 (Two-Way ANOVA). Area under curve data-**P < 0.01; ***P < 0.001; ****P < 0.0001 (One-Way ANOVA).
Supplementary Material
Acknowledgements
We thank all members of the Kuchroo lab, L. Apetoh, N. Acharya, M. Collins, A. Madi, Y. Wolf, J. Kagan and D. Zhivaki for insightful discussions, J. Xia, H. Stroh, S. Zaghouani, R. Kumar, C. Farmer and C. Lambden for laboratory support, and L. Gaffney for figure editing. The lung adenocarcinoma cell line KP1.9 was derived from lung tumours of C57BL/6 KP mice and was provided by A. Zippelius. The Ncr1cre mice were provided by E. Vivier. We thank J. Gould for help with Cumulus pipelines. K.O.D. was supported by the European Commission, Excellent Science H2020 no. 708658 and no. 10130984. M.A.S. was supported by Deutsche Forschungsgemeinschaft (DFG grant SCHR 1481/1-1). This work was supported by grants from the National Institutes of Health (V.K.K.: P01AI073748, P01CA236749, P01 AI056299, P01 AI039671 and R01AI144166; A.C.A.: R01CA187975), Klarman Cell Observatory at Broad Institute and a CEGS grant from NIH (M.T. and A.R.), and a Brigham and Women’s President’s Scholar Award (A.C.A.).
Footnotes
Online content
Any methods, additional references, Nature Research reporting summaries, source data, extended data, supplementary information, acknowledgements, peer review information; details of author contributions and competing interests; and statements of data and code availability are available at https://doi.org/10.1038/s41586-021-03626-9.
Competing interests V.K.K. has an ownership interest in and is a member of the scientific advisory board for Tizona Therapeutics, Bicara Therapeutics, Compass Therapeutics, Larkspur Biosciences and Trishula Therapeutics. V.K.K. and A.C.A. are named inventors on patents related to TIM-3. K.O.D., V.K.K., M.T. and A.R. are named inventors on a provisional patent that has been filed including work from this study. A.R. and V.K.K. are co-founders of and have an ownership interest in Celsius Therapeutics. Additionally, A.R. is a co-founder and equity holder in Immunitas Therapeutics, and was a scientific advisory board member of Thermo Fisher Scientific, Syros Pharmaceuticals, Asimov, and Neogene Therapeutics until 31 July 2020. A.C.A. is a member of the advisory board for Tizona Therapeutics, Trishula Therapeutics, Compass Therapeutics, Zumutor Biologics and ImmuneOncia and is a paid consultant for Larkspur Biosciences and iTeos Therapeutics. A.R. and O.R.-R. are co-inventors on patent applications filed by the Broad Institute to inventions relating to single-cell genomics. The interests of V.K.K. were reviewed and managed by the Brigham and Women’s Hospital and Partners Healthcare in accordance with their conflict-of-interest policies. The interests of A.R. were reviewed and managed by the Broad Institute and HHMI in accordance with their conflict-of-interest policies. Since 1 August 2020, A.R. has been an employee of Genentech, a member of the Roche group. O.R.-R. is currently an employee of Genentech. The authors declare no other competing interests.
Supplementary information The online version contains supplementary material available at https://doi.org/10.1038/s41586-021-03626-9.
References
- 1.Monney L et al. Th1-specific cell surface protein Tim-3 regulates macrophage activation and severity of an autoimmune disease. Nature 415, 536–541 (2002). [DOI] [PubMed] [Google Scholar]
- 2.Sakuishi K et al. Targeting Tim-3 and PD-1 pathways to reverse T cell exhaustion and restore anti-tumor immunity. J. Exp. Med. 207, 2187–2194 (2010). [DOI] [PMC free article] [PubMed] [Google Scholar]
- 3.Jin HT et al. Cooperation of Tim-3 and PD-1 in CD8 T-cell exhaustion during chronic viral infection. Proc. Natl Acad. Sci. USA 107, 14733–14738 (2010). [DOI] [PMC free article] [PubMed] [Google Scholar]
- 4.Rangachari M et al. Bat3 promotes T cell responses and autoimmunity by repressing Tim-3-mediated cell death and exhaustion. Nat. Med. 18, 1394–1400 (2012). [DOI] [PMC free article] [PubMed] [Google Scholar]
- 5.da Silva IP et al. Reversal of NK-cell exhaustion in advanced melanoma by Tim-3 blockade. Cancer Immunol. Res. 2, 410–422 (2014). [DOI] [PMC free article] [PubMed] [Google Scholar]
- 6.Anderson AC et al. Promotion of tissue inflammation by the immune receptor Tim-3 expressed on innate immune cells. Science 318, 1141–1143 (2007). [DOI] [PubMed] [Google Scholar]
- 7.Liu LZ et al. CCL15 recruits suppressive monocytes to facilitate immune escape and disease progression in hepatocellular carcinoma. Hepatology 69, 143–159 (2019). [DOI] [PubMed] [Google Scholar]
- 8.Broz ML et al. Dissecting the tumor myeloid compartment reveals rare activating antigen-presenting cells critical for T cell immunity. Cancer Cell 26, 638–652 (2014). [DOI] [PMC free article] [PubMed] [Google Scholar]
- 9.de Mingo Pulido A et al. TIM-3 regulates CD103+ dendritic cell function and response to chemotherapy in breast cancer. Cancer Cell 33, 60–74 (2018). [DOI] [PMC free article] [PubMed] [Google Scholar]
- 10.Chiba S et al. Tumor-infiltrating DCs suppress nucleic acid-mediated innate immune responses through interactions between the receptor TIM-3 and the alarmin HMGB1. Nat. Immunol. 13, 832–842 (2012). [DOI] [PMC free article] [PubMed] [Google Scholar]
- 11.Gayden T et al. Germline HAVCR2 mutations altering TIM-3 characterize subcutaneous panniculitis-like T cell lymphomas with hemophagocytic lymphohistiocytic syndrome. Nat. Genet. 50, 1650–1657 (2018). [DOI] [PubMed] [Google Scholar]
- 12.Kikushige Y et al. TIM-3 is a promising target to selectively kill acute myeloid leukemia stem cells. Cell Stem Cell 7, 708–717 (2010). [DOI] [PubMed] [Google Scholar]
- 13.Dama P, Tang M, Fulton N, Kline J & Liu H Gal9/Tim-3 expression level is higher in AML patients who fail chemotherapy. J. Immunother. Cancer 7, 175 (2019). [DOI] [PMC free article] [PubMed] [Google Scholar]
- 14.Uma Borate M et al. Phase Ib study of the anti-TIM-3 antibody MBG453 in combination with decitabine in patients with high-risk myelodysplastic syndrome (MDS) and acute myeloid leukemia (AML). Blood 134, 570 (2019). [Google Scholar]
- 15.Roberts EW et al. Critical role for CD103+/CD141+ dendritic cells bearing CCR7 for tumor antigen trafficking and priming of T cell immunity in melanoma. Cancer Cell 30, 324–336 (2016). [DOI] [PMC free article] [PubMed] [Google Scholar]
- 16.Maier B et al. A conserved dendritic-cell regulatory program limits antitumour immunity. Nature 580, 257–262 (2020). [DOI] [PMC free article] [PubMed] [Google Scholar]
- 17.Polprasert C et al. Frequent germline mutations of HAVCR2 in sporadic subcutaneous panniculitis-like T-cell lymphoma. Blood Adv. 3, 588–595 (2019). [DOI] [PMC free article] [PubMed] [Google Scholar]
- 18.Pfirschke C et al. Immunogenic chemotherapy sensitizes tumors to checkpoint blockade therapy. Immunity 44, 343–354 (2016). [DOI] [PMC free article] [PubMed] [Google Scholar]
- 19.Sade-Feldman M et al. Defining T cell states associated with response to checkpoint immunotherapy in melanoma. Cell 175, 998–1013 (2018). [DOI] [PMC free article] [PubMed] [Google Scholar]
- 20.Best JA et al. Transcriptional insights into the CD8+ T cell response to infection and memory T cell formation. Nat. Immunol. 14, 404–412 (2013). [DOI] [PMC free article] [PubMed] [Google Scholar]
- 21.Kurtulus S et al. Checkpoint blockade immunotherapy induces dynamic changes in PD-1−CD8+ tumor-infiltrating T cells. Immunity 50, 181–194 (2019). [DOI] [PMC free article] [PubMed] [Google Scholar]
- 22.Yost KE et al. Clonal replacement of tumor-specific T cells following PD-1 blockade. Nat. Med. 25, 1251–1259 (2019). [DOI] [PMC free article] [PubMed] [Google Scholar]
- 23.Thommen DS et al. A transcriptionally and functionally distinct PD-1+CD8+ T cell pool with predictive potential in non-small-cell lung cancer treated with PD-1 blockade. Nat. Med. 24, 994–1004 (2018). [DOI] [PMC free article] [PubMed] [Google Scholar]
- 24.Siddiqui I et al. Intratumoral Tcf1+PD-1+CD8+ T cells with stem-like properties promote tumor control in response to vaccination and checkpoint blockade immunotherapy. Immunity 50, 195–211 (2019). [DOI] [PubMed] [Google Scholar]
- 25.Miller BC et al. Subsets of exhausted CD8+ T cells differentially mediate tumor control and respond to checkpoint blockade. Nat. Immunol. 20, 326–336 (2019). [DOI] [PMC free article] [PubMed] [Google Scholar]
- 26.Im SJ et al. Defining CD8+ T cells that provide the proliferative burst after PD-1 therapy. Nature 537, 417–421 (2016). [DOI] [PMC free article] [PubMed] [Google Scholar]
- 27.Pauken KE et al. Epigenetic stability of exhausted T cells limits durability of reinvigoration by PD-1 blockade. Science 354, 1160–1165 (2016). [DOI] [PMC free article] [PubMed] [Google Scholar]
- 28.Jadhav RR et al. Epigenetic signature of PD-1+TCF1+ CD8 T cells that act as resource cells during chronic viral infection and respond to PD-1 blockade. Proc. Natl Acad. Sci. USA 116, 14113–14118 (2019). [DOI] [PMC free article] [PubMed] [Google Scholar]
- 29.Bottcher JP et al. NK cells stimulate recruitment of cDC1 into the tumor microenvironment promoting cancer immune control. Cell 172, 1022–1037 (2018). [DOI] [PMC free article] [PubMed] [Google Scholar]
- 30.Spranger S, Dai D, Horton B & Gajewski TF Tumor-residing Batf3 dendritic cells are required for effector T cell trafficking and adoptive T cell therapy. Cancer Cell 31, 711–723 (2017). [DOI] [PMC free article] [PubMed] [Google Scholar]
- 31.Schiebinger G et al. Optimal-transport analysis of single-cell gene expression identifies developmental trajectories in reprogramming. Cell 176, 928–943 (2019). [DOI] [PMC free article] [PubMed] [Google Scholar]
- 32.Martinon F, Burns K & Tschopp J The inflammasome: a molecular platform triggering activation of inflammatory caspases and processing of proIL-beta. Mol. Cell 10, 417–426 (2002). [DOI] [PubMed] [Google Scholar]
- 33.Zanoni I et al. An endogenous caspase-11 ligand elicits interleukin-1 release from living dendritic cells. Science 352, 1232–1236 (2016). [DOI] [PMC free article] [PubMed] [Google Scholar]
- 34.Masters SL et al. Activation of the NLRP3 inflammasome by islet amyloid polypeptide provides a mechanism for enhanced IL-1β in type 2 diabetes. Nat. Immunol. 11, 897–904 (2010). [DOI] [PMC free article] [PubMed] [Google Scholar]
- 35.Martinon F Signaling by ROS drives inflammasome activation. Eur. J. Immunol. 40, 616–619 (2010). [DOI] [PubMed] [Google Scholar]
- 36.Schroder K, Zhou R & Tschopp J The NLRP3 inflammasome: a sensor for metabolic danger? Science 327, 296–300 (2010). [DOI] [PubMed] [Google Scholar]
- 37.Groß CJ et al. K+ efflux-independent NLRP3 inflammasome activation by small molecules targeting mitochondria. Immunity 45, 761–773 (2016). [DOI] [PubMed] [Google Scholar]
- 38.Chakraborty D et al. Enhanced autophagic-lysosomal activity and increased BAG3-mediated selective macroautophagy as adaptive response of neuronal cells to chronic oxidative stress. Redox Biol. 24, 101181 (2019). [DOI] [PMC free article] [PubMed] [Google Scholar]
- 39.Rosati A, Graziano V, De Laurenzi V, Pascale M & Turco MC BAG3: a multifaceted protein that regulates major cell pathways. Cell Death Dis. 2, e141 (2011). [DOI] [PMC free article] [PubMed] [Google Scholar]
- 40.Coll RC et al. A small-molecule inhibitor of the NLRP3 inflammasome for the treatment of inflammatory diseases. Nat. Med. 21, 248–255 (2015). [DOI] [PMC free article] [PubMed] [Google Scholar]
- 41.Zhai Y et al. Opposing regulatory functions of the TIM3 (HAVCR2) signalosome in primary effector T cells as revealed by quantitative interactomics. Cell. Mol. Immunol. (2020). [DOI] [PMC free article] [PubMed] [Google Scholar]
- 42.Zeidan AM et al. A multi-center phase I trial of ipilimumab in patients with myelodysplastic syndromes following hypomethylating agent failure. Clin. Cancer Res. 24, 3519–3527 (2018). [DOI] [PMC free article] [PubMed] [Google Scholar]
- 43.Davids MS et al. Ipilimumab for patients with relapse after allogeneic transplantation. N. Engl. J. Med. 375, 143–153 (2016). [DOI] [PMC free article] [PubMed] [Google Scholar]
- 44.Daver N et al. Phase IB/II study of nivolumab in combination with azacytidine (AZA) in patients (pts) with relapsed acute myeloid leukemia (AML). Blood 128, 763 (2016).27354720 [Google Scholar]
- 45.Zhivaki D et al. Inflammasomes within hyperactive murine dendritic cells stimulate long-lived T cell-mediated anti-tumor immunity. Cell Rep. 33, 108381 (2020). [DOI] [PMC free article] [PubMed] [Google Scholar]
- 46.Engblom C et al. Osteoblasts remotely supply lung tumors with cancer-promoting SiglecFhigh neutrophils. Science 358, eaal5081 (2017). [DOI] [PMC free article] [PubMed] [Google Scholar]
- 47.Li B et al. Cumulus provides cloud-based data analysis for large-scale single-cell and single-nucleus RNA-seq. Nat. Methods 17, 793–798 (2021). [DOI] [PMC free article] [PubMed] [Google Scholar]
- 48.Butler A, Hoffman P, Smibert P, Papalexi E & Satija R Integrating single-cell transcriptomic data across different conditions, technologies, and species. Nat. Biotechnol. 36, 411–420 (2018). [DOI] [PMC free article] [PubMed] [Google Scholar]
- 49.Becht E et al. Dimensionality reduction for visualizing single-cell data using UMAP. Nat. Biotechnol. 37, 38–44 (2019). [DOI] [PubMed] [Google Scholar]
- 50.Zilionis R et al. Single-cell transcriptomics of human and mouse lung cancers reveals conserved myeloid populations across individuals and species. Immunity 50, 1317–1334 (2019). [DOI] [PMC free article] [PubMed] [Google Scholar]
- 51.Gubin MM et al. High-dimensional analysis delineates myeloid and lymphoid compartment remodeling during successful immune-checkpoint cancer therapy. Cell 175, 1014–1030 (2018). [DOI] [PMC free article] [PubMed] [Google Scholar]
- 52.Lee PH et al. Host conditioning with IL-1β improves the antitumor function of adoptively transferred T cells. J. Exp. Med. 216, 2619–2634 (2019). [DOI] [PMC free article] [PubMed] [Google Scholar]
- 53.Robinson MD, McCarthy DJ & Smyth GK edgeR: a Bioconductor package for differential expression analysis of digital gene expression data. Bioinformatics 26, 139–140 (2010). [DOI] [PMC free article] [PubMed] [Google Scholar]
- 54.Mertins P et al. An integrative framework reveals signaling-to-transcription events in Toll-like receptor signaling. Cell Rep. 19, 2853–2866 (2017). [DOI] [PMC free article] [PubMed] [Google Scholar]
Associated Data
This section collects any data citations, data availability statements, or supplementary materials included in this article.
Supplementary Materials
Data Availability Statement
Data have been uploaded to NCBI Gene Expression Omnibus (https://www.ncbi.nlm.nih.gov/geo/) under data repository accession number GSE151914. Source data are provided with this paper.