

Abstract
Multidrug resistance protein 4 (Mrp4) is an efflux transporter known to transport several xenobiotics and endogenous molecules. We recently identified that the lack of Mrp4 increases adipose tissue and body weights in mice. However, the role of Mrp4 in adipose tissue physiology are unknown. The current study aimed at characterizing these specific roles of Mrp4 using wildtype (WT) and knockout (Mrp4−/−) mice. Our studies determined that Mrp4 is expressed in mouse adipose tissue and that the lack of Mrp4 expression is associated with adipocyte hypertrophy. Furthermore, the lack of Mrp4 increased blood glucose and leptin levels, and impaired glucose tolerance. Additionally, in 3T3-L1 cells and human pre-adipocytes, pharmacological inhibition of Mrp4 increased adipogenesis and altered expression of adipogenic genes. Lack of Mrp4 activity in both of our in vivo and in vitro models leads to increased activation of adipose tissue cAMP response element-binding protein (Creb) and decreased plasma prostaglandin E (PGE) metabolite levels. These changes in Creb activation, coupled with decreased PGE levels, together promoted the observed metabolic phenotype in Mrp4−/− mice. In conclusion, our results indicate that Mrp4 as a novel genetic factor involved in the pathogenesis of metabolic diseases, such as obesity and diabetes.
Keywords: Mrp4, Drug transporters, adipogenesis
Introduction
Obesity and diabetes have reached epidemic proportions globally. In the U.S. alone, almost 35% of the adult population are overweight and 12.2% are diabetic(1, 2)(1, 2). Both obesity and diabetes are considered major risk factors for cardiovascular disease (CVD) (3, 4). Specifically, abdominal obesity is known to increase the risk of CVD through increased insulin resistance and inflammatory abnormalities (3, 5). An increase in adiposity (increase in adipose tissue mass) is a characteristic feature of obesity, while common features of obesity and diabetes also include dyslipidemia, insulin resistance, and hyperglycemia, all resulting from impaired metabolic homeostasis. The increasing rates of obesity and diabetes call for a greater need to identify novel factors involved in adipogenesis (increase in fat cell differentiation), which will provide better knowledge for the exploration of novel therapeutic for treating metabolic diseases.
Mrp4 belongs to the ATP-binding cassette (ABC) class of plasma membrane efflux transporters that are known to transport chemicals and endogenous substances in cells. Mrp4 is involved in transporting several anti-viral, anti-cancer, non-steroid anti-inflammatory drugs (NSAIDS), and signaling molecules such as conjugated bile acids, prostaglandins, cyclic AMP and GMP (6). Mrp4 is expressed in several tissues, with the highest expression in the kidneys (7). In humans, Mrp4 genetic polymorphisms are linked to diabetic nephropathy and altered drug metabolism and disposition (8, 9). In mice, lack of Mrp4 increases cholestatic liver injury by bile duct ligation, alleviates pulmonary hypertension, and leads to altered intestinal fluid section and platelet aggregation (10–13). Previous studies by our laboratory and collaborators showed that Mrp4 expression increases in metabolic tissues such as the liver and kidney in obesity and diabetes (14–17). The significance of increased Mrp4 expression in these disease conditions is unknown. Altered Mrp4 expression associated with these disease conditions suggests that Mrp4 may have a potential role in the pathogenesis of diseases such as obesity and diabetes. Whether this role is permissive or protective, it is currently unknown. Recently, we have identified that whole-body lack of Mrp4 worsened partial hepatectomy-induced hepatic steatosis (18). In mice, adipose tissue is known to play a significant role in partial hepatectomy-induced hepatic lipid accumulation. The role and expression of Mrp4 in adipose tissue have not been studied until now. Together, these observations further highlight the need to investigate the role of Mrp4 in adipose tissue physiology and lipid metabolism.
In this study, we characterized the expression of Mrp4 in adipose tissue and also analyzed adipose tissue physiology and morphology in both wildtype and Mrp4−/− mice. Additionally, we performed adipogenesis experiments using mouse 3T3-L1 fibroblasts and human pre-adipocytes. These studies together indicate that inhibition of Mrp4 activity either by pharmacological inhibition or genetic ablation promotes adipogenesis and adipose tissue hypertrophy. Lack of Mrp4 increases the risk of development of metabolic diseases as evidenced by increased adipose tissue weight, insulin resistance, decreased glucose clearance, and energy expenditure observed in Mrp4−/−mice. Our study also indicates that altered transport of cAMP and prostaglandin E2 (PGE2) in the absence of Mrp4 may play a significant role in the development of a metabolic disease phenotype and regulation of adipogenesis in Mrp4−/− mice and mouse fibroblasts, respectively.
Material and Methods:
Animals experiments:
Wildtype (WT, C57BL/6J) mice were purchased from Jackson Laboratories (Bar Harbor, ME). Mrp4 knockout (Mrp4 KO) mice were generated by the Schuetz laboratory on a C57BL6/129-SVJ background (19), and subsequently backcrossed for greater than 10 generations into a C57BL/6J genetic background (11). Mrp4−/− mice were bred at the University of Connecticut, Storrs (20). Sixteen-week old male and female WT and Mrp4−/− (n= 5 mice per group, except mentioned anywhere in this manuscript) were used for this study. All animal experiments were approved by the institutional animal care and use committee at the University of Connecticut, Storrs.
Plasma analysis:
Plasma lipids such as triglycerides, cholesterol and non-esterified free fatty acid were analyzed using Infinity Triglyceride and Cholesterol ester quantification kit (Fisher Diagnostics, Middletown, VA), and NEFA Kit (Wako Diagnostic, Richmond, VA) respectively (21). Plasma hormone such as leptin, insulin and glucagon like peptide-1 (GLP-1) levels were analyzed using RayBio® Leptin and Insulin ELISA kits (Ray Biotech, Inc., Norcross, GA), and Invitrogen GLP-1 Multispecies ELISA Kit (Catalog: BMS2194; ThermoScientific, Rockford, IL).
Hematoxylin and Eosin (H&E) staining and cell size quantification:
Epididymal adipose tissue samples were fixed in 10% neutral buffered zinc formalin and processed for sectioning. Following sectioning, the adipose tissue sections (5μm) were stained with H&E stain. Cell size quantification analysis was performed using Adiposoft software.
Glucose and insulin tolerance test:
For glucose tolerance test (GTT), male mice of both genotypes were fasted overnight and injected with a bolus dose of glucose (2g/Kg body weight, i.p.). Blood glucose levels were monitored at 0, 15-, 30-, 60-, 90- and 120-minutes post-injection. Blood samples were collected through tail vien incision and blood glucose levels were monitored using Contour blood glucose monitoring system and gluose test strips (22, 23). For insulin tolerance test (ITT), both WT and Mrp4−/− mice were fasted for 4 hrs and insulin (0.75 IU/Kg body weight, i.p.) was injected. Blood glucose levels were monitored similarly as GTT assay (22, 23).
RNA isolation and RT-qPCR analysis:
Total RNA was isolated using a phenol-chloroform isolation method. cDNA was synthesized according to manufacturer protocol using the iScript™ cDNA synthesis kit (Catalog: 170–8891, Bio-Rad Laboratories Inc., Hercules, CA). Gene expression analysis was performed with qPCR analysis using iTaq™ Universal SYBR® Green Supermix (Catalog: 172–5121, Bio-Rad Laboratories Inc.). β-actin was used as a housekeeping gene for analysis.
RNA-seq analysis:
Total RNA was isolated from adipose tissue of male mice using a phenol-chloroform isolation method. Gene expression analysis was performed using RNA-seq analysis on a BGISEQ-500 platform (n=4 mice per group). RNA-Seq experiments and data analysis was performed by BGI Americas Corp. (Cambridge, MA). Differentially expressed genes (DEGs) were identified using DEGseq and PossionDis algorithms considering fold change ≥ 2 and q-value ≤ 0.001, as previously described (24). Data analysis was performed using DEGs to identify Gene ontology and KEGG pathways that are altered in the absence of Mrp4. Raw and processed data generated in this analysis was uploaded on NCBI Geo database. The submission ID for this data sets is GSE162037.
Western blot analysis:
Total protein was isolated from adipose tissue using RIPA buffer. Total protein extracts were electrophoretically resolved using 8–10% polyacrylamide gels and trans-blotted onto the PVDF membrane (25). Immunochemical detection of proteins was performed using Mrp4 (M4I-10) antibody (Abcam, Cambridge, MA), β-actin (ab8227, Abcam), phospho-Creb (Ser-133) and total Creb antibody (Catalog: 9198 and 9197 respectively; Cell Signaling Technology®, Danvers, MA). Protein-antibody complexes were detected using an Immobilon™ Western chemiluminescent kit (Millipore, Billerica, MA) and exposed to CL-Xposure™ X-ray film (ThermoScientific, Rockford, IL).
Oil Red O (ORO) staining:
Lipid accumulation and adipogenesis of 3T3- L1 and human adipocytes cells were characterized using ORO staining (26). Following differentiation, cell culture media was removed and cells were washed with PBS. After washing, cells were fixed using 10% formalin for 30min, and then stained with 60% ORO working solution for 2 hrs. Following staining with ORO, cells were counterstained using hematoxylin.
3T3-L1 Adipocyte differentiation:
3T3-L1 (CL-173) fibroblasts were differentiated into adipocytes using a two-step differentiation protocol (26). Briefly, cells were incubated with the Mrp4 inhibitors MK-571 or ceefourin-1 (C1) at 10 and 50μM along with adipogenic differentiation medium-I containing growth media, IBMX (0.5 M), Insulin (10 μg/mL) and Dexamethasone (1μM), for three days. Cells were then treated with adipogenic differentiation medium-II composed of growth media + 10 μg/L insulin for two additional days. On Day 6, cell culture media was changed to growth media and cells were maintained for two more days before further analysis. Optimal concentrations of the MK-571 compound were determined from previous studies (10) and these concentrations were also used as a reference for treatment with the C1 compound.
Human preadipocytes differentiation:
Human pre-adipocytes cells were obtained from the Boston Nutrition Obesity Research Center (BNORC, Boston, MA). Pre-adipocytes were differentiated to mature adipocytes using the two-step differentiation protocol as previously mentioned (26, 27). Briefly, cells were incubated in serum-free differentiation media for three days. During this initial phase of differentiation, cells were incubated with the Mrp4 inhibitors MK-571 or ceefourin-1 (C1) at 50μM. Following the differentiation period, cells were cultured in serum-free maintenance media for 11 days. On day 14, cells were harvested and adipogenic marker gene expression was analyzed along with ORO staining.
Intracellular cAMP analysis:
Intracellular cAMP levels were analyzed in 3T3-L1 cells using cAMP ELISA kit (Catalog: 514010; Cayman Chemicals, Ann Arbor, MI). Briefly, cells were plated in a 6-well plate and treated with forskolin (10 μM) and MK-571 or C1 (50 μM) in serum-free media for 30 min (n=3 per group). At the end of the treatment period, cell culture supernatants were removed and cells were washed with PBS. After washing, cells were collected in 0.1 M HCl and intracellular cAMP levels were quantified according to manufacturer protocol.
Prostaglandin E and its metabolite analysis:
Prostaglandin E2 (PGE2) levels in cell culture media were analyzed using PGE2 ELISA kit Monoclonal (Catalog: 514010; Cayman Chemicals). Briefly, 3T3-L1 cells are plated in a 6-well-plate and cultured in growth media. Cells were treated with MK-571 or C1 (50 μM) in growth media for 24 hrs and cell culture media was collected for analysis (n=4 per group). Cells were lysed for protein quantification, which was used for normalizing analyte value. PGE2 levels in the cell culture media were quantified according to manufacturer protocol. Plasma PGE metabolite (13,14-dihydro-15-keto PGE2) levels in WT and Mrp4−/− mice were quantified using Prostaglandin E Metabolite ELISA Kit (Catalog: 514531; Cayman Chemicals) (28).
Indirect calorimetry analysis:
WT and Mrp4−/− female mice ( 5 WT mice and 4 Mrp4−/− mice) were caged individually in metabolic cages and indirect calorimetric values such as volumetric oxygen consumption (VO2) and, carbon dioxide release (VCO2), respiratory exchange ratio (RER), energy expenditure (EE), and activity were recorded over 24 hr using the Oxymax lab animal monitoring system (Columbus Instruments, Columbus, OH) (29).
Statistical Analysis:
Results are expressed as means + S.E.M. Data were analyzed by either two-way ANOVA followed by Bonferroni posthoc test or student t-test using Graph pad Prism5 software (GraphPad Software, Inc., La Jolla, CA). Differences were considered significant at p≤0.05.
Results
Lack of Mrp4 promotes the development of metabolic disease phenotype in mice.
Phenotype analysis of WT and Mrp4−/− mice showed that in females, lack of Mrp4 results in a significant increase in body weight, whereas in males, increasing trends in body weight gain were observed (Figure-1A). The adipose tissue (epididymal/gonadal fat pads) weights in both male and female mice were increased significantly by 2.6- and 3.9- fold respectively, compared to WT mice (Figure-1B). Similar to adipose tissue weights, adipose-to-body weight ratios also showed significant increases in Mrp4−/− mice (Figure-1B). Although adipose tissue weights in Mrp4−/− mice increased significantly, liver weights were not significantly altered in male or female Mrp4−/− mice (Supplementary Figure-1A). Similar to the body and adipose tissue weights, Mrp4−/− mice are visibly obese and have more adipose tissue depots (Figure-1C and Supplementary Figure-1B). These changes in body and adipose tissue weight in Mrp4−/− mice are intriguing as the expression and function of Mrp4 in adipose tissue is unknown. In mice, Mrp4 is highly expressed in the kidney with minimal expression in the liver (7). Protein analysis of different tissues in male mice showed that Mrp4 is expressed relatively high in both white and brown adipose tissues compared to the liver and muscle (Figure-1D). Additionally, we evaluated the epididymal white adipose tissue morphology in both WT and Mrp4−/− mice using H&E staining. Adipocyte cell size in both WT and Mrp4−/− mice was quantified and graphed with the frequency of cells on the y-axis and cell size on the x-axis (Figure-1E and Supplementary Figure-1C). Histological evaluation of adipose tissue showed that lack of Mrp4 in mice results in adipocyte hypertrophy along with increased adipose tissue weight. These results indicate that the lack of Mrp4 increases the risk of obesity.
Figure 1-. Mrp4-deficiency in mice promotes the development of the obese phenotype.
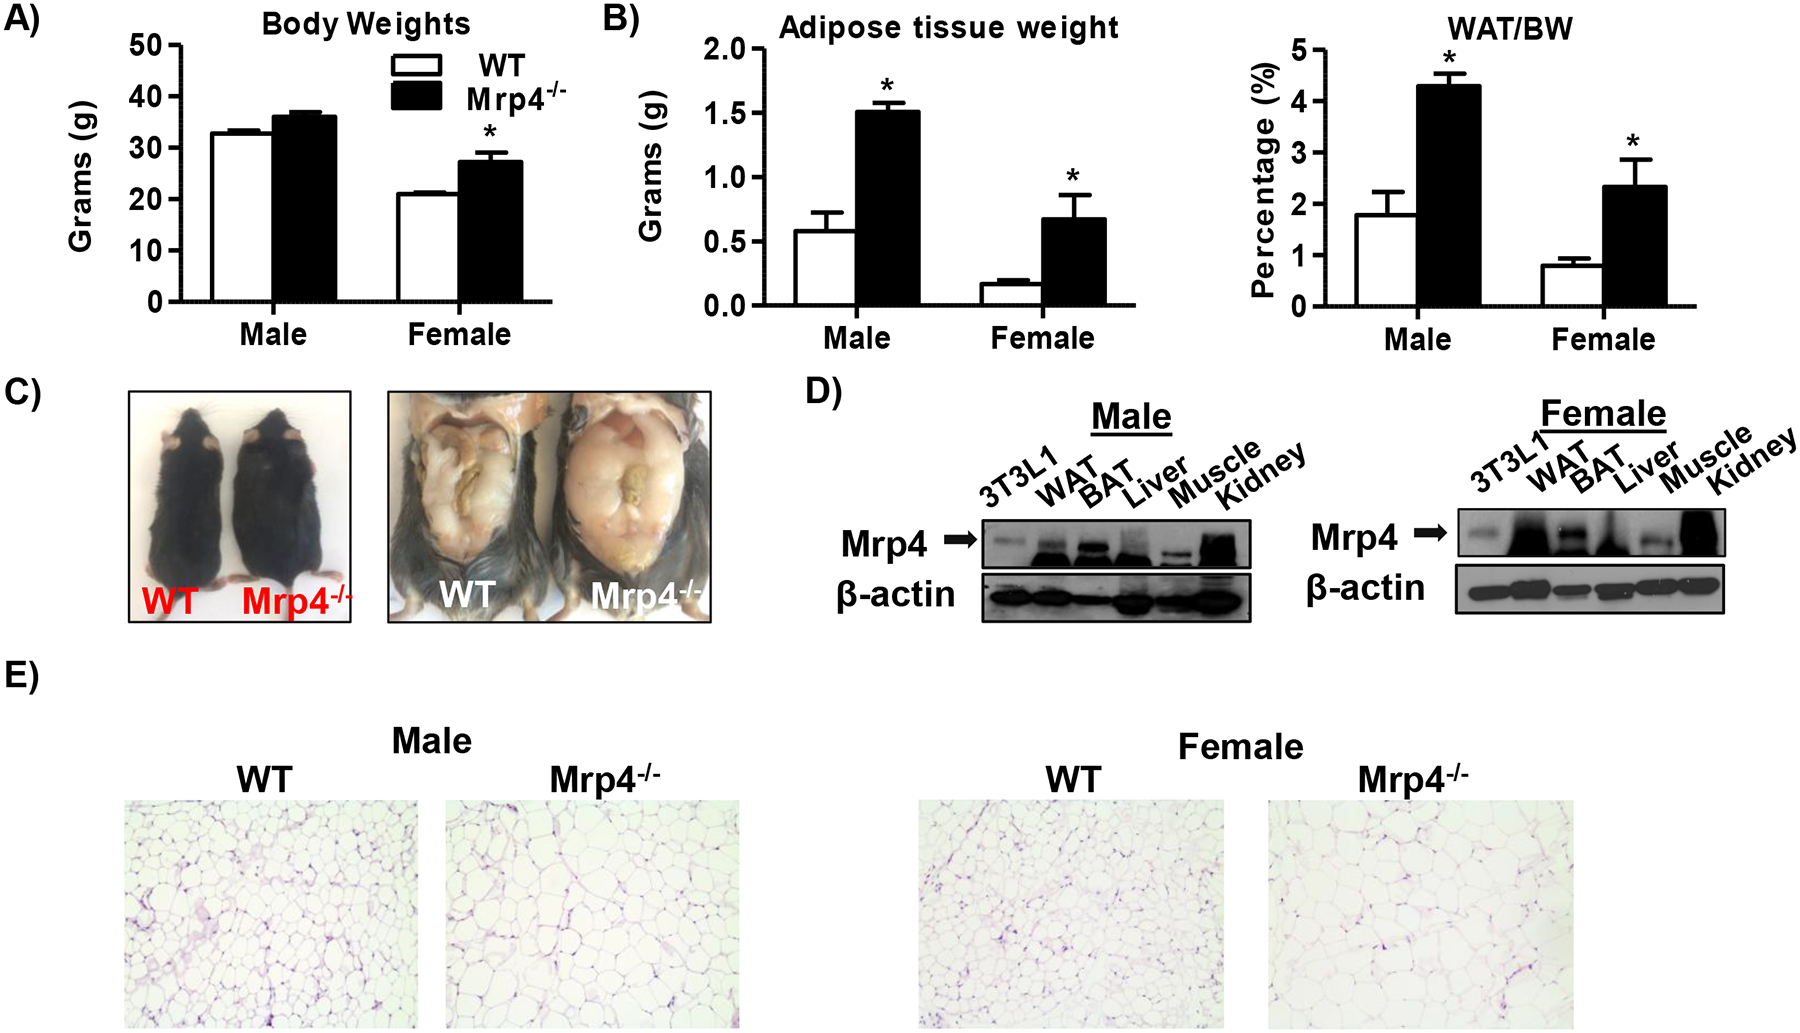
Phenotype characterization of WT and Mrp4−/− mice (n=5 mice per group). Bodyweight (A) and adipose (Epididymal/gonadal fat pad) tissue weights, and adipose to bodyweight ratios (B) of both male and female mice. C) Representative photographs of male WT and Mrp4−/− mice. D) Western blot analysis of Mrp4 in different tissues. E) Representative images (200X) of H&E stained white adipose tissue sections of WT and Mrp4−/− mice. Data are presented as mean ± SEM and p≤0.05 was considered as statistically significant. An asterisk “*” denotes significance between WT and Mrp4−/− mice.
Plasma leptin, an adipokine known to regulate several metabolic pathways (30), was increased at least by 3-fold in both male and female Mrp4−/− mice compared to WT mice (Figure-2A). These increases in plasma leptin levels in Mrp4−/− mice correlate with higher adipose tissue weight. Leptin is known to stimulate glucose clearance and suppress insulin secretion from the pancreas (30). Although plasma levels of leptin are elevated in Mrp4−/− mice, plasma insulin and GLP-1 levels are not altered compared to WT mice (Figure-2A). Interestingly, along with an increase in body weights, blood glucose levels are also significantly higher in both male and female Mrp4−/− mice compared to WT mice (Figure-2B). Mrp4−/− mice also exhibit impaired glucose clearance and insulin tolerance, as evidenced by glucose and insulin tolerance tests, respectively (Figure-2C and 2D). Although lack of Mrp4 leads to increased blood glucose levels and impaired glucose tolerance, Mrp4−/− mice do not show any significant changes in plasma lipids such as triglyceride, free fatty acids, and cholesterol compared to WT mice, except male Mrp4−/− mice have increased plasma free fatty acid levels compared to respective WT mice (Supplemental Figure-2).
Figure 2-. Lack of Mrp4 promotes the development of insulin resistance.
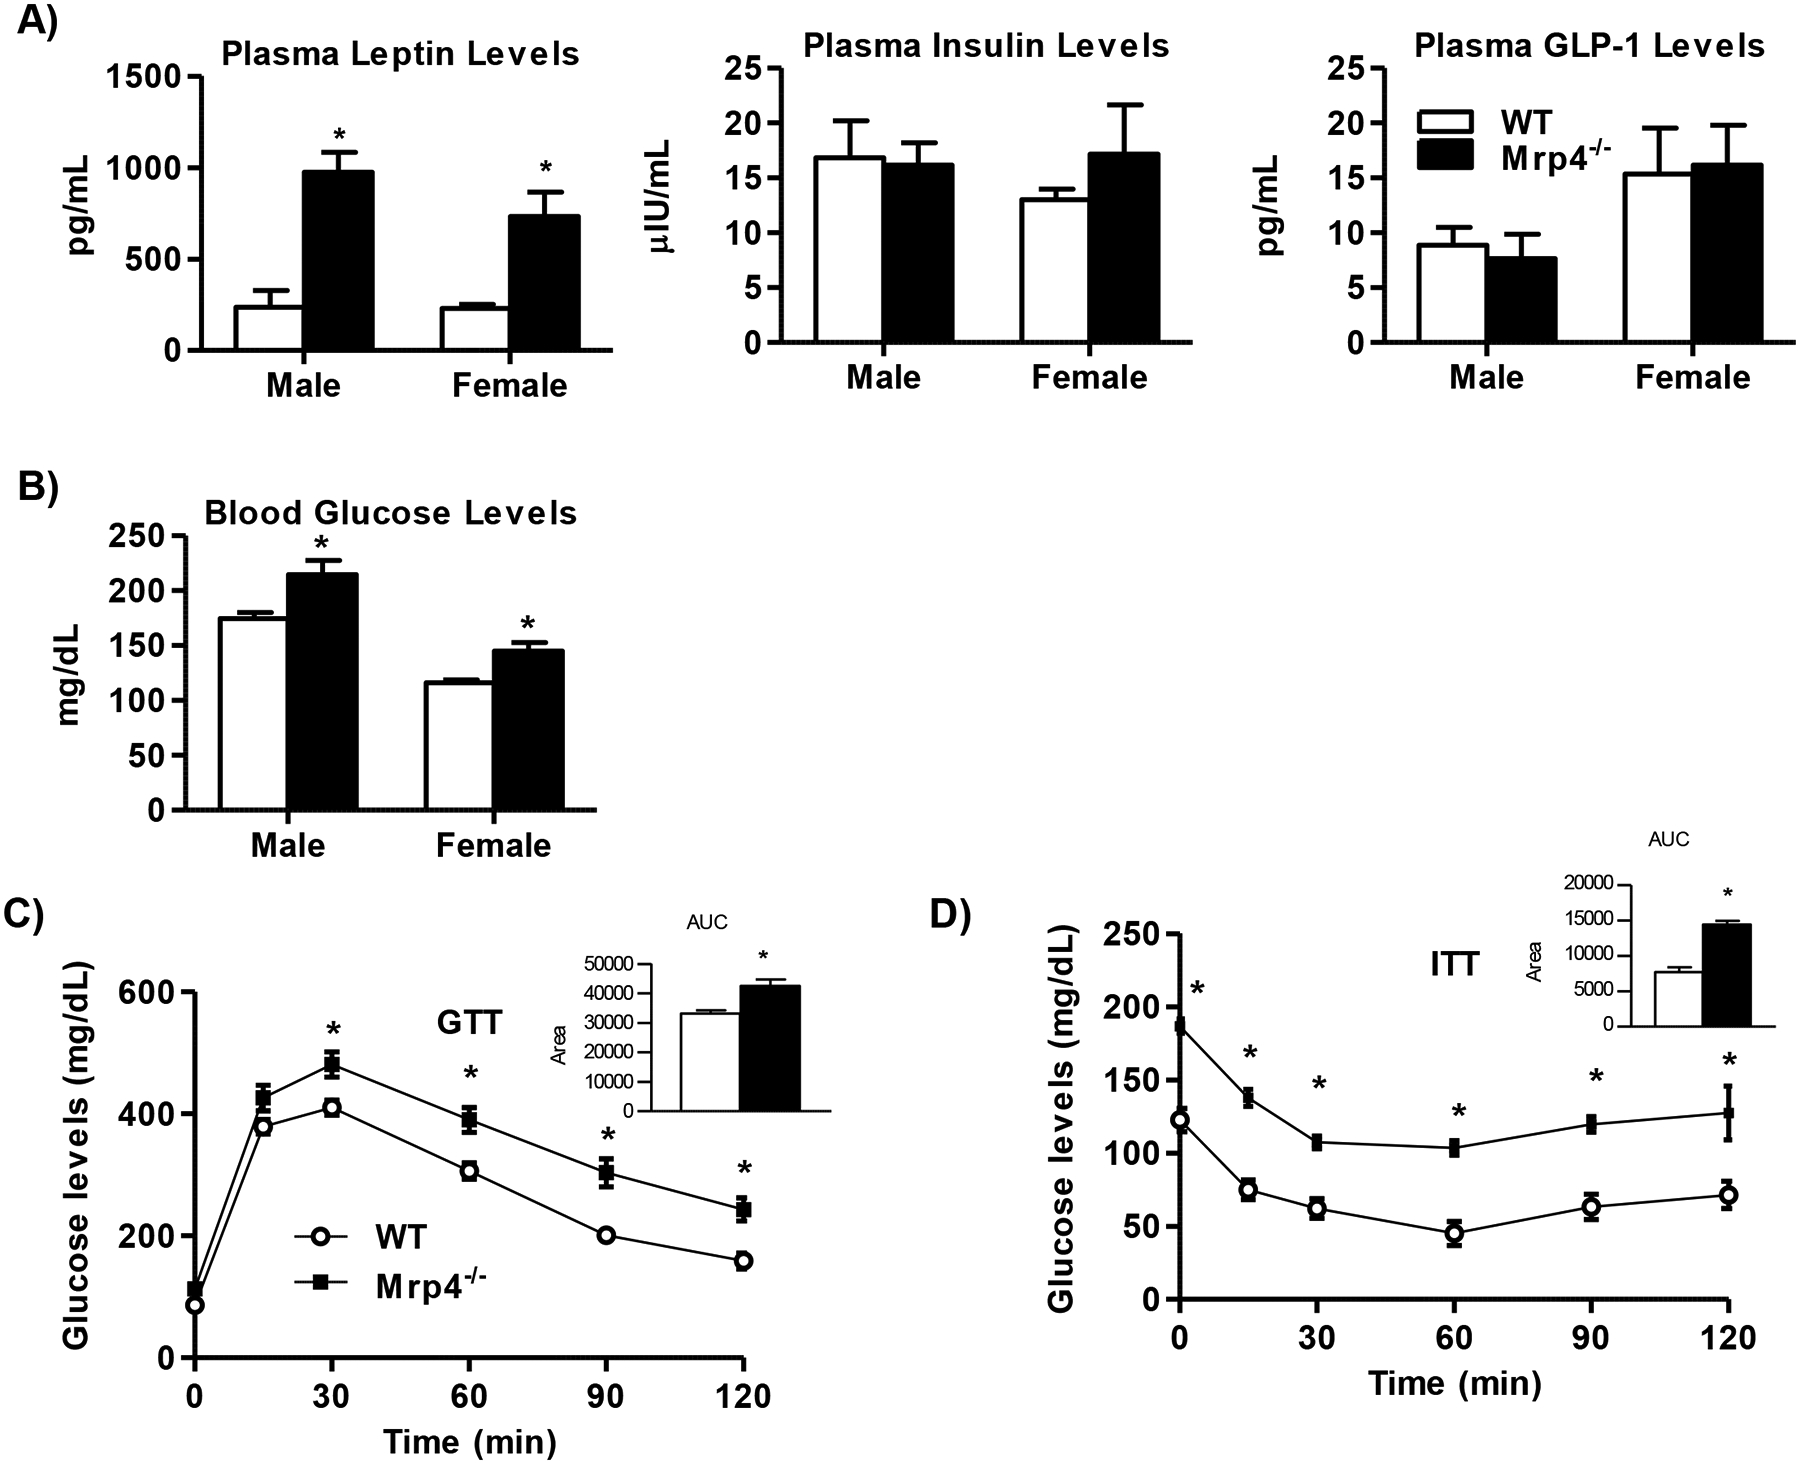
Mrp4 deficiency impairs glucose metabolism and hormone levels in mice (n=5 mice per group). A) Plasma leptin, insulin and GLP-1 levels; B) Blood glucose; C) Glucose tolerance test; and D) Insulin tolerance test. Data are presented as mean ± SEM and p≤0.05 was considered as statistically significant. An asterisk “*” denotes significance between WT and Mrp4−/− mice.
To understand the role of Mrp4 in nutrient metabolism and the pathogenesis of metabolic diseases, we further characterized the metabolic phenotype of these mutant mice by analyzing indirect calorimetry parameters. Mrp4−/− mice showed decreases in VO2 and VCO2 levels during the dark cycle or night time (Figure-3A). Food consumption was not significantly different between Mrp4−/− and WT mice (Figure-3B). RER, an indicator of preferential nutrient fuel source, did not show a significant change between genotypes (Figure-3C). Locomotor activity (ambulatory activity) and wheel count, parameters for activity, are significantly decreased in Mrp4−/− mice in the dark cycle only (Figure-3D &E). Along with decreased physical activity, energy expenditure or heat generated at the resting state was also decreased in Mrp4−/− mice during the dark cycle. (Figure-3F). Changes in these parameters measured using metabolic cages further validate that relationship between Mrp4 function and metabolic disease.
Figure 3-. Lack of Mrp4 alters energy metabolism in mice.
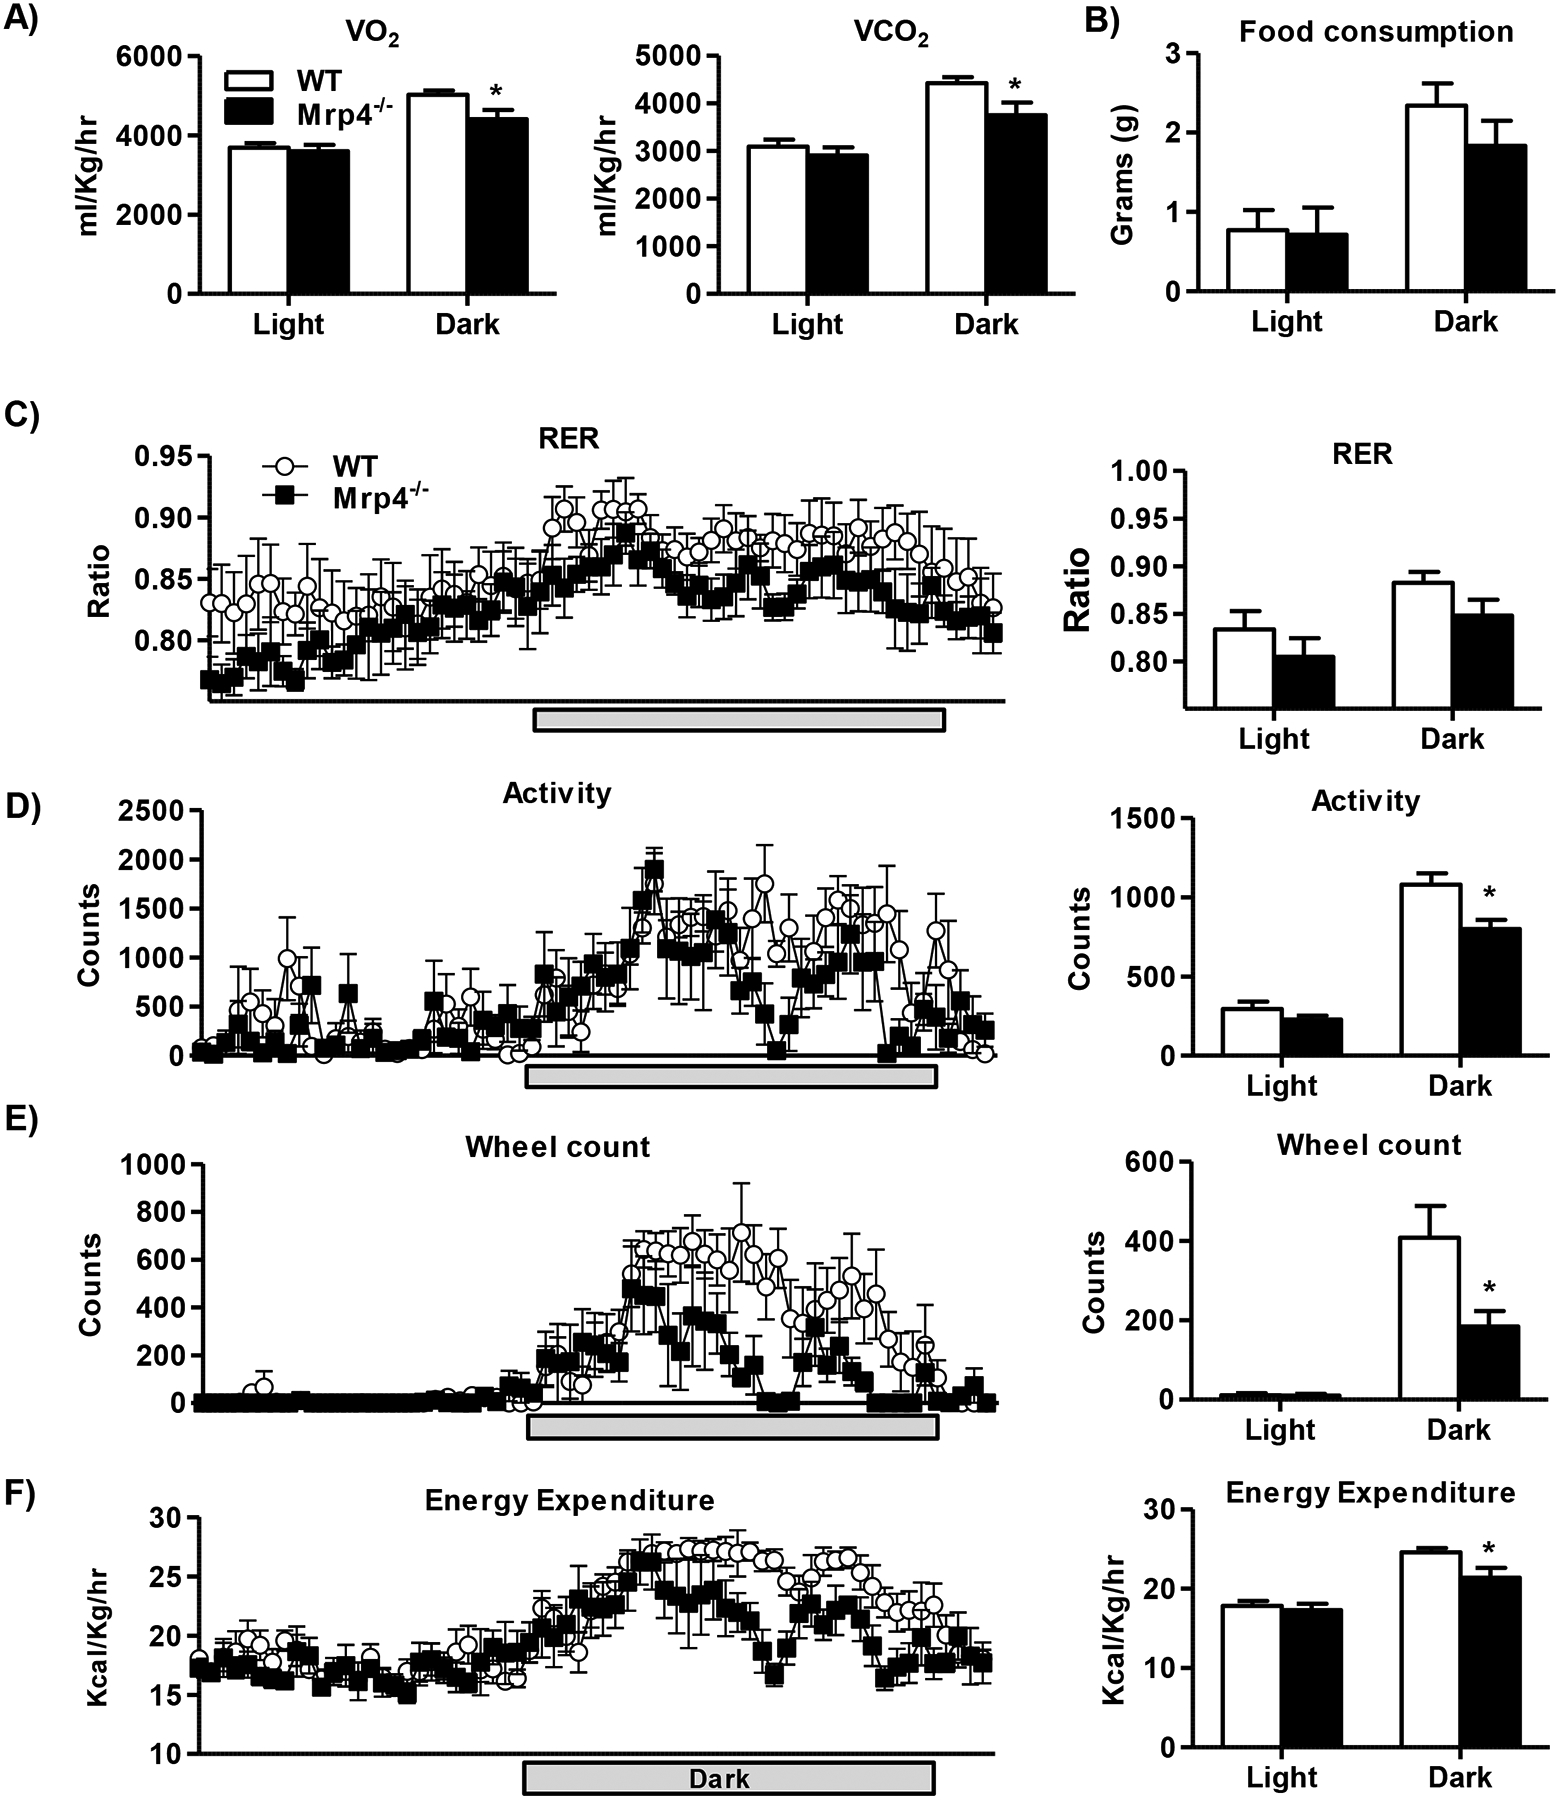
The metabolic phenotype of WT and Mrp4−/− female mice (n=4–5 mice per group) was characterized using metabolic cages. Indirect calorimetry measurements such as volumetric oxygen and carbon dioxide (A), food consumption (B), respiratory exchange ratio (RER) (C), energy expenditure (EE) (D), ambulatory activity (E) and wheel counts (F) were measured using the CLAMS system. Data are presented as mean ± SEM and p≤0.05 was considered as statistically significant. An asterisk “*” denotes significance between WT and Mrp4−/− mice.
Mrp4 deficiency alters several gene expression pathways in adipose tissue.
In order to identify key genes and pathways involved in altered adipogenesis in Mrp4−/− mice, we performed RNA-Seq analysis on adipose tissue samples. A total of 1260 differentially expressed genes (DEGs) were identified in Mrp4−/− mice compared to WT mice. Among these DEGs, 1011 genes are up-regulated, whereas 249 genes are downregulated (Figure-4A). The top 20-upregulated and downregulated genes were tabulated and presented in supplementary tables 1 and 2. Enriched KEGG pathway analysis identified several pathways that best explain the patterns of DEGs in adipose tissue between genotypes of mice (Figure-4B). Among these most enriched-pathways: metabolic pathways, complement and coagulation cascade, steroid hormone, retinol metabolism and arachidonic acid pathways have a greater number of DEGs (Figure-4C).
Figure 4-. Mrp4 deficiency alters adipose tissue gene expression.
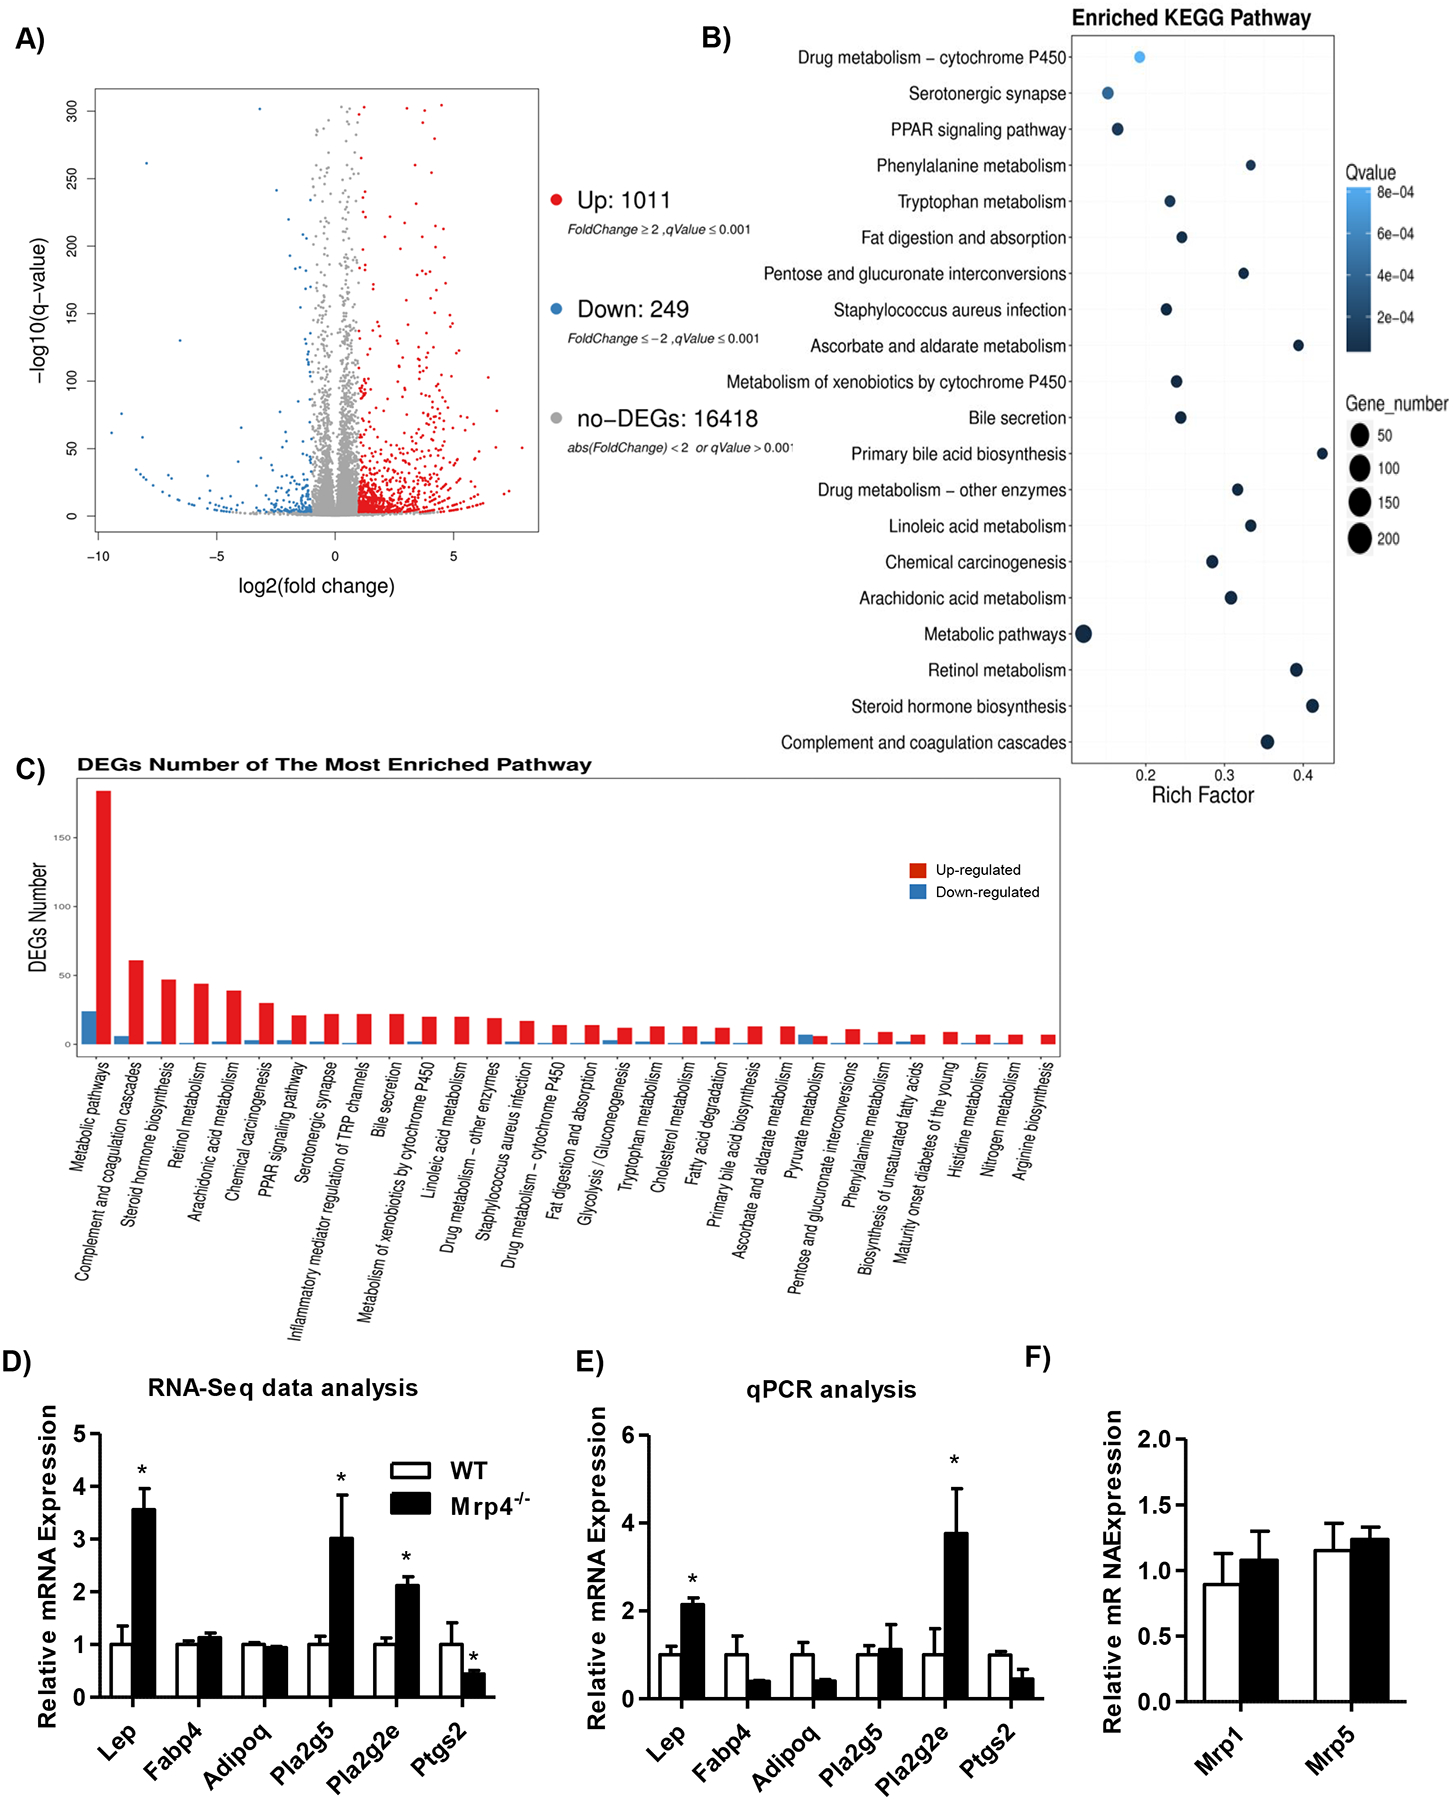
Adipose tissue gene expression was determined using RNA-Seq analysis along with DEG seq analysis in male mice. A) Volcano plot identifying up-regulated and down-regulated genes. B) Plot showing KEGG pathway functional enrichment of DEGs. C) Number of altered DEGs in enriched pathways. D) Fold change of some of the genes that were identified in RNA-seq analysis. E) Gene expression analysis verified using RT-qPCR analysis. F) Adipose tissue Mrp1 and 5 mRNA levels. Data are presented as mean ± SEM and p≤0.05 was considered as statistically significant. An asterisk “*” denotes significance between WT and Mrp4−/− mice.
A selected number of genes that are known to be markers of adipose tissue were presented from RNA-seq analysis (Figure-4D). These genes were reanalyzed using qPCR analysis and presented in Figure-4E. Similar to the increase in plasma leptin levels, adipose tissue leptin gene expression also increased by 2-fold (Figure-4D). Although lack of Mrp4 resulted in adipocyte hypertrophy, adipose tissue marker genes such as fatty acid-binding protein 4 (Fabp4) and adiponectin (Adipoq) gene expression is not altered in Mrp4−/− mice compared to WT mice. Phospholipases play a significant role in arachidonic acid and lipid metabolism. Sato et al (31) have shown that phospholipase A2 group 5 (Pla2g5) and 2E (Pla2g2e) are the two phospholipase genes that are adipocyte-inducible genes during obesity. Although RNA-seq analysis showed Pla2g5 and Pla2g2e were induced in Mrp4−/− mice, qPCR analysis showed only Pla2g2e expression was up-regulated by 3.8-fold in Mrp4−/− compared to WT mice (Figure- 4E). Similar to Pla2g5, prostaglandin-endoperoxide synthase 2 (Ptgs2), a key gene involved in arachidonic metabolism, did not show any significant changes in qPCR analysis (Figure-4E). Lack of Mrp4 in mice did not alter adipose tissue Mrp transporters such as Mrp 1 and 5 transporters mRNA expression, which have similar function as Mrp4 (Figure-4F).
Inhibition of Mrp4 promotes adipogenesis in fibroblast and human pre-adipocytes.
To further determine how Mrp4 function alters adipose tissue physiology and adipocyte hypertrophy, we employed in vitro models of adipogenesis, such as 3T3-L1 cells and human preadipocytes. In these experiments, we used the pharmacological inhibitors MK-571, a broad spectrum Mrp inhibitor known to inhibit Mrp4, and Ceefourin-1 (C1), a Mrp4-specific inhibitor (32). Gene expression analysis in completely differentiated 3T3-L1 cells showed that inhibition of Mrp4 by MK-571 at both 10 μM (Supplemental Figure-3A) and 50 μM ((Figure-5A) resulted in increased expression of adipogenic genes, such as CCAAT/enhancer-binding protein- alpha (C/ebpα), peroxisome proliferator-activated receptor-gamma (Pparγ), lipoprotein lipase (Lpl), Fabp4, glucose transporter type 4 (Glut4), and Adipoq . Along with the changes in expression of adipogenic genes, an increase in fat accumulation was also observed in differentiated 3T3-L1, as indicated by ORO staining (Figure-5B and Supplemental Figure-3B&C). Inhibition of Mrp4 with C1 at low concentration (10 μM) did not show significant differences in adipogenic gene expression and fat accumulation (Supplemental Figure-3A). However, at the higher concentration (50 μM), C1 treatment resulted in significant increases in expression of adipogenic genes, but of a lesser magnitude than that produced by MK-571 (Figure-5A). Similar to the results with the MK-571, treatment with the higher concertation C1 also resulted in increased fat accumulation in differentiated cells (Figure-5B and Supplemental Figure-3C). Additionally, we analyzed key adipogenic marker genes in 3T3-L1 cells at the initial stage of differentiation. Inhibition of Mrp4 by both MK-571 and C1, significantly increased Fabp4 expression on day 2 by 7.8- and 13-fold, respectively (Figure-5C). Similar to Fabp4, Pparγ, a transcription factor that is majorly involved in the regulation of Fabp4 expression and adipogenesis (33), is also upregulated on day-2 by 1.9- and 3.2- fold with MK-571 and C1 treatment, respectively (Figure-5C). Inhibition of Mrp4 also increased C/ebpβ expression, an early regulator of adipogenesis and also involved in the regulation of Pparγ expression (34), by at least 4-fold on day 1 (Figure-5C). Increases in the C/ebpβ expression were also observed on day-2, but of a lesser magnitude (Figure-5C).
Figure 5-. Inhibition of Mrp4 promotes adipogenesis in in vitro models.
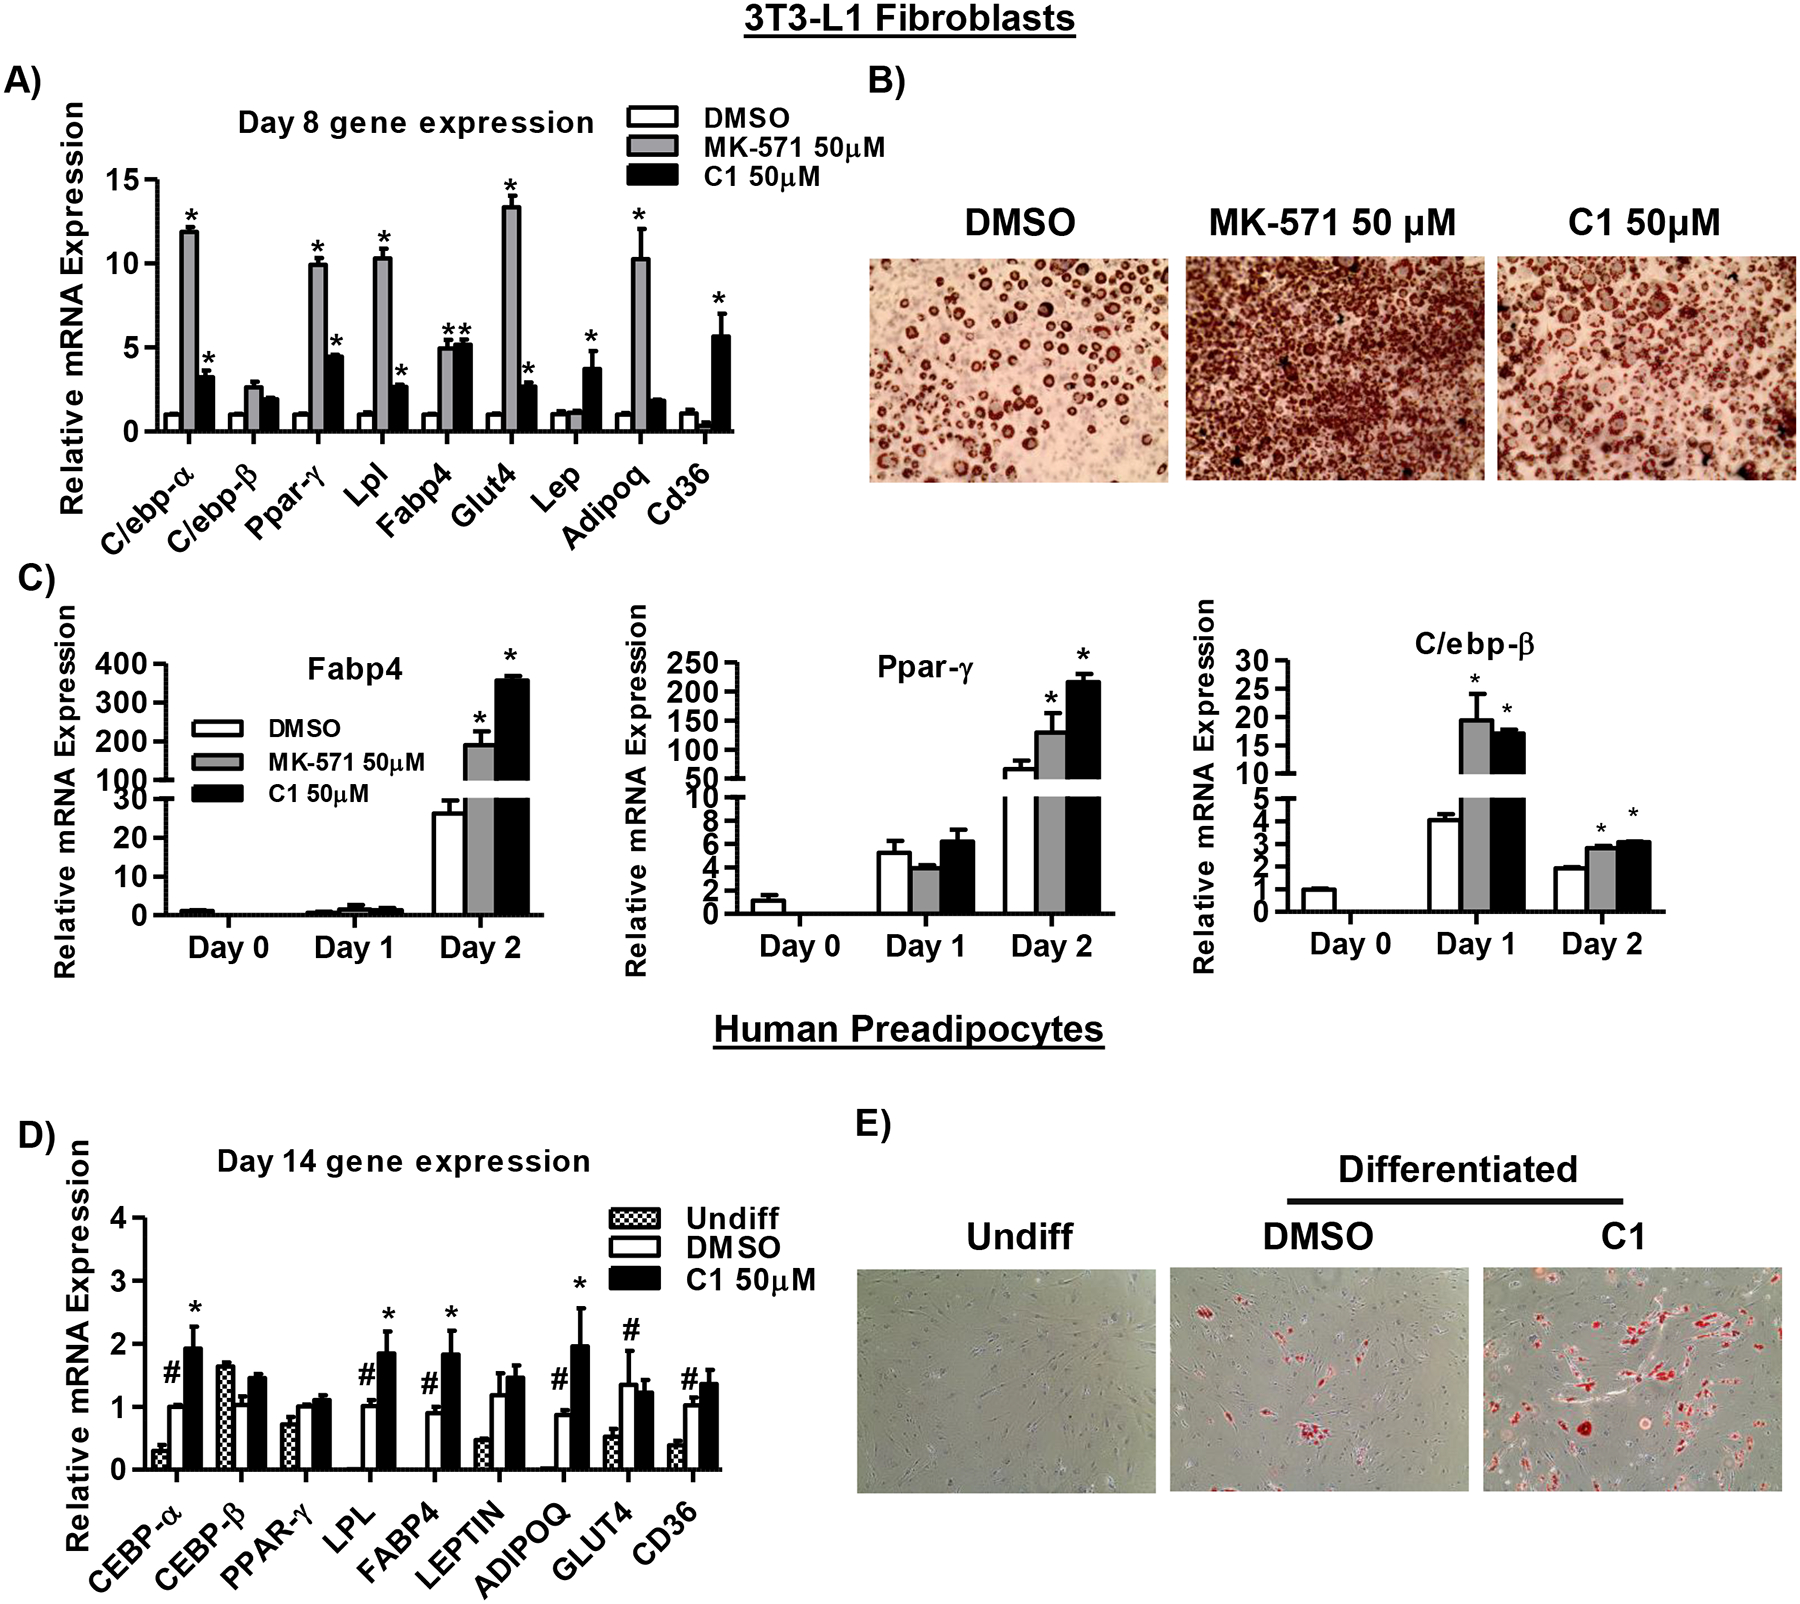
Decreased Mrp4 activity increased adipogenesis in 3T3-L1 fibroblasts and human pre-adipocytes. A) 3T3-L1 cells were treated with either DMSO or Mrp4 inhibitors MK-571 and C1 at 50 μM concentration during the initial three days of differentiation. mRNA levels of adipogenesis marker genes were analyzed using RT-qPCR analysis in differentiated adipocytes (day-8). B) ORO staining of differentiated adipocytes (images taken at 200X magnification) for quantification of adipogenesis in 3T3-L1 cells treated with Mrp4 inhibitor at 50 μM concentration. C) Gene expression analysis of adipogenesis markers such as Fabp4, Pparγ and C/ebpβ expression during the initial phase (day-0, 1 and 2) of differentiation in 3T3-L1 fibroblasts cells treated with Mrp4 inhibitors (50μM). D) Gene expression analysis of adipogenic genes in undifferentiated and differentiated human pre-adipocytes (day-14) treated with either DMSO or C1 (50 μM). E) ORO staining (images taken at 200X magnification) for quantification of adipogenesis in human pre-adipocyte cells (Day-14) treated with either DMSO or C1 (50 μM). Data are presented as mean ± SEM and p≤0.05 was considered as statistically significant. An asterisk “*” denotes significance between DMSO and Mrp4 inhibitors.
Similar studies were carried out using human pre-adipocytes. For inhibition of Mrp4 in human pre-adipocytes we used the C1 compound since MK-571 treatment showed severe toxicity towards these cells. The concentration of C1 (50 μM) selected was determined from the data generated using the 3T3-L1 cells. An increase in the expression of adipogenic genes such as C/EBPα, LPL, FABP4, ADIPOQ, CD36 and GLUT4 was observed in differentiated (DMSO control) cells compared to undifferentiated human pre-adipocytes. Along with these changes in gene expression in differentiated cells, accumulation of fat was also observed, as evidenced by greater ORO staining. Similar to the observations in murine 3T3-L1 cells, pharmacological inhibition of Mrp4 also resulted in increased adipogenesis in human pre-adipocytes (Figure-5D&E). Inhibition of Mrp4 by C1 also increased C/EBPα, LPL, FABP4, and ADIPOQ mRNA levels by 1.9-, 1.8-, 2- and 2.2-fold respectively, compared to DMSO control group.
Transport of cAMP and prostaglandins by Mrp4 plays an important role in the regulation of adipogenesis.
Mrp4 is known to be involved in the efflux of several signaling molecules such as cyclic nucleotides, prostaglandins and bile acids (6). Among these substrates, cAMP and prostaglandins are known to play a major role in the regulation of adipogenesis (35, 36). Inhibition of Mrp4 by both MK-571 and C1 in 3T3-L1 cells increased intracellular cAMP levels (Figure-6A). Along with an increase in cAMP levels, inhibition of Mrp4 increased p-Creb protein levels by 3 hrs in 3T3-L1 cells (Figure-6B). Creb is known to play a key role in adipogenesis by increasing C/ebpβ expression (37). Creb also promotes insulin resistance (38). Interestingly, adipose tissue p-Creb protein levels are also increased in Mrp4−/− mice compared to WT mice (Figure-6C). These increases in p-Creb levels in Mrp4−/− mice are similar to our observations in 3T3-L1 cells, indicating that the lack of Mrp4 in mice activates cAMP-Creb pathway in adipose tissue. Previous studies showed that the lack of Mrp4 alters cAMP and prostaglandin E (PGE) levels in mice and mouse embryonic fibroblasts (28). PGE2, a known metabolite of arachidonic acid, is known to inhibit adipogenesis (35). Lack of Mrp4 decreased plasma PGE metabolite levels in Mrp4−/− mice compared to WT mice (Figure-6D). Similarly, inhibition of Mrp4 by both MK-571 and C1 also decreased extracellular PGE2 levels in 3T3-L1 cells (Figure-6E).
Figure 6. Transport of cAMP and prostaglandins by Mrp4 plays an important role in the regulation of adipogenesis.
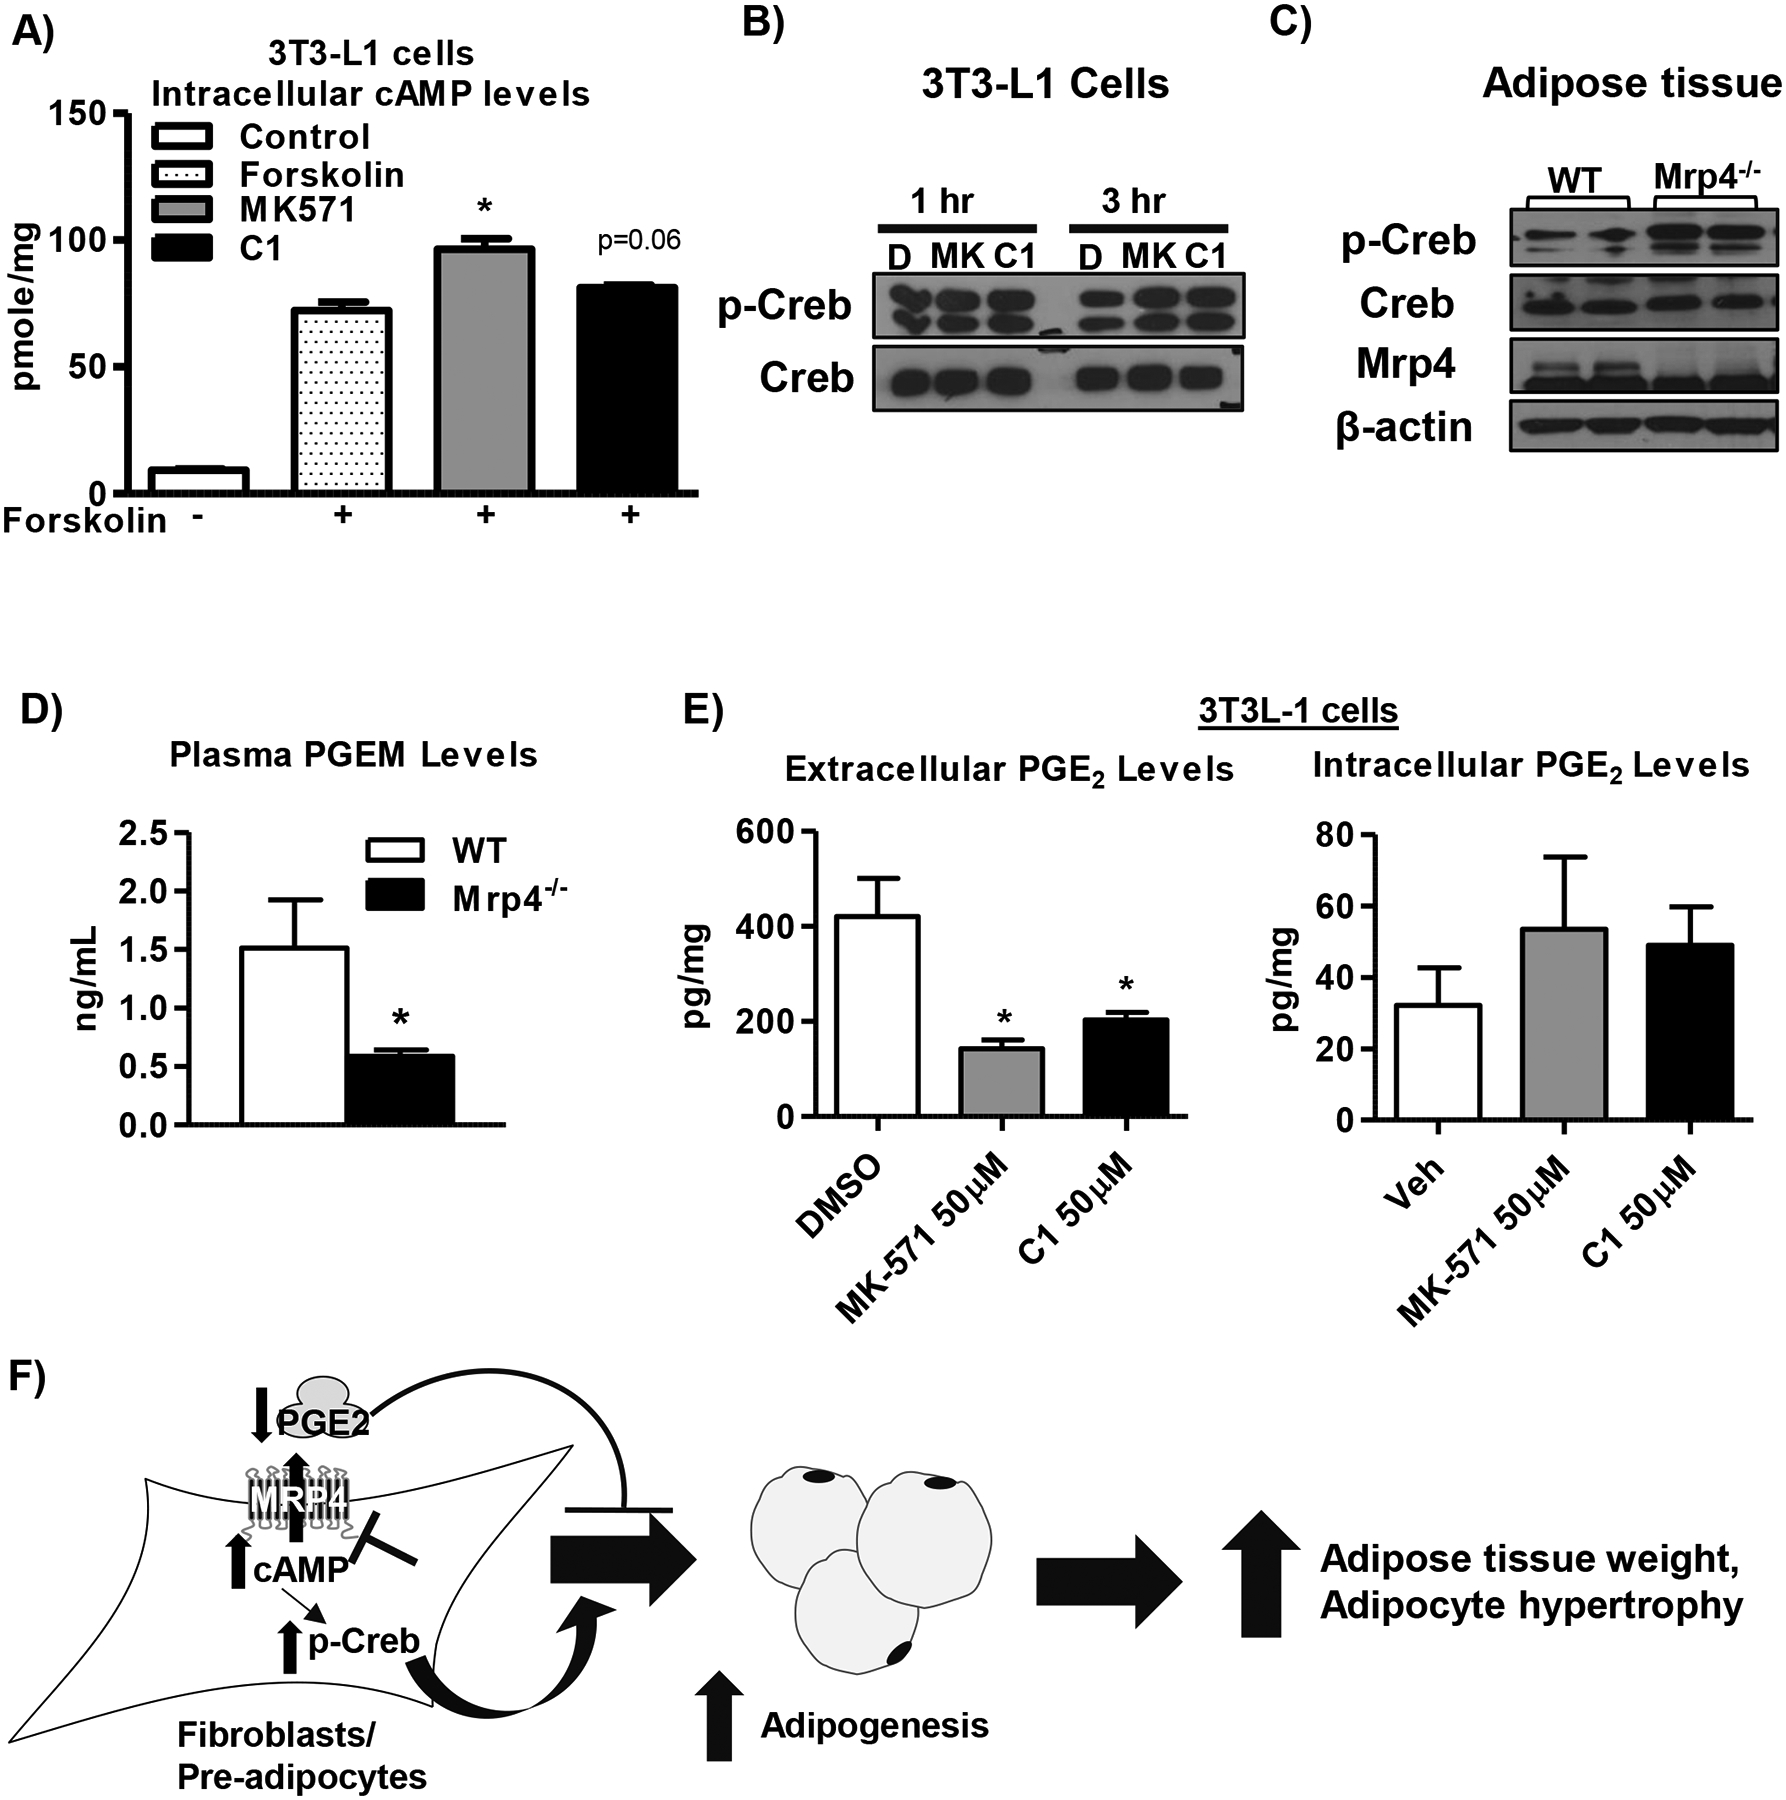
The deficiency of Mrp4 function alters cAMP and PGE levels in intra- and extracellular compartment, respectively. A) Intracellular cAMP levels in 3T3-L1 cells treated with either DMSO or forskolin or Mrp4 inhibitors at 50 μM concertation. B) Western blot analysis of phospo- and total isoform of Creb protein levels in 3T3-L1 cells treated with Mrp4 inhibitors (50 μM) for 1 and 3 hrs in adipogenic differentiation media. C) Adipose tissue phosphor-Creb and total-Creb, and Mrp4 protein expression in male WT and Mrp4−/− mice. D) Plasma PGE metabolite (PGEM) levels in male WT and Mrp4−/− mice. E) Extra- and intracellular PGE2 levels in 3T3-L1 cells treated with either DMSO or Mrp4 inhibitors (50 μM). F) Pictorial representation of molecular mechanisms through which lack of Mrp4 increases the risk of development of metabolic diseases such as obesity and diabetes. Loss of Mrp4 function either through pharmacological inhibition or genetic ablation increases intracellular cAMP levels, which is known to increase Creb activity in the fibroblasts/ pre-adipocytes. These increases in Creb activation results in increased adipogenesis. Lack of Mrp4 also decreases extracellular PGE2 and its metabolite levels. These decreases in PGE will further promote adipogenesis in the fibroblasts/ pre-adipocytes. Data are presented as mean ± SEM and p≤0.05 was considered as statistically significant. An asterisk “*” denotes significance due to lack of Mrp4 function.
Discussion
Adipose tissue plays an important role in the regulation of nutrient metabolism. Increase of adipose tissue weight can be the result of either adipocyte hypertrophy or hyperplasia (39). In mice, lack of Mrp4 function is associated with increased adipose tissue mass and adipocyte hypertrophy. Similar to the observations from the in vivo analyses, loss of Mrp4 function by pharmacological inhibition increases adipogenesis and adipogenic gene expression in fibroblasts and pre-adipocytes. This novel role of Mrp4 in regulating adipogenesis can be a factor in the observed increase in adipose tissue weights and adipocyte hypertrophy in null mice. As reviewed by Ghaben et. Al. (39), newly differentiated adipocytes have a remarkable potential to cause adipocyte hypertrophy and increase adipose tissue mass. Discrepancies in increased adipogenesis extent due to Mrp4 inhibition by MK-571 and C1 compounds can be attributed to MK-571 being a broad spectrum Mrp transporter inhibitor and CysLT1 receptor inhibitor, whereas C1 is more-specific towards Mrp4 (32). Although a strong association between Mrp4 function and adipogenesis has been established here, these pharmacological inhibition data also suggest that other Mrp proteins such as Mrp1 and 5, which are involved in transport of similar substrates as Mrp4 (40), may also play a role in adipogenesis processes. Because of the similarities in increased adipogenesis between Mrp4 null mice and in vitro pharmacological inhibition of Mrp4, our results strongly suggest that Mrp4 has a major role among these drug transporters in the regulation of adipogenesis. The contribution of other members of the Mrp family of transporters in promoting adipogenesis needs to be further studied. Recent studies in mice showed that lack of Mrp5 decreased body and adipose tissue weights (41). These phenotypic changes in Mrp5−/− mice further support that increased adipogenesis observed in our study is specific towards lack of Mrp4 activity.
In Mrp4−/− mice, along with an increase in adipose tissue mass and adipocyte hypertrophy, plasma leptin levels were also increased. Leptin is known to regulate satiety, energy homeostasis, spontaneous physical activity and energy expenditure (30) (42). Interestingly, while Mrp4−/− mice have increased leptin levels, no changes in food intake were detected, and the physical activity and energy expenditure were decreased, indicating these mice may have developed leptin resistance. Additionally, Mrp4−/− mice also showed impaired glucose tolerance and insulin signaling. These phenotypic manifestations are hallmarks of obesity and diabetes. Adipose tissue gene expression analysis in WT and Mrp4−/− mice showed that the lack of Mrp4 in mice leads to altered expression of several genes that are involved in several molecular pathways. Among these, arachidonic acid metabolism is of interest as Mrp4 is known to transport prostaglandin E2, an arachidonic acid metabolite. Lack of Mrp4 increased adipose tissue Pla2g2e expression, a phospholipase involved in arachidonic acid metabolism. Pla2g2e, is one of the two adipocyte-inducible phospholipases during obesity, and lack of Pla2g2e in mice protects against diet-induced obesity (31). The mechanism through which Mrp4 regulates adipose tissue Pla2g2e expression is yet to be studied. An increase in adipose tissue Pla2g2e expression in Mrp4−/− mice suggests that the lack of Mrp4 alters arachidonic acid metabolism and promotes adipogenesis.
The present study provides substantial evidence indicating that the ability of Mrp4 to transport of cAMP and PGE2 plays a role in adipogenesis and increased adipose tissue mass. Altered cAMP and PGE2 levels in both our in vitro and in vivo models are in line with previously published observations by Lin et al. (28). Firstly, inhibition of Mrp4 function increased intracellular cAMP levels, as observed in the fibroblast cells. Increases in intracellular cAMP levels are known to activate its downstream signaling molecule Creb via phosphorylation at serine-133 position (43). In both in vivo and in vitro studies, deficiency of Mrp4 function increased phospho-Creb protein levels and Creb is known to play an important role in promoting adipogenesis by upregulating C/ebpβ (37, 44, 45). Similarly, we also observed increases in expression levels of C/ebpβ in mouse fibroblasts after just one day of treatment with Mrp4 inhibitors. This induction is accompanied by increased expression of p-Creb, the activated form of Creb. Creb is also known to induce insulin resistance in adipose tissue and increases the pathogenesis of obesity (38). In our study, we observed that the lack of Mrp4 in mice increases adipose tissue Creb activation and impaired glucose tolerance without altering insulin levels. These observations indicate that increased adipose tissue phospho-Creb protein levels may have an important role in the development of the observed metabolic phenotype in Mrp4−/− mice. Secondly, prostaglandins E metabolite transport by Mrp4 also plays an important role in Mrp4-induced adipogenesis. PGE2 is a known substrate of Mrp4 (6, 28); and is known to inhibit adipogenesis (35, 46). Interestingly, extracellular PGE2 levels decrease in the 3T3L1 fibroblasts cells within a few hours after treatment with an adipogenic differentiating cocktail (47). PGE2 is also known to downregulate Pparγ expression, a master regulator of adipogenesis, in pre-adipocytes (47). These anti-adipogenic effects of PGE2 are facilitated through activation of their cell surface receptors EP3 and 4 (35, 46, 47). Inhibition of Mrp4 function decreases PGE2 and its metabolite levels in the extracellular space, resulting in decreased activation of EP3 and 4 receptors, which eventually promotes adipogenesis in fibroblasts and pre-adipocytes. Taken together, altered cAMP and PGE metabolite levels promotes increases in adipose tissue weight and the development of obesity and a diabetic phenotype in Mrp4−/− mice.
In summary, Mrp4 plays an important role in the regulation of adipogenesis and adipose tissue physiology by altering cAMP and PGE2 levels. Lack of Mrp4 function increases intracellular cAMP and decreases extracellular PGE levels, which may together promote adipogenesis and results in the development of the metabolic disease phenotype observed in Mrp4−/− mice (Figure-6F). Our findings indicate that Mrp4 is a novel genetic factor in the pathogenesis of metabolic diseases such as obesity and diabetes.
Supplementary Material
Acknowledgments:
We would like to acknowledge Dr. Brian Aneskievich and his graduate student Rambon Shamilov for providing 3T3-L1 cells. This study was funded by UConn Research Excellence Program 2018 (J.E.M.). This study was also supported by P30 CA021765 Cancer Center Support grant, 5R01CA194206, and ALSAC (J.D.S).
The authors appreciate qPCR thermocycler access made possible through the Roger Stoll Pharmaceutical Sciences Fund.
Non-standard abbreviations
- Abc
ATP binding cassette
- Adipoq
adiponectin
- C1
Ceefourin-1
- C/ebp
CCAAT/enhancer-binding proteins
- cAMP
cyclic adenosine monophosphate
- cGMP
cyclic guanine monophosphate
- DEGs
differentially expressed genes
- EE
energy expenditure
- Fat/Cd36
fatty acid translocase
- Fabp4
fatty acid-binding protein 4
- Glut4
glucose transporter type 4
- GLP-1
glucagon like peptide-1
- GTT
glucose tolerance test
- ITT
insulin tolerance test
- Lep
leptin
- Lpl
lipoprotein lipase
- Mrp
multidrug resistance-associated protein
- NAFLD
non-alcoholic fatty liver disease
- Pparγ
peroxisome proliferator-activated receptor gamma
- PGE2
prostaglandin
- Ptgs2
prostaglandin-endoperoxide synthase 2
- Pla2g2e
phospholipase A2 group 2e
- Pla2g5
phospholipase A2 group 5
- RER
respiratory exchange ratio
- TBS
Tris-buffered saline
- TBS/T
Tris-buffered saline with Tween 20
- VCO2
volumetric carbon dioxide
- VO2
volumetric oxygen
Reference
- 1.https://www.cdc.gov/diabetes/data/index.html. Vol. 2017. p. CDC Prevalence of Diabetes
- 2.https://www.cdc.gov/obesity/data/adult.html. Vol. 2017. p. CDC Obesity prevalence statistics
- 3.Bhupathiraju SN, and Hu FB (2016) Epidemiology of Obesity and Diabetes and Their Cardiovascular Complications. Circulation research 118, 1723–1735 [DOI] [PMC free article] [PubMed] [Google Scholar]
- 4.Ortega FB, Lavie CJ, and Blair SN (2016) Obesity and Cardiovascular Disease. Circulation research 118, 1752–1770 [DOI] [PubMed] [Google Scholar]
- 5.Casanueva FF, Moreno B, Rodriguez-Azeredo R, Massien C, Conthe P, Formiguera X, Barrios V, and Balkau B (2010) Relationship of abdominal obesity with cardiovascular disease, diabetes and hyperlipidaemia in Spain. Clinical endocrinology 73, 35–40 [DOI] [PubMed] [Google Scholar]
- 6.Russel FG, Koenderink JB, and Masereeuw R (2008) Multidrug resistance protein 4 (MRP4/ABCC4): a versatile efflux transporter for drugs and signalling molecules. Trends in pharmacological sciences 29, 200–207 [DOI] [PubMed] [Google Scholar]
- 7.Maher JM, Slitt AL, Cherrington NJ, Cheng X, and Klaassen CD (2005) Tissue distribution and hepatic and renal ontogeny of the multidrug resistance-associated protein (Mrp) family in mice. Drug metabolism and disposition: the biological fate of chemicals 33, 947–955 [DOI] [PubMed] [Google Scholar]
- 8.Tanaka Y, Manabe A, Fukushima H, Suzuki R, Nakadate H, Kondoh K, Nakamura K, Koh K, Fukushima T, Tsuchida M, Koike K, Kiyokawa N, Noguchi E, Sumazaki R, and Komiyama T (2015) Multidrug resistance protein 4 (MRP4) polymorphisms impact the 6-mercaptopurine dose tolerance during maintenance therapy in Japanese childhood acute lymphoblastic leukemia. The pharmacogenomics journal 15, 380–384 [DOI] [PubMed] [Google Scholar]
- 9.Pezzolesi MG, Skupien J, Mychaleckyj JC, Warram JH, and Krolewski AS (2010) Insights to the genetics of diabetic nephropathy through a genome-wide association study of the GoKinD collection. Seminars in nephrology 30, 126–140 [DOI] [PMC free article] [PubMed] [Google Scholar]
- 10.Li C, Krishnamurthy PC, Penmatsa H, Marrs KL, Wang XQ, Zaccolo M, Jalink K, Li M, Nelson DJ, Schuetz JD, and Naren AP (2007) Spatiotemporal coupling of cAMP transporter to CFTR chloride channel function in the gut epithelia. Cell 131, 940–951 [DOI] [PMC free article] [PubMed] [Google Scholar]
- 11.Cheepala SB, Pitre A, Fukuda Y, Takenaka K, Zhang Y, Wang Y, Frase S, Pestina T, Gartner TK, Jackson C, and Schuetz JD (2015) The ABCC4 membrane transporter modulates platelet aggregation. Blood 126, 2307–2319 [DOI] [PMC free article] [PubMed] [Google Scholar]
- 12.Hara Y, Sassi Y, Guibert C, Gambaryan N, Dorfmuller P, Eddahibi S, Lompre AM, Humbert M, and Hulot JS (2011) Inhibition of MRP4 prevents and reverses pulmonary hypertension in mice. The Journal of clinical investigation 121, 2888–2897 [DOI] [PMC free article] [PubMed] [Google Scholar]
- 13.Mennone A, Soroka CJ, Cai SY, Harry K, Adachi M, Hagey L, Schuetz JD, and Boyer JL (2006) Mrp4−/− mice have an impaired cytoprotective response in obstructive cholestasis. Hepatology 43, 1013–1021 [DOI] [PubMed] [Google Scholar]
- 14.Donepudi AC, Cheng Q, Lu ZJ, Cherrington NJ, and Slitt AL (2016) Hepatic Transporter Expression in Metabolic Syndrome: Phenotype, Serum Metabolic Hormones, and Transcription Factor Expression. Drug metabolism and disposition: the biological fate of chemicals 44, 518–526 [DOI] [PMC free article] [PubMed] [Google Scholar]
- 15.More VR, and Slitt AL (2011) Alteration of hepatic but not renal transporter expression in diet-induced obese mice. Drug metabolism and disposition: the biological fate of chemicals 39, 992–999 [DOI] [PMC free article] [PubMed] [Google Scholar]
- 16.Cheng Q, Aleksunes LM, Manautou JE, Cherrington NJ, Scheffer GL, Yamasaki H, and Slitt AL (2008) Drug-metabolizing enzyme and transporter expression in a mouse model of diabetes and obesity. Molecular pharmaceutics 5, 77–91 [DOI] [PubMed] [Google Scholar]
- 17.Yacovino LL, and Aleksunes LM (2012) Renal efflux transporter expression in pregnant mice with Type I diabetes. Toxicology letters 211, 304–311 [DOI] [PMC free article] [PubMed] [Google Scholar]
- 18.Donepudi AC, Smith GJ, Aladelokun O, Lee Y, Toro SJ, Pfohl M, Slitt AL, Wang L, Lee JY, Schuetz JD, and Manautou JE (2020) Lack of Multidrug Resistance-associated Protein 4 Prolongs Partial Hepatectomy-induced Hepatic Steatosis. Toxicol Sci 175, 301–311 [DOI] [PMC free article] [PubMed] [Google Scholar]
- 19.Leggas M, Adachi M, Scheffer GL, Sun D, Wielinga P, Du G, Mercer KE, Zhuang Y, Panetta JC, Johnston B, Scheper RJ, Stewart CF, and Schuetz JD (2004) Mrp4 confers resistance to topotecan and protects the brain from chemotherapy. Molecular and cellular biology 24, 7612–7621 [DOI] [PMC free article] [PubMed] [Google Scholar]
- 20.Donepudi AC, Goedken MJ, Schuetz JD, and J EM (2019) Lack of multidrug resistance-associated protein 4 (Mrp4) alters the kinetics of acetaminophen toxicity. Toxicol Rep 6, 841–849 [DOI] [PMC free article] [PubMed] [Google Scholar]
- 21.Donepudi AC, Ferrell JM, Boehme S, Choi HS, and Chiang JYL (2018) Deficiency of cholesterol 7alpha-hydroxylase in bile acid synthesis exacerbates alcohol-induced liver injury in mice. Hepatol Commun 2, 99–112 [DOI] [PMC free article] [PubMed] [Google Scholar]
- 22.Xu J, Donepudi AC, More VR, Kulkarni SR, Li L, Guo L, Yan B, Chatterjee T, Weintraub N, and Slitt AL (2015) Deficiency in Nrf2 transcription factor decreases adipose tissue mass and hepatic lipid accumulation in leptin-deficient mice. Obesity 23, 335–344 [DOI] [PMC free article] [PubMed] [Google Scholar]
- 23.Xu J, Kulkarni SR, Donepudi AC, More VR, and Slitt AL (2012) Enhanced Nrf2 activity worsens insulin resistance, impairs lipid accumulation in adipose tissue, and increases hepatic steatosis in leptin-deficient mice. Diabetes 61, 3208–3218 [DOI] [PMC free article] [PubMed] [Google Scholar]
- 24.Wang L, Feng Z, Wang X, Wang X, and Zhang X (2010) DEGseq: an R package for identifying differentially expressed genes from RNA-seq data. Bioinformatics 26, 136–138 [DOI] [PubMed] [Google Scholar]
- 25.Donepudi AC, Aleksunes LM, Driscoll MV, Seeram NP, and Slitt AL (2012) The traditional ayurvedic medicine, Eugenia jambolana (Jamun fruit), decreases liver inflammation, injury and fibrosis during cholestasis. Liver international : official journal of the International Association for the Study of the Liver 32, 560–573 [DOI] [PMC free article] [PubMed] [Google Scholar]
- 26.Xu J, Shimpi P, Armstrong L, Salter D, and Slitt AL (2016) PFOS induces adipogenesis and glucose uptake in association with activation of Nrf2 signaling pathway. Toxicology and applied pharmacology 290, 21–30 [DOI] [PMC free article] [PubMed] [Google Scholar]
- 27.Lee MJ, and Fried SK (2014) Optimal protocol for the differentiation and metabolic analysis of human adipose stromal cells. Methods in enzymology 538, 49–65 [DOI] [PMC free article] [PubMed] [Google Scholar]
- 28.Lin ZP, Zhu YL, Johnson DR, Rice KP, Nottoli T, Hains BC, McGrath J, Waxman SG, and Sartorelli AC (2008) Disruption of cAMP and prostaglandin E2 transport by multidrug resistance protein 4 deficiency alters cAMP-mediated signaling and nociceptive response. Mol Pharmacol 73, 243–251 [DOI] [PMC free article] [PubMed] [Google Scholar]
- 29.Donepudi AC, Boehme S, Li F, and Chiang JY (2017) G-protein-coupled bile acid receptor plays a key role in bile acid metabolism and fasting-induced hepatic steatosis in mice. Hepatology 65, 813–827 [DOI] [PMC free article] [PubMed] [Google Scholar]
- 30.Park HK, and Ahima RS (2015) Physiology of leptin: energy homeostasis, neuroendocrine function and metabolism. Metabolism 64, 24–34 [DOI] [PMC free article] [PubMed] [Google Scholar]
- 31.Sato H, Taketomi Y, Ushida A, Isogai Y, Kojima T, Hirabayashi T, Miki Y, Yamamoto K, Nishito Y, Kobayashi T, Ikeda K, Taguchi R, Hara S, Ida S, Miyamoto Y, Watanabe M, Baba H, Miyata K, Oike Y, Gelb MH, and Murakami M (2014) The adipocyte-inducible secreted phospholipases PLA2G5 and PLA2G2E play distinct roles in obesity. Cell metabolism 20, 119–132 [DOI] [PMC free article] [PubMed] [Google Scholar]
- 32.Cheung L, Flemming CL, Watt F, Masada N, Yu DM, Huynh T, Conseil G, Tivnan A, Polinsky A, Gudkov AV, Munoz MA, Vishvanath A, Cooper DM, Henderson MJ, Cole SP, Fletcher JI, Haber M, and Norris MD (2014) High-throughput screening identifies Ceefourin 1 and Ceefourin 2 as highly selective inhibitors of multidrug resistance protein 4 (MRP4). Biochemical pharmacology 91, 97–108 [DOI] [PubMed] [Google Scholar]
- 33.Tontonoz P, Graves RA, Budavari AI, Erdjument-Bromage H, Lui M, Hu E, Tempst P, and Spiegelman BM (1994) Adipocyte-specific transcription factor ARF6 is a heterodimeric complex of two nuclear hormone receptors, PPAR gamma and RXR alpha. Nucleic Acids Res 22, 5628–5634 [DOI] [PMC free article] [PubMed] [Google Scholar]
- 34.Guo L, Li X, and Tang QQ (2015) Transcriptional regulation of adipocyte differentiation: a central role for CCAAT/enhancer-binding protein (C/EBP) beta. The Journal of biological chemistry 290, 755–761 [DOI] [PMC free article] [PubMed] [Google Scholar]
- 35.Fujimori K (2012) Prostaglandins as PPARgamma Modulators in Adipogenesis. PPAR Res 2012, 527607. [DOI] [PMC free article] [PubMed] [Google Scholar]
- 36.Petersen RK, Madsen L, Pedersen LM, Hallenborg P, Hagland H, Viste K, Doskeland SO, and Kristiansen K (2008) Cyclic AMP (cAMP)-mediated stimulation of adipocyte differentiation requires the synergistic action of Epac- and cAMP-dependent protein kinase-dependent processes. Molecular and cellular biology 28, 3804–3816 [DOI] [PMC free article] [PubMed] [Google Scholar]
- 37.Zhang JW, Klemm DJ, Vinson C, and Lane MD (2004) Role of CREB in transcriptional regulation of CCAAT/enhancer-binding protein beta gene during adipogenesis. The Journal of biological chemistry 279, 4471–4478 [DOI] [PubMed] [Google Scholar]
- 38.Qi L, Saberi M, Zmuda E, Wang Y, Altarejos J, Zhang X, Dentin R, Hedrick S, Bandyopadhyay G, Hai T, Olefsky J, and Montminy M (2009) Adipocyte CREB promotes insulin resistance in obesity. Cell metabolism 9, 277–286 [DOI] [PMC free article] [PubMed] [Google Scholar]
- 39.Ghaben AL, and Scherer PE (2019) Adipogenesis and metabolic health. Nature reviews. Molecular cell biology 20, 242–258 [DOI] [PubMed] [Google Scholar]
- 40.Klaassen CD, and Aleksunes LM (2010) Xenobiotic, bile acid, and cholesterol transporters: function and regulation. Pharmacological reviews 62, 1–96 [DOI] [PMC free article] [PubMed] [Google Scholar]
- 41.Cyranka M, Veprik A, McKay EJ, van Loon N, Thijsse A, Cotter L, Hare N, Saibudeen A, Lingam S, Pires E, Larraufie P, Reimann F, Gribble F, Stewart M, Bentley E, Lear P, McCullagh J, Cantley J, Cox RD, and de Wet H (2019) Abcc5 Knockout Mice Have Lower Fat Mass and Increased Levels of Circulating GLP-1. Obesity 27, 1292–1304 [DOI] [PMC free article] [PubMed] [Google Scholar]
- 42.Morton GJ, Kaiyala KJ, Fisher JD, Ogimoto K, Schwartz MW, and Wisse BE (2011) Identification of a physiological role for leptin in the regulation of ambulatory activity and wheel running in mice. Am J Physiol Endocrinol Metab 300, E392–401 [DOI] [PMC free article] [PubMed] [Google Scholar]
- 43.Delghandi MP, Johannessen M, and Moens U (2005) The cAMP signalling pathway activates CREB through PKA, p38 and MSK1 in NIH 3T3 cells. Cell Signal 17, 1343–1351 [DOI] [PubMed] [Google Scholar]
- 44.Reusch JE, Colton LA, and Klemm DJ (2000) CREB activation induces adipogenesis in 3T3-L1 cells. Molecular and cellular biology 20, 1008–1020 [DOI] [PMC free article] [PubMed] [Google Scholar]
- 45.Reusch JE, and Klemm DJ (2002) Inhibition of cAMP-response element-binding protein activity decreases protein kinase B/Akt expression in 3T3-L1 adipocytes and induces apoptosis. The Journal of biological chemistry 277, 1426–1432 [DOI] [PubMed] [Google Scholar]
- 46.Xu H, Fu JL, Miao YF, Wang CJ, Han QF, Li S, Huang SZ, Du SN, Qiu YX, Yang JC, Gustafsson JA, Breyer RM, Zheng F, Wang NP, Zhang XY, and Guan YF (2016) Prostaglandin E2 receptor EP3 regulates both adipogenesis and lipolysis in mouse white adipose tissue. J Mol Cell Biol 8, 518–529 [DOI] [PMC free article] [PubMed] [Google Scholar]
- 47.Fujimori K, Yano M, and Ueno T (2012) Synergistic suppression of early phase of adipogenesis by microsomal PGE synthase-1 (PTGES1)-produced PGE2 and aldo-keto reductase 1B3-produced PGF2alpha. PloS one 7, e44698. [DOI] [PMC free article] [PubMed] [Google Scholar]
Associated Data
This section collects any data citations, data availability statements, or supplementary materials included in this article.