

Abstract
Dietary interventions can change metabolite levels in the tumor microenvironment, which may then affect cancer cell metabolism to alter tumor growth1–5. Although caloric restriction (CR) and the ketogenic diet (KD) are often thought to limit tumor progression by lowering blood glucose and insulin levels6–8, we find only CR inhibits the growth of select tumor allografts in mice, suggesting that other mechanisms contribute to tumor growth inhibition. A change in nutrient availability observed with CR, but not the KD, is lower lipid levels in the plasma and tumors. Up-regulation of stearoyl-CoA desaturase (SCD), which synthesizes monounsaturated fatty acids, is required for cancer cells to proliferate in a lipid-depleted environment, and CR also impairs tumor SCD activity to cause an imbalance between unsaturated and saturated fatty acids to slow tumor growth. Enforcing cancer cell SCD expression or raising circulating lipid levels through a higher fat CR diet confers resistance to the effects of CR. In contrast, although the KD also impairs tumor SCD activity, KD-driven increases in lipid availability maintain the unsaturated to saturated fatty acid ratios in tumors, and changing the KD fat composition to increase tumor saturated fatty acid levels cooperates with decreased tumor SCD activity to slow tumor growth. These data suggest that diet-induced mismatches between tumor fatty acid desaturation activity and the availability of specific fatty acid species determine whether low glycemic diets impair tumor growth.
Low glycemic diets are often presumed to inhibit tumor growth by lowering blood glucose and insulin levels6–8, but whether changes in other nutrients also contribute is less understood. C57BL/6J mice bearing subcutaneous tumors formed from AL1376 pancreatic ductal adenocarcinoma (PDAC) cells derived from the LSL-Kras(G12D);Trp53fl/fl;Pdx1-Cre mouse model9 were exposed to a control diet, CR, or a KD (Extended Data Table 1). Interestingly, only CR inhibits tumor growth in this model (Fig. 1a–d, Extended Data Fig. 1a–h). Although CR mice consume 40% less calories (Extended Data Fig. 2a–b) and have reduced body weights (Extended Data Fig. 2c), tumor growth is still inhibited even when normalized to animal body weights (Extended Data Fig. 1a–b). CR tumors exhibit reduced Ki67 positivity and unchanged cleaved caspase 3 positivity (Extended Data Fig. 2d–e), consistent with CR slowing tumor growth and not causing tumor regression (Fig. 1a). In contrast, mice fed the KD are not calorically restricted (Extended Data Fig. 2j–k) and maintain body weights (Extended Data Fig. 2l). Tumor growth in this model is unaffected by the KD even when normalized to animal body weights (Extended Data Fig. 1c–d), and Ki67 and cleaved caspase 3 staining in tumors are unaffected by the KD (Extended Data Fig. 2m–n). CR and the KD have the same effects in both male (Fig. 1a–d) and female (Extended Data Fig. 1e–h) mice, and also similarly affect subcutaneous tumors formed from LGSP non-small cell lung cancer cells derived from the LSL-Kras(G12D);Trp53fl/fl;Ad-Cre mouse model10 (Extended Data Fig. 1i–p). These data demonstrate in two cancer models involving different tissues that CR, but not a KD, inhibits tumor growth.
Figure 1. Caloric restriction, but not the ketogenic diet, impairs growth of PDAC allograft tumors.
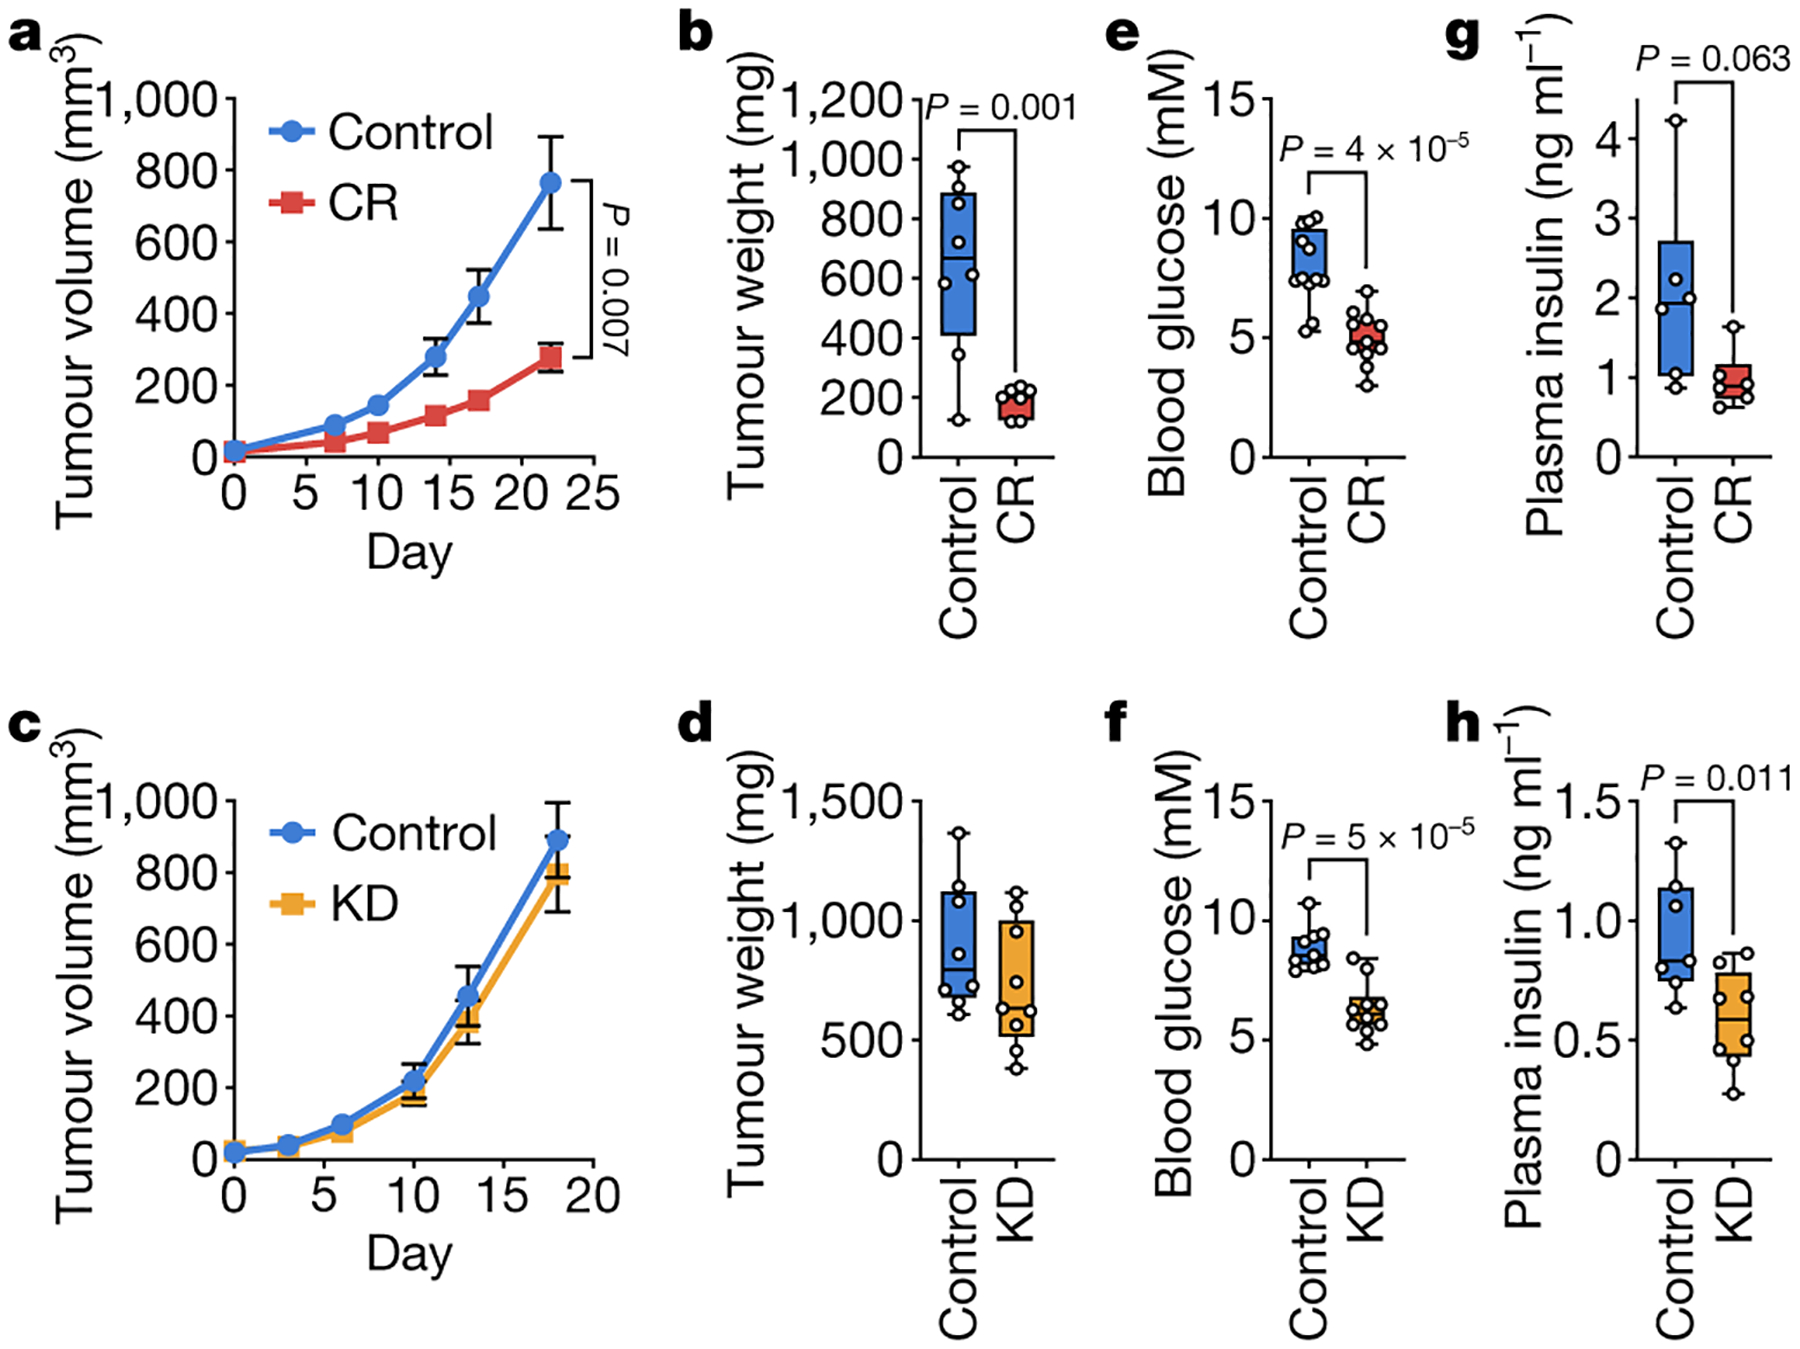
a-d, Tumor volumes (a,c) and endpoint tumor weights (b,d) of subcutaneous AL1376 PDAC allografts in male mice exposed to (a,b) CR or a control diet, or (c,d) the KD or a control diet. (a,b) Control n = 5 mice, CR n = 4 mice; (c,d) Control n = 5 mice, KD n = 5 mice. e-h, Effects of control diets, CR, or the KD on (e,f) blood glucose levels or (g,h) fasting plasma insulin levels. (e) Control n = 12, CR n = 11; (f) Control n = 9, KD n = 10; (g) Control n = 6, CR n = 6; (h) Control n = 7, KD n = 8. Data are presented as mean ± SEM (a,c) or as box-and-whisker plots displaying median, interquartile range (boxes), and minima and maxima (whiskers) (b,d,e-h). Comparisons were made using two-way repeated measures analysis of variance (ANOVA) (a,c) or a two-tailed Student’s t-test (b,d,e-h).
Both diets induce similar decreases in blood glucose levels (Fig. 1e–f). Moreover, only the KD significantly reduces fasting plasma insulin levels, although CR results in a trend toward decreased levels (Fig. 1g–h). Therefore, the effects of CR on tumor growth may not be fully explained by reduced blood glucose and insulin. Previous studies have examined how these diets affect other hormone signaling pathways11, and we also find that CR and the KD have distinct effects on circulating glucagon, FGF21, and corticosterone (Extended Data Fig. 2g–i, p–r). However, since dietary perturbations induce changes in the systemic availability of many metabolites1, these two diets may also affect the availability of metabolites other than glucose to impair tumor growth in mice exposed to CR.
We measured metabolite levels in plasma and tumor interstitial fluid (TIF) from tumor-bearing mice fed a control diet, CR, or the KD. Notably, despite lowering blood glucose levels, the KD does not lower TIF glucose levels, whereas CR decreases TIF glucose from ~1.6 mM to ~0.8 mM (Fig. 2a–b). Why CR has a stronger effect on TIF glucose levels is unclear, and effects on tumor vascularization12 or tumor cell glucose uptake may contribute. The effects of CR on TIF glucose may contribute in part to tumor growth inhibition, but since reducing glucose to 0.8 mM has minimal effect on cell proliferation (Fig. 2c), we considered whether changes in the availability of other nutrients may also contribute to the effects of CR.
Figure 2. Caloric restriction and the ketogenic diet differentially alter nutrient levels in the plasma and tumor interstitial fluid.
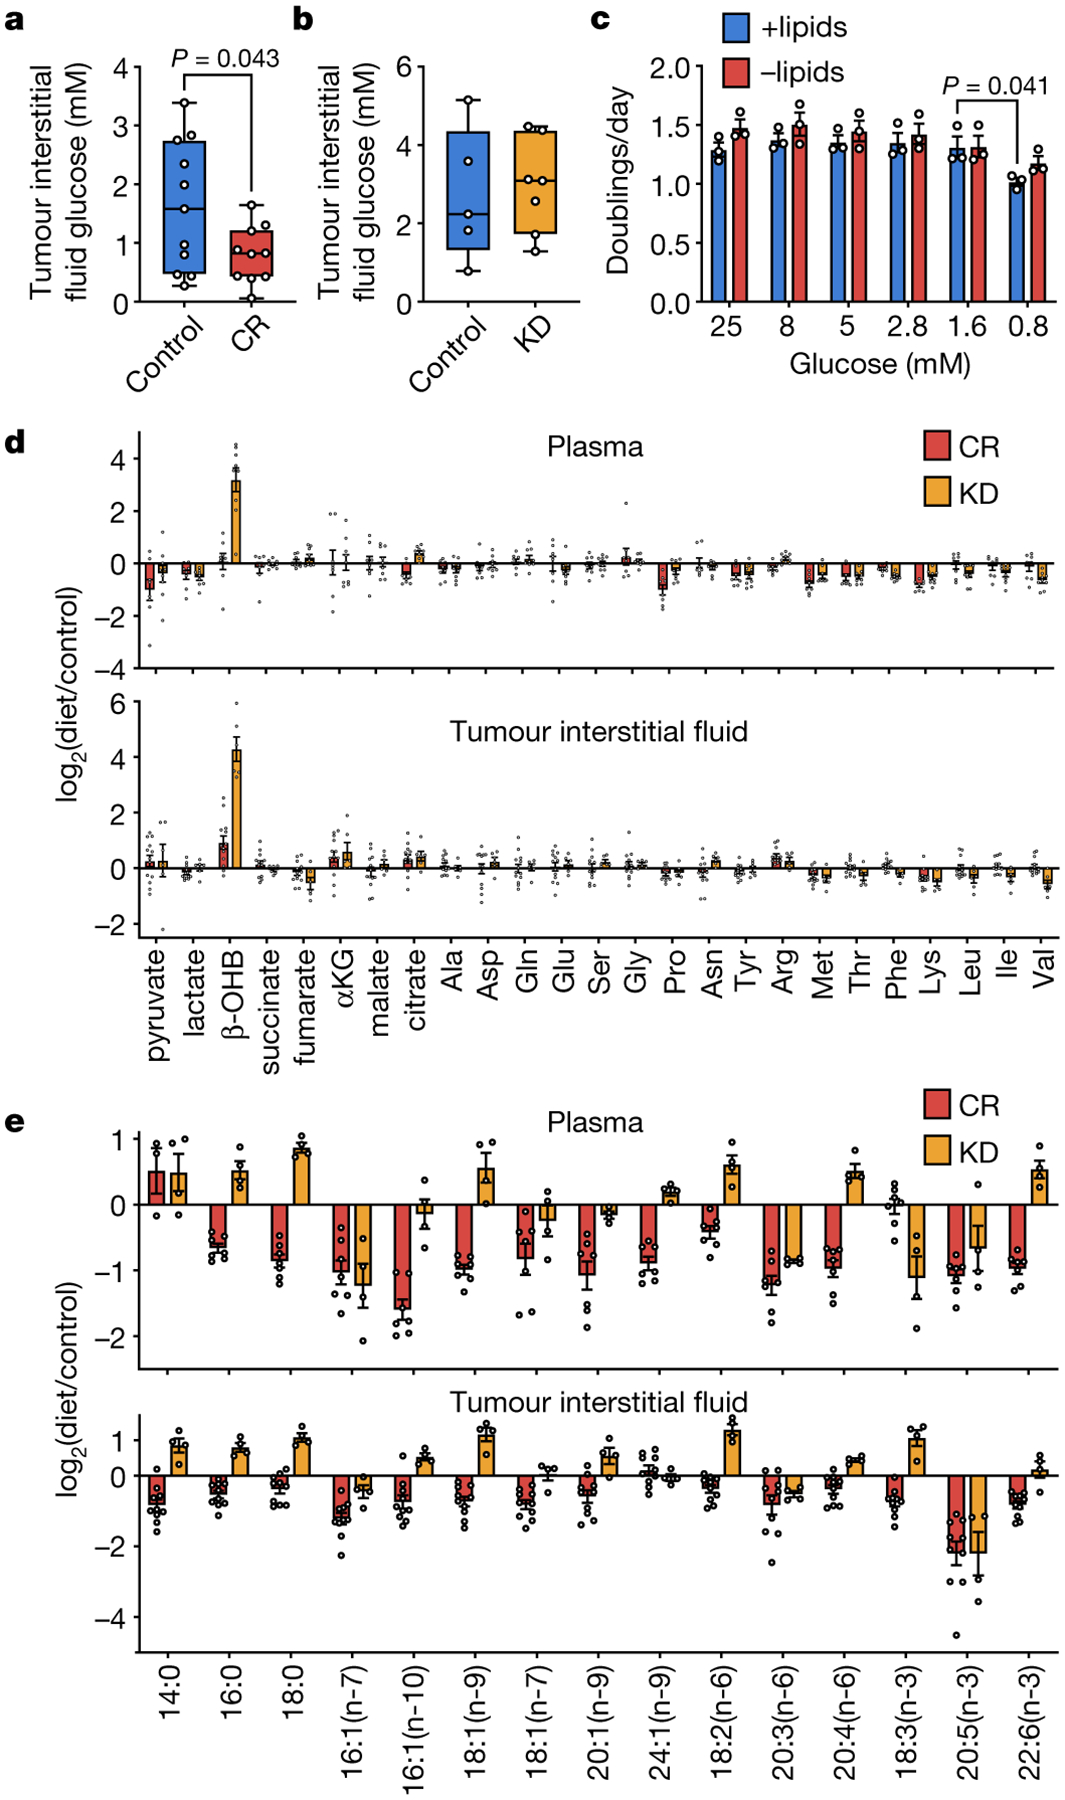
a, b, Glucose concentration in tumor interstitial fluid from subcutaneous AL1376 tumors in mice exposed to (a) CR or a control diet, or (b) the KD or a control diet. (a) Control n = 11, CR n = 10; (b) Control n = 5, KD n = 7. c, Doubling times of AL1376 cells cultured in lipidated versus de-lipidated media containing the indicated glucose concentrations. n = 3 biologically independent replicates per group. d, Fold change in specified metabolite levels induced by CR or the KD relative to the control diet measured in the plasma (upper) or tumor interstitial fluid (lower). Plasma: CR n = 8, KD n = 9; Tumor interstitial fluid: CR n = 13, KD n = 6. e, Fold changes in specified fatty acid levels induced by CR or the KD relative to the control diet measured in the plasma (upper) or tumor interstitial fluid (lower). Plasma: CR n = 7, KD n = 4; Tumor interstitial fluid: CR n = 10, KD n = 4. Data are presented as box-and-whisker plots displaying median, interquartile range (boxes), and minima and maxima (whiskers) (a-b) or as mean ± SEM (c-e). Comparisons were made using a two-tailed Student’s t-test (a-c).
CR and the KD have minor effects on levels of many metabolites (Fig. 2d). Most notably, the KD more effectively raises levels of the “ketone” β-hydroxybutyrate (β-OHB) (Fig. 2d, Extended Data Fig. 3a). Impairing ketone metabolism in some cancer cells can sensitize tumors to a KD13, and consistently, while β-OHB supplementation does not affect AL1376 cell proliferation (Extended Data Fig. 3b), these cells incorporate β-OHB into the TCA cycle (Extended Data Fig. 3c) and palmitate (Extended Data Fig. 3d). β-OHB exposure also alters the fatty acid composition of these cells (Extended Data Fig. 3e–f). Increased ketone levels may therefore contribute to why the KD does not inhibit tumor growth in this model.
We next found a striking difference in the effects of CR and the KD on fatty acid levels. While many fatty acids in plasma and TIF are increased by the KD, levels of almost all fatty acids are reduced by CR (Fig. 2e). These observations are consistent with CR mice maintaining muscle mass but losing white adipose tissue (Extended Data Fig. 2f), while mice fed the KD maintain both muscle and white adipose tissue mass (Extended Data Fig. 2o). Therefore, decreased tumor availability of lipids and fatty acids is specific to CR, and environmental lipid limitation could contribute to how CR inhibits tumor growth.
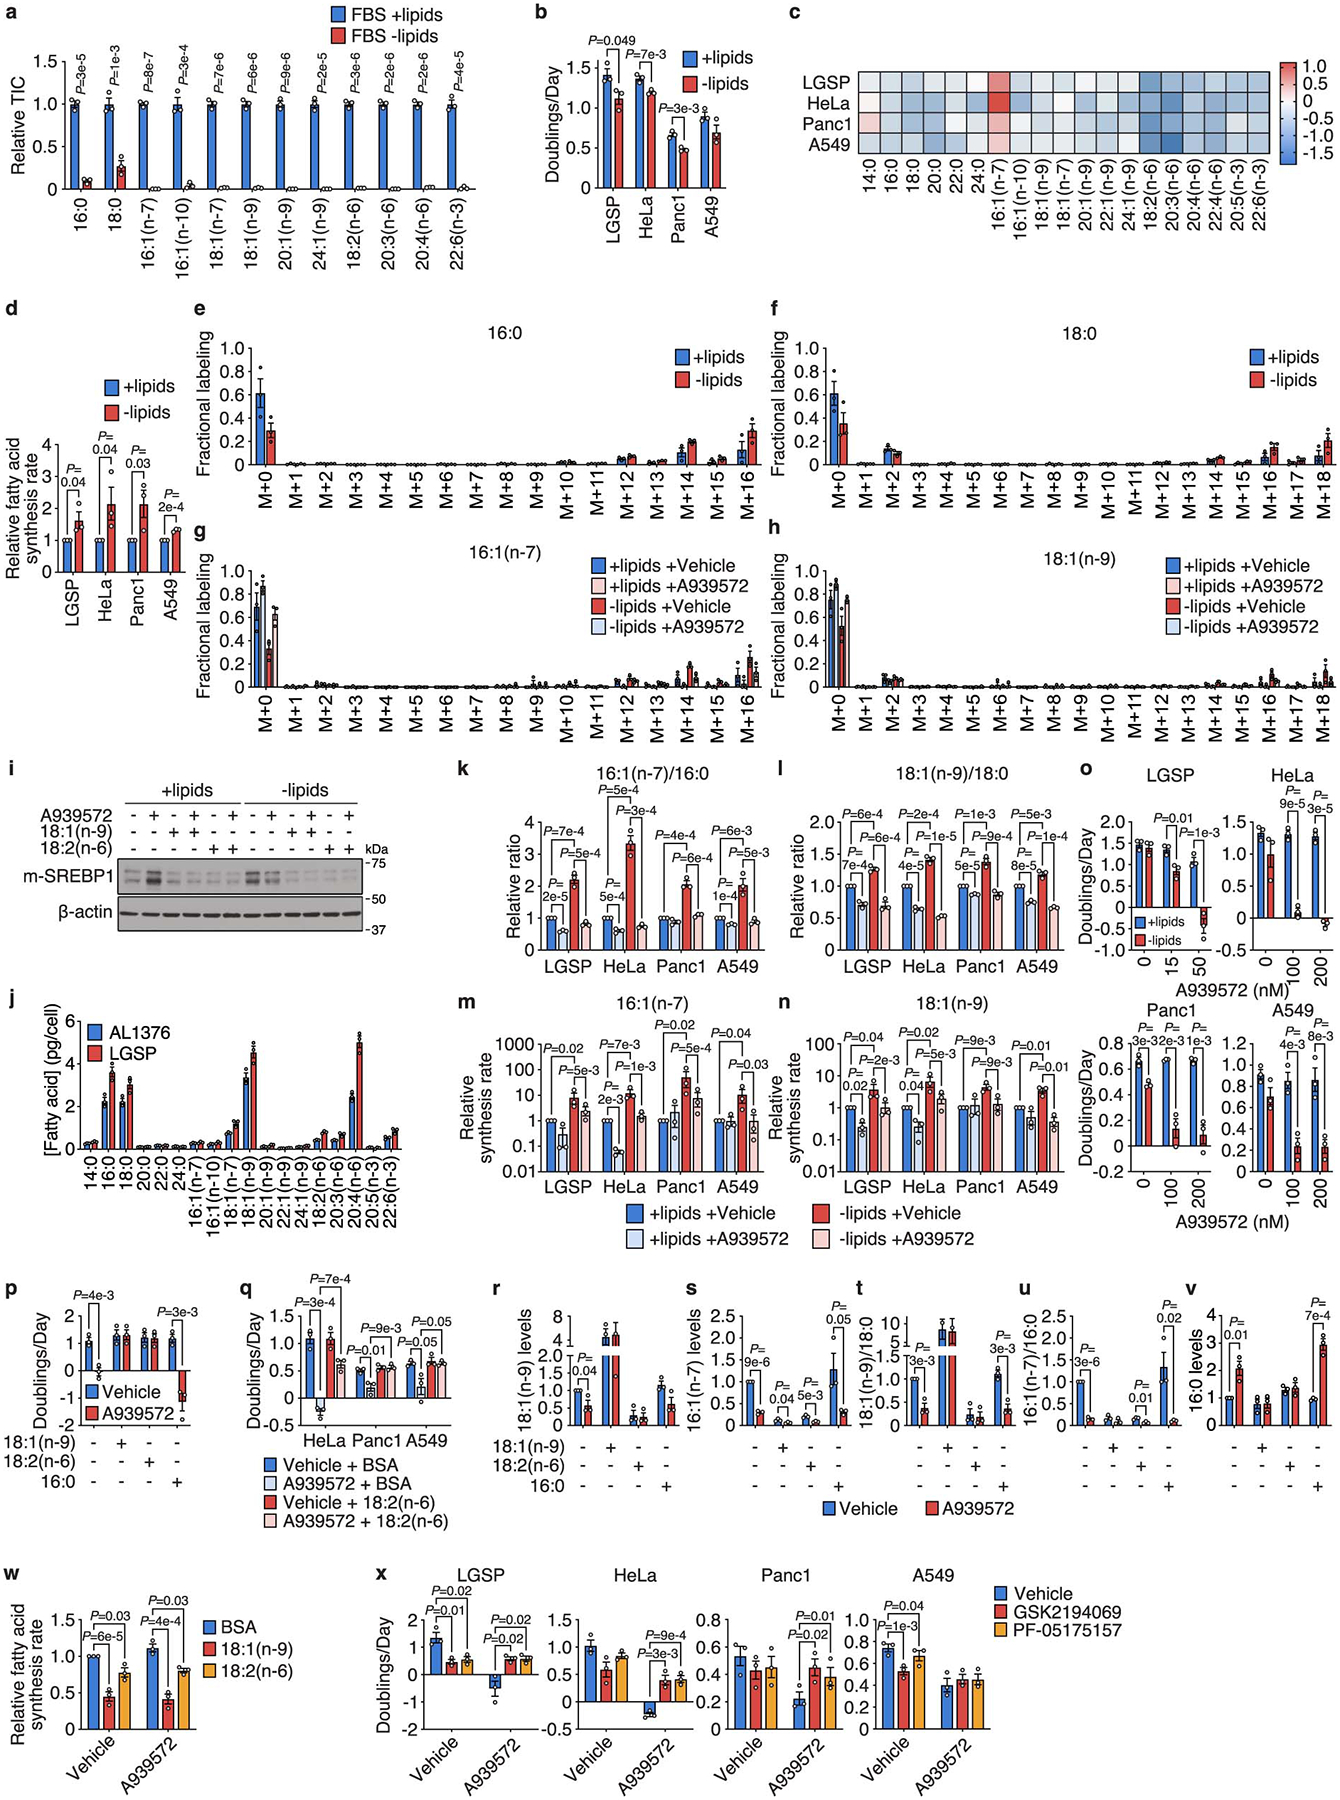
To evaluate how lipid deprivation impacts cellular fatty acid metabolism, we cultured cells in lipid-depleted media containing only trace fatty acids14 (Extended Data Fig. 4a). Cancer cells derived from various tissues, including AL1376, LGSP, HeLa, Panc1, and A549 cells, can still proliferate in lipid-depleted media, although at a slower rate (Fig. 3a, Extended Data Fig. 4b). Notably, lipid starvation does not sensitize AL1376 cells to any anti-proliferative effects of glucose limitation (Fig. 2c), suggesting that the combination of these two CR-mediated effects alone may not explain reduced tumor growth. Lipid depletion decreases cellular levels of polyunsaturated fatty acids (PUFAs) since these essential fatty acids cannot be synthesized by mammalian cells and must be obtained from the environment (Fig. 3b, Extended Data Fig. 4c). In contrast, levels of saturated fatty acids (SFAs) and monounsaturated fatty acids (MUFAs) are relatively maintained (Fig. 3b, Extended Data Fig. 4c), consistent with exogenous lipid limitation promoting SREBP1 transcription factor activation and de novo fatty acid synthesis (Fig. 3c, Extended Data Fig. 4d–i, Supplementary Table 1).
Figure 3. Increased stearoyl-CoA desaturase activity is required for cancer cells to adapt to exogenous lipid limitation.
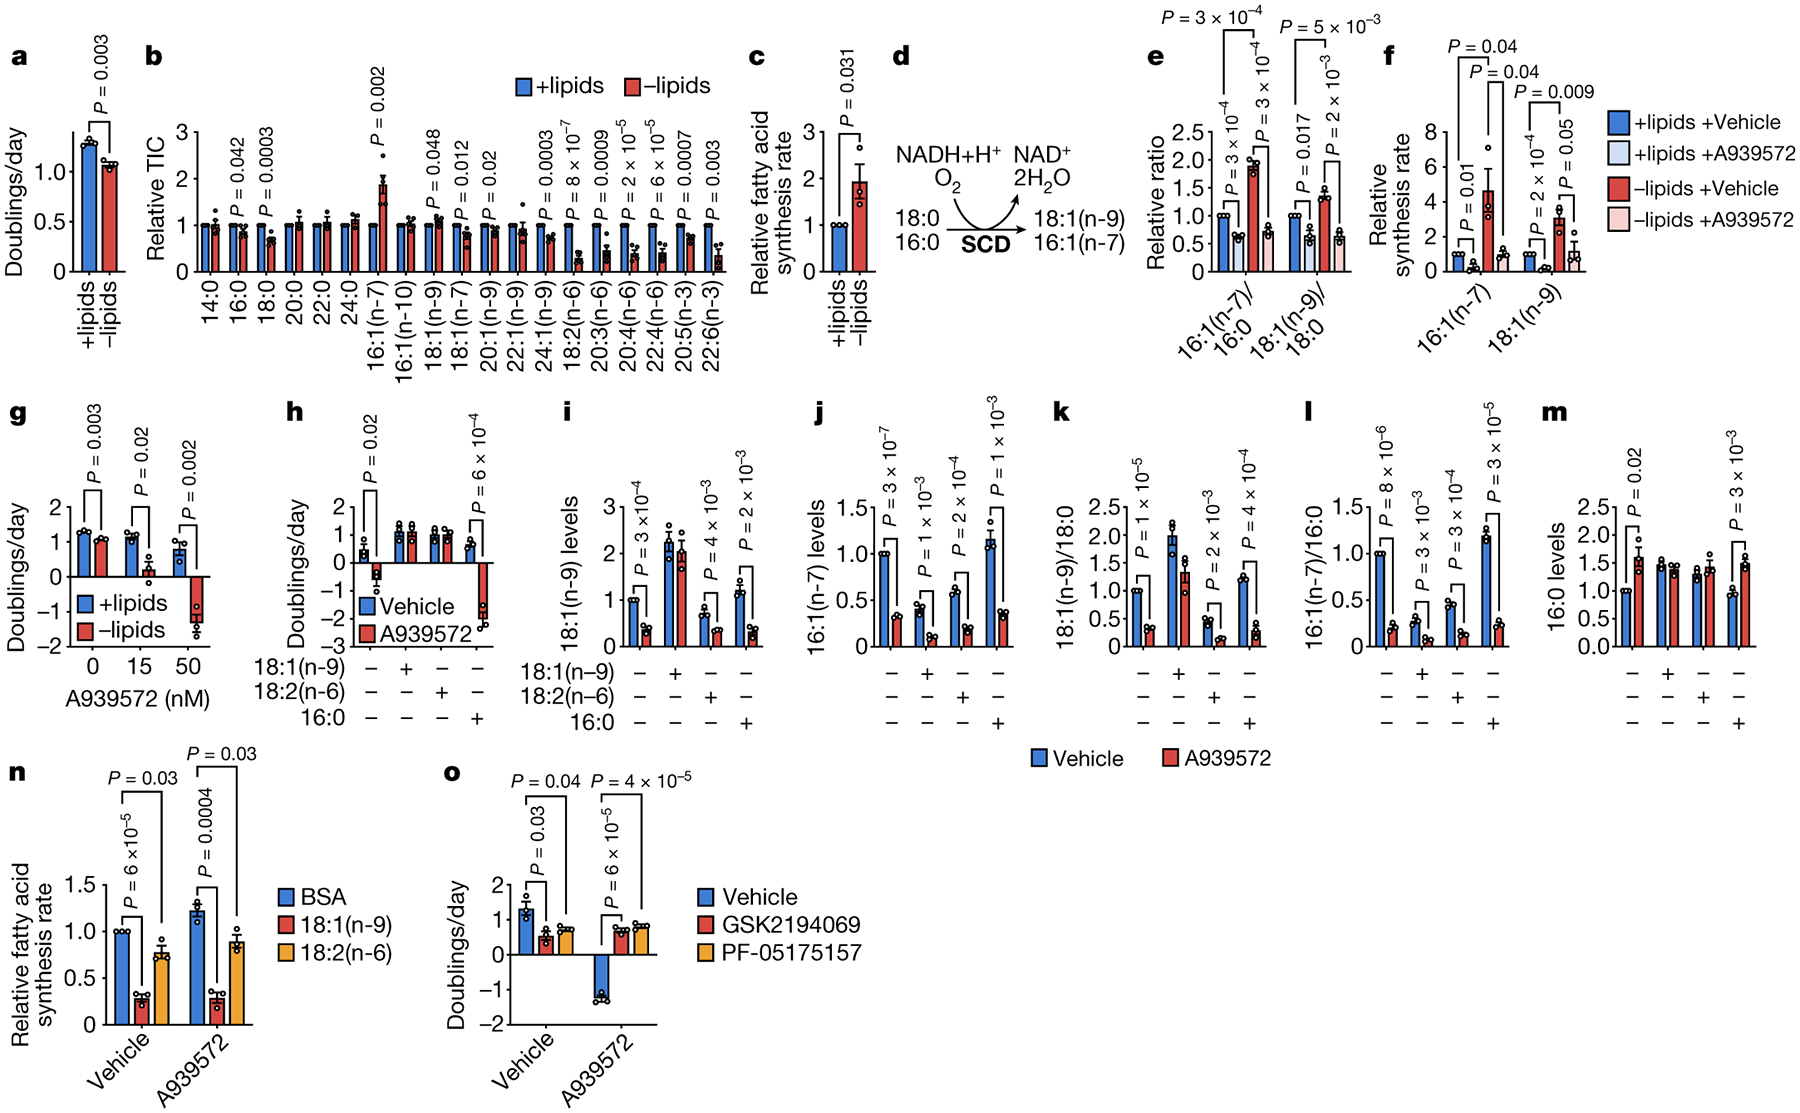
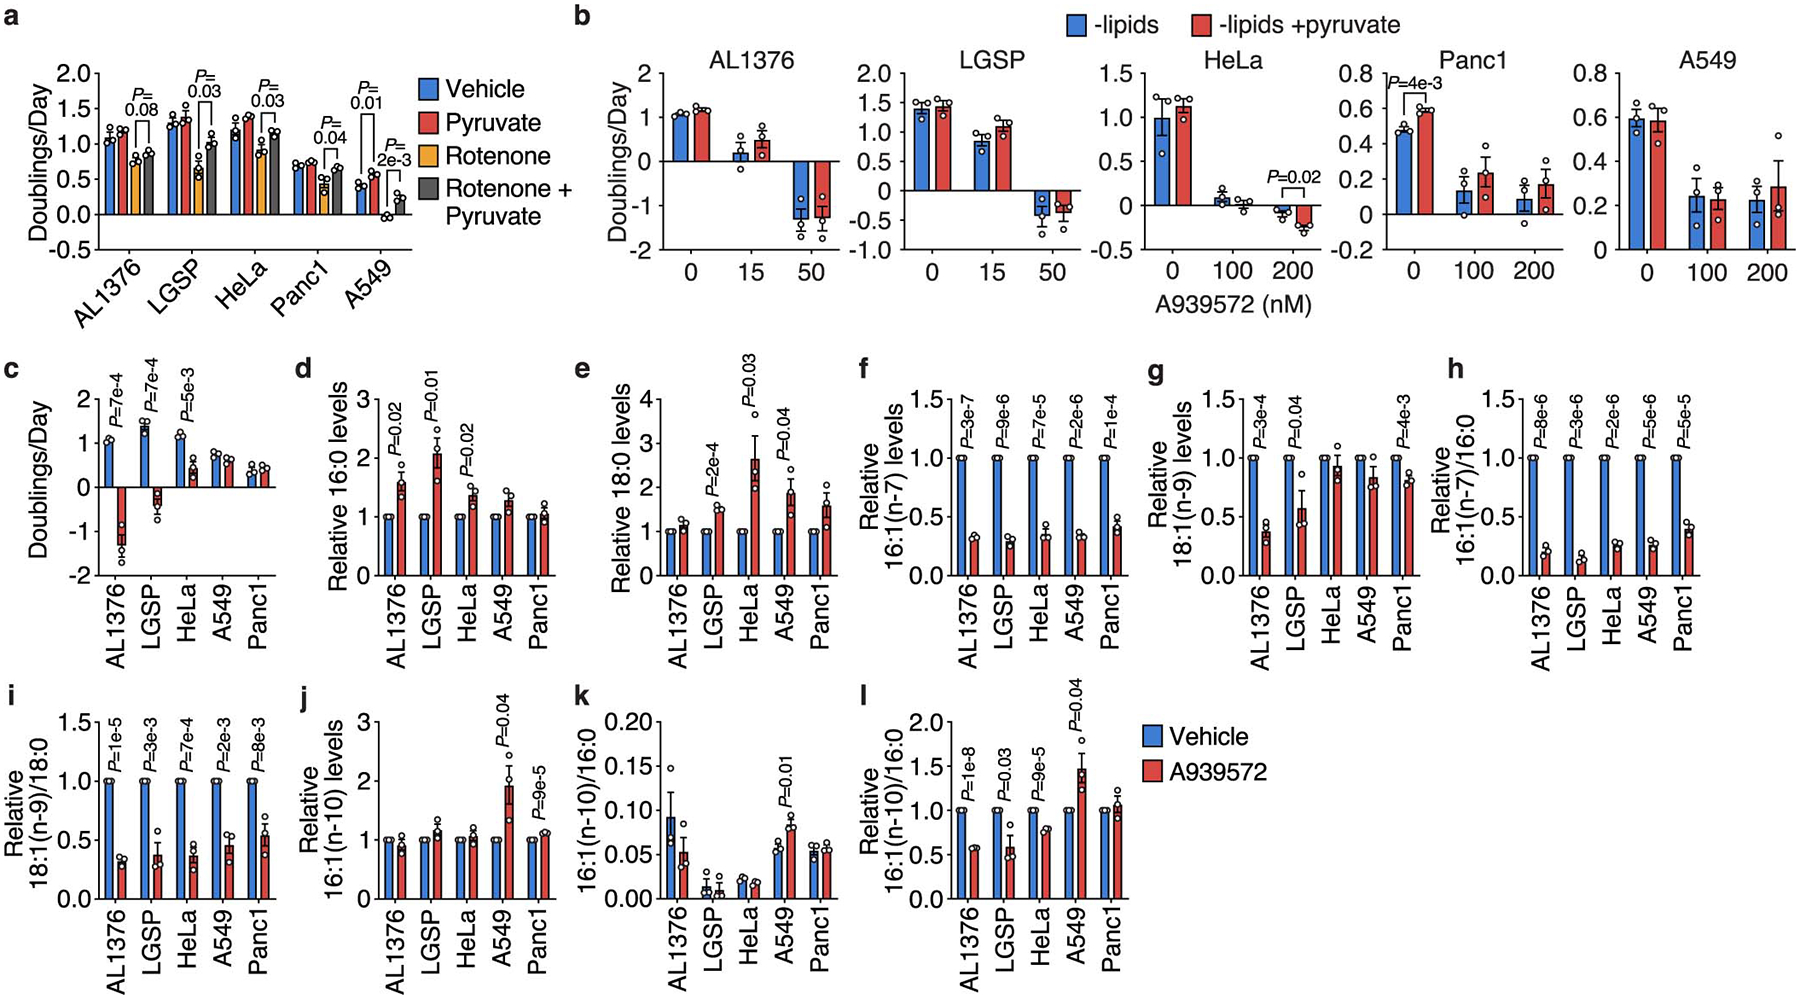
a, Doubling times of AL1376 cells cultured in lipidated versus de-lipidated media. b, Fatty acid levels in AL1376 cells cultured in lipidated versus de-lipidated media for 24 h. n = 5 biologically independent replicates. c, Relative fatty acid synthesis rates in AL1376 cells cultured in lipidated versus de-lipidated media. A one-tailed Student’s t-test was used for comparison between groups. d, Schematic of the reaction catalyzed by stearoyl-CoA desaturase (SCD). e, f, MUFA/SFA ratios (e) and synthesis rates of 16:1(n-7) and 18:1(n-9) (f) in AL1376 cells cultured in lipidated versus de-lipidated media, with or without 50 nM of the SCD inhibitor A939572 for 24 h. g, Doubling times of AL1376 cells cultured in lipidated versus de-lipidated media with the indicated concentrations of A939572. h, Doubling times of AL1376 cells cultured in de-lipidated media with or without 50 nM A939572, BSA, 50 μM 18:1(n-9), 50 μM 18:2(n-6), or 15 μM 16:0. i-m, 18:1(n-9) (i), 16:1(n-7) (j), 18:1(n-9)/18:0 (k), 16:1(n-7)/16:0 (l), and 16:0 (m) levels measured in AL1376 cells cultured in de-lipidated media with or without 50 nM A939572, BSA, 50 μM 18:1(n-9), 50 μM 18:2(n-6), or 15 μM 16:0 for 48 h as indicated. n, Relative fatty acid synthesis rates in AL1376 cells cultured in de-lipidated media with or without 50 nM A939572, BSA, 50 μM 18:1(n-9), or 50 μM 18:2(n-6). o, Doubling times of AL1376 cells cultured in de-lipidated media containing 50 nM A939572, 0.3 μM of the FASN inhibitor GSK2194069, or 10 μM of the ACC inhibitor PF-05175157. All data are presented as mean ± SEM; unless otherwise indicated, n = 3 biologically independent replicates, and a two-tailed Student’s t-test was used for comparison between groups.
Interestingly, 16:1(n-7) MUFA levels are markedly increased in cells cultured in lipid-depleted conditions (Fig. 3b, Extended Data Fig. 4c). Stearoyl-CoA desaturase (SCD) is responsible for the synthesis of 16:1(n-7) and 18:1(n-9) MUFAs from the 16:0 and 18:0 SFAs, respectively (Fig. 3d). These fatty acids are abundant (Extended Data Fig. 4j), indicating that SCD generates major fatty acid species that could affect cell proliferation. Indeed, SCD is important for multiple cancer types15. We find that the 16:1(n-7)/16:0 and 18:1(n-9)/18:0 ratios, which are surrogates of SCD activity16, are significantly increased in lipid-starved cells and decreased by the SCD inhibitor A939572 (Fig. 3e, Extended Data Fig. 4k–l). Consistently, lipid-starved cells exhibit increased flux through SCD (Fig. 3f, Extended Data Fig. 4g–h,m–n, Supplementary Table 1), and SCD inhibition impairs proliferation only in lipid-depleted media in all cells tested, and induces cell death in AL1376, LGSP, and HeLa cells (Fig. 3g, Extended Data Fig. 4o). Thus, up-regulation of SCD activity is necessary for these cancer cells when exogenous lipids are less abundant.
We next explored why lipid-starved cells require SCD to proliferate. Fatty acid desaturation can support regeneration of the co-factor NAD+ (Fig. 3d)17, which is required for biomass synthesis18–21. While pyruvate supplementation can regenerate NAD+ to rescue mitochondrial complex I inhibition by rotenone (Extended Data Fig. 5a), pyruvate does not rescue the effects of A939572 on any cell lines tested (Extended Data Fig. 5b), suggesting that NAD+ limitation does not explain why SCD inhibition impairs cell proliferation or viability.
We next examined whether altered cellular fatty acid levels correlate with A939572 sensitivity. AL1376, LGSP, HeLa, A549, and Panc1 cells exhibit varying sensitivities to A939572 (Extended Data Fig. 5c), and increased sensitivity only correlates with increased 16:0 and decreased 18:1(n-9) levels (Extended Data Fig. 5d–i). Synthesis of an alternative MUFA, sapienate (16:1(n-10)), renders some cells resistant to SCD inhibition and results in a higher 16:1(n-10)/16:0 ratio16. However, in the cells tested, neither 16:1(n-10) levels nor the basal 16:1(n-10)/16:0 ratio correlate with A939572 sensitivity (Extended Data Fig. 5j–k), although A939572-induced change to the 16:1(n-10)/16:0 ratio does correlate (Extended Data Fig. 5l). These associations suggest that toxicity from SCD inhibition in lipid-starved cells could be caused by decreased MUFAs,, decreased UFA/SFA ratios, and/or increased SFAs.
Exogenous 18:1(n-9) supplementation rescues cell death induced by SCD inhibition in AL1376 and LGSP cells (Fig. 3h, Extended Data Fig. 4p). 18:1(n-9) also rescues cellular levels of 18:1(n-9) but not 16:1(n-7) (Fig. 3i–j, Extended Data Fig. 4r–s), and rescues 18:1(n-9)/18:0 but not 16:1(n-7)/16:0 (Fig. 3k–l, Extended Data Fig. 4t–u). While this may imply that SCD inhibition impairs cell proliferation and viability by lowering MUFA levels and/or the MUFA/SFA ratios, SCD inhibition also leads to accumulation of the 16:0 SFA, which can be toxic to cells22, and this is reversed by 18:1(n-9) supplementation (Fig. 3m, Extended Data Fig. 4v). In fact, increased 16:1(n-7) levels in lipid-starved cells (Fig. 3b, Extended Data Fig. 4c) raises the possibility that an important function of SCD may be to desaturate newly synthesized 16:0 into 16:1(n-7) upon lipid depletion to avoid SFA toxicity.
To determine whether SCD inhibition is toxic to cells because it lowers MUFAs and/or the MUFA/SFA ratio, or if SCD activity limits accumulation of toxic SFAs such as 16:0, we supplemented cells with the essential PUFA 18:2(n-6). Providing 18:2(n-6) rescues toxicity of SCD inhibition in all cells tested (Fig. 3h, Extended Data Fig. 4p–q) and does not rescue levels of MUFAs or MUFA/SFA (Fig. 3i–l, Extended Data Fig. 4r–u). However, 18:2(n-6) supplementation prevents accumulation of 16:0 (Fig. 3m, Extended Data Fig. 4v), suggesting that some SCD inhibitor toxicity in lipid-starved cells is mediated by 16:0 accumulation rather than by reductions in MUFAs or MUFA/SFA ratios. Consistently, 16:0 supplementation exacerbates the toxicity of SCD inhibition (Fig. 3h, Extended Data Fig. 4p) and does not prevent decreases in MUFA levels or MUFA/SFA ratios (Fig. 3i–m, Extended Data Fig. 4r–v).
We next asked how 18:1(n-9) and 18:2(n-6) prevent 16:0 accumulation following SCD inhibition. We reasoned that lipid-starved cells might maintain increased 16:0 synthesis even when SCD is inhibited, leading to 16:0 accumulation. Indeed, A939572-treated cells maintain active SREBP1 in lipid-depleted media, and this is reversed by 18:1(n-9) or 18:2(n-6) supplementation (Extended Data Fig. 4i), resulting in slower fatty acid synthesis rates (Fig. 3n, Extended Data Fig. 4w, Supplementary Table 1) and no 16:0 accumulation. Consistent with this model, impairing fatty acid synthesis with fatty acid synthase (FASN) or acetyl-CoA carboxylase (ACACA) inhibitors rescues cell death induced by SCD inhibition in AL1376, LGSP, and HeLa cells (Fig. 3o, Extended Data Fig. 4x). Importantly, fatty acid synthesis inhibitors do not restore maximal proliferation of SCD inhibited cells, and minimally rescue effects of A939572 on Panc1 and A549 cell proliferation (Fi. 3o, Extended Data Fig. 4x). Therefore, despite the importance of SFA accumulation in inducing cell death upon SCD inhibition, acquiring unsaturated fatty acids through SCD activity is still needed for optimal lipid-starved cancer cell proliferation.
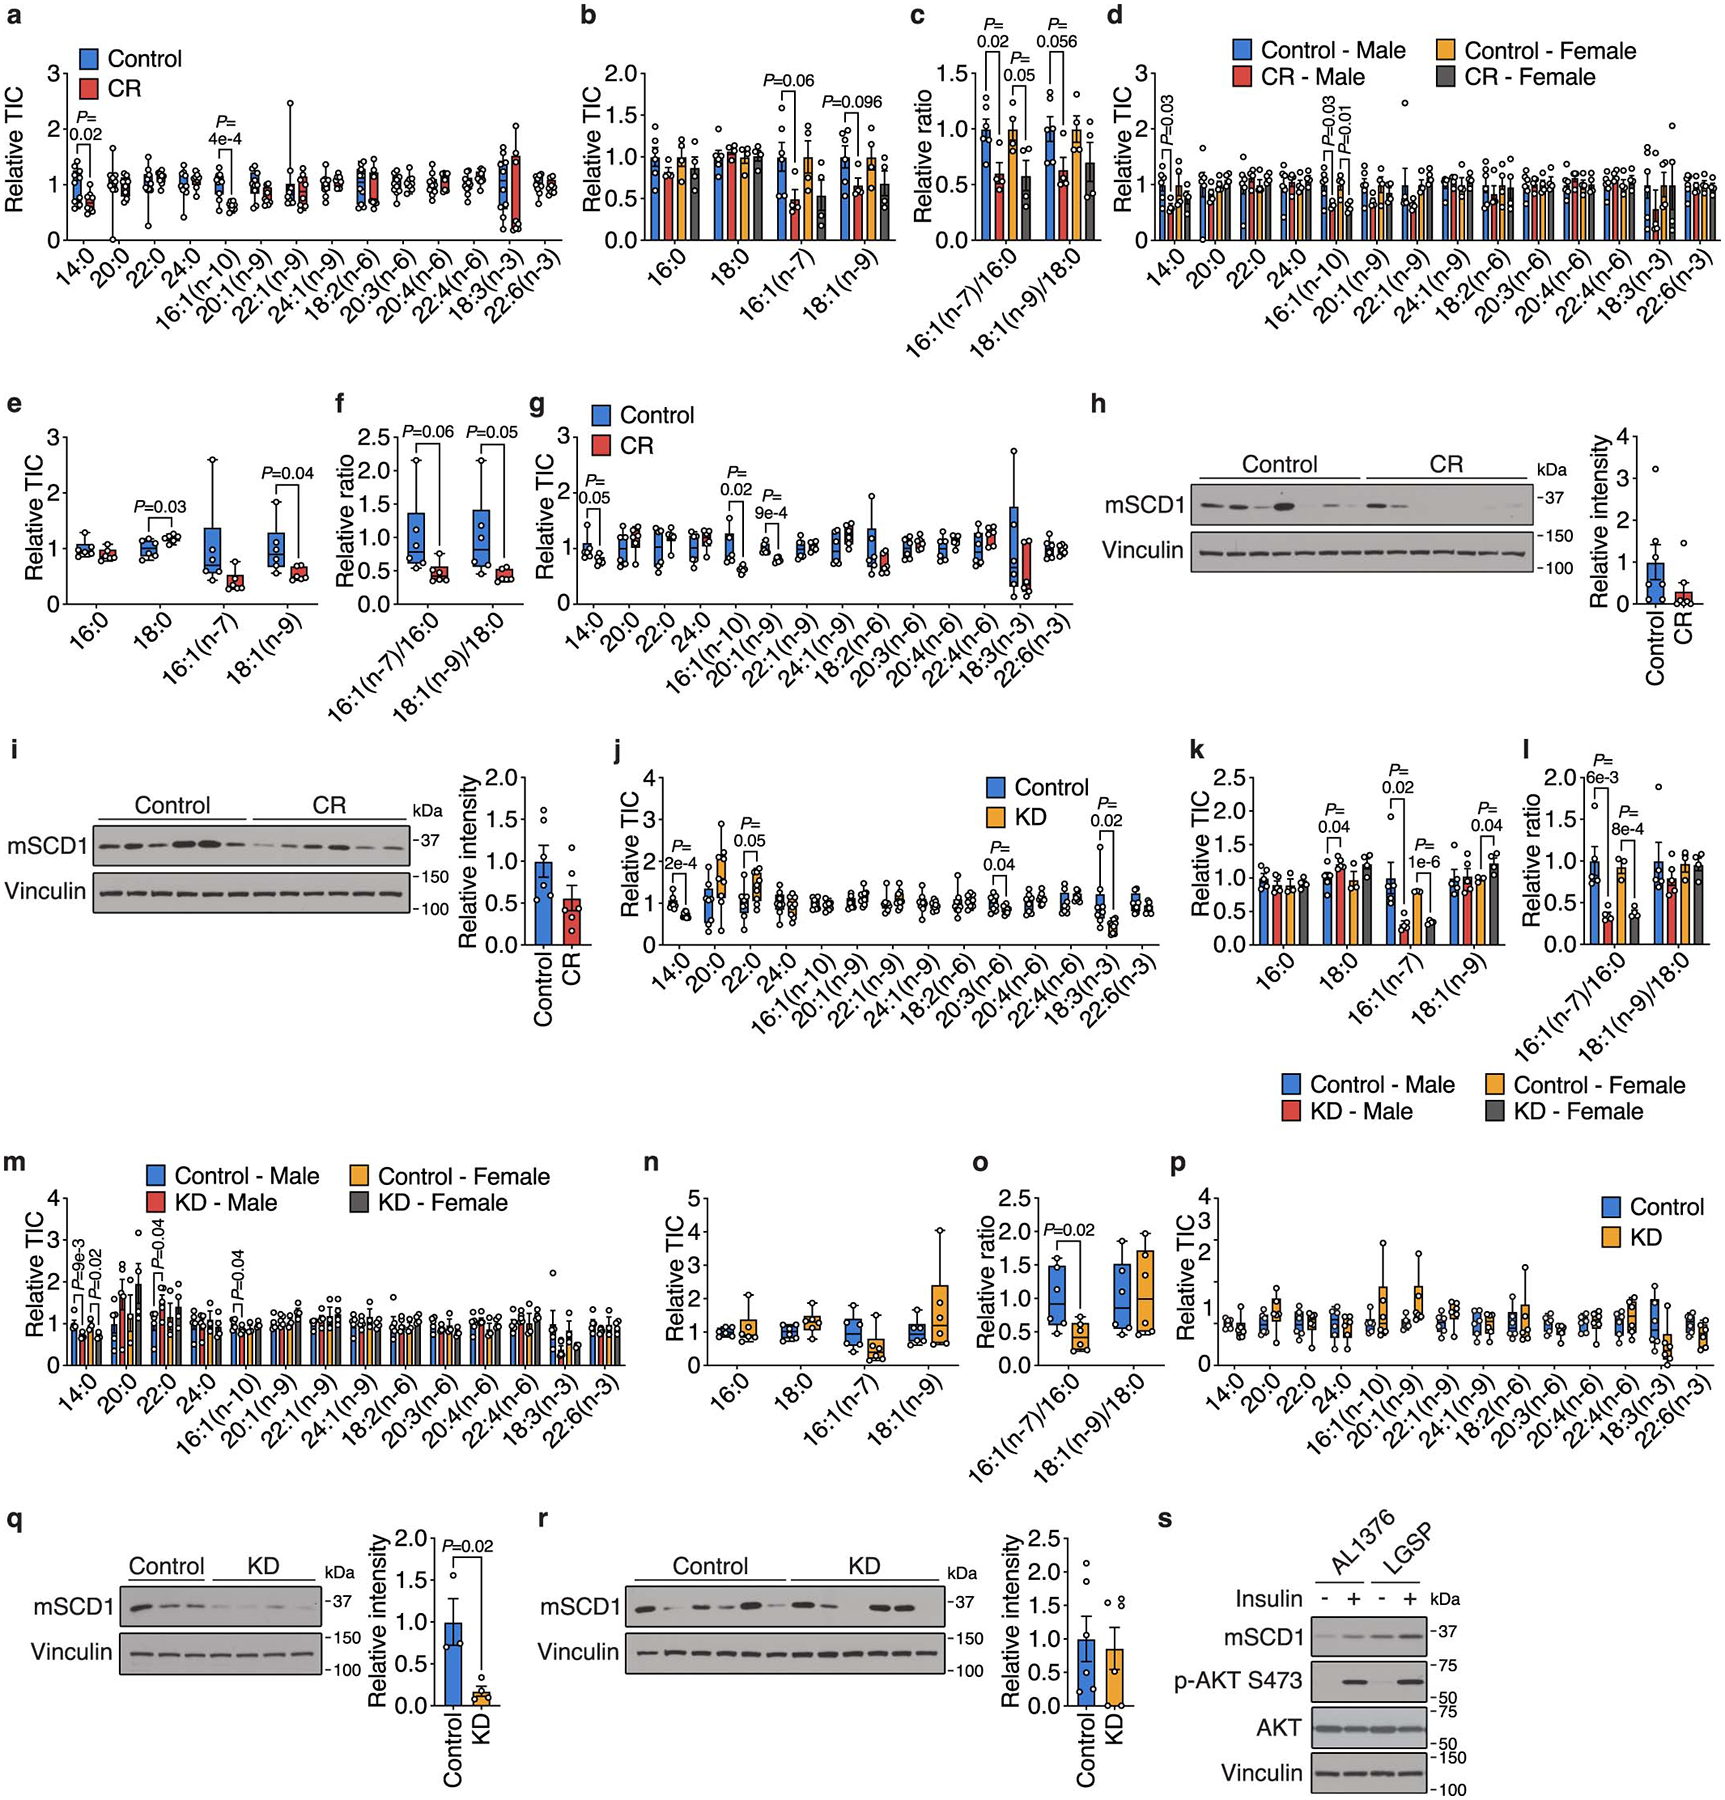
SCD activity is critical for cancer cells in lipid-depleted environments. Cell proliferation is impaired when SCD inhibition perturbs the balance between unsaturated and saturated fatty acids, and cell death is induced when SFAs accumulate. Since CR cannot deplete lipids in the tumor microenvironment to the same extent as lipid-depleted media, these in vitro findings may not fully explain our dietary observations, but nevertheless suggested how low glycemic diets could affect tumor growth because tumor SCD activity may be impaired by CR, as AL1376 and LGSP CR tumors maintain 16:0 and 18:0 levels but have decreased levels of 16:1(n-7), 18:1(n-9), 16:1(n-7)/16:0, and 18:1(n-9)/18:0 (Fig. 4a–b, Extended Data Fig. 6a–g). Consistently, most CR tumors analyzed have less SCD protein (Fig. 4c, Extended Data Fig. 6h–i). Tumors from KD mice also have lower levels of 16:1(n-7) and 16:1(n-7)/16:0 (Figure 4d–e, Extended Data Fig. 6j–p), and most KD tumors analyzed have reduced SCD protein levels (Fig. 4f, Extended Data Fig. 6q–r), suggesting that the KD also impairs tumor SCD activity. However, unlike CR, KD tumors maintain levels of 18:1(n-9) and 18:1(n-9)/18:0 (Figure 4d–e, Extended Data Fig. 6j–p), likely because the fat source in the KD is 18:1(n-9)-enriched lard (Extended Data Table 1), which leads to elevated 18:1(n-9) levels in plasma and TIF (Fig. 2e).
Figure 4. Low glycemic diets impair tumor SCD, which interacts with changes in lipid availability to impact tumor growth.
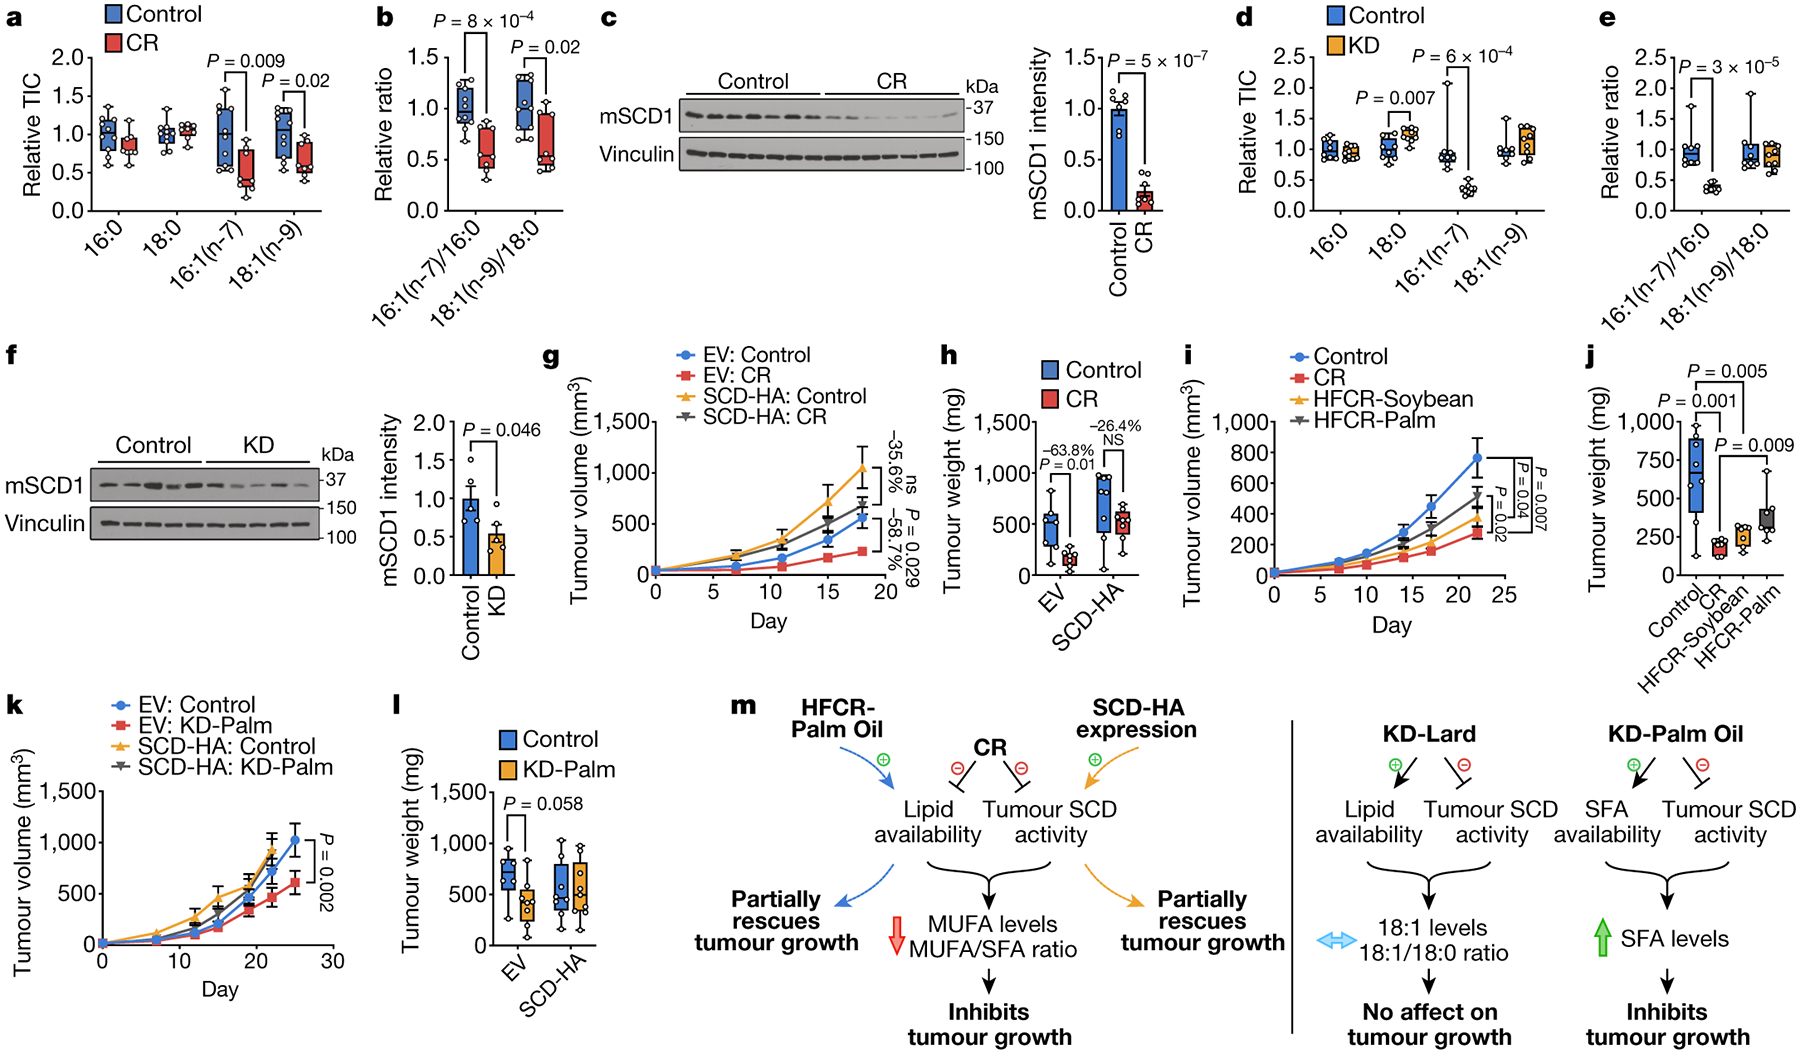
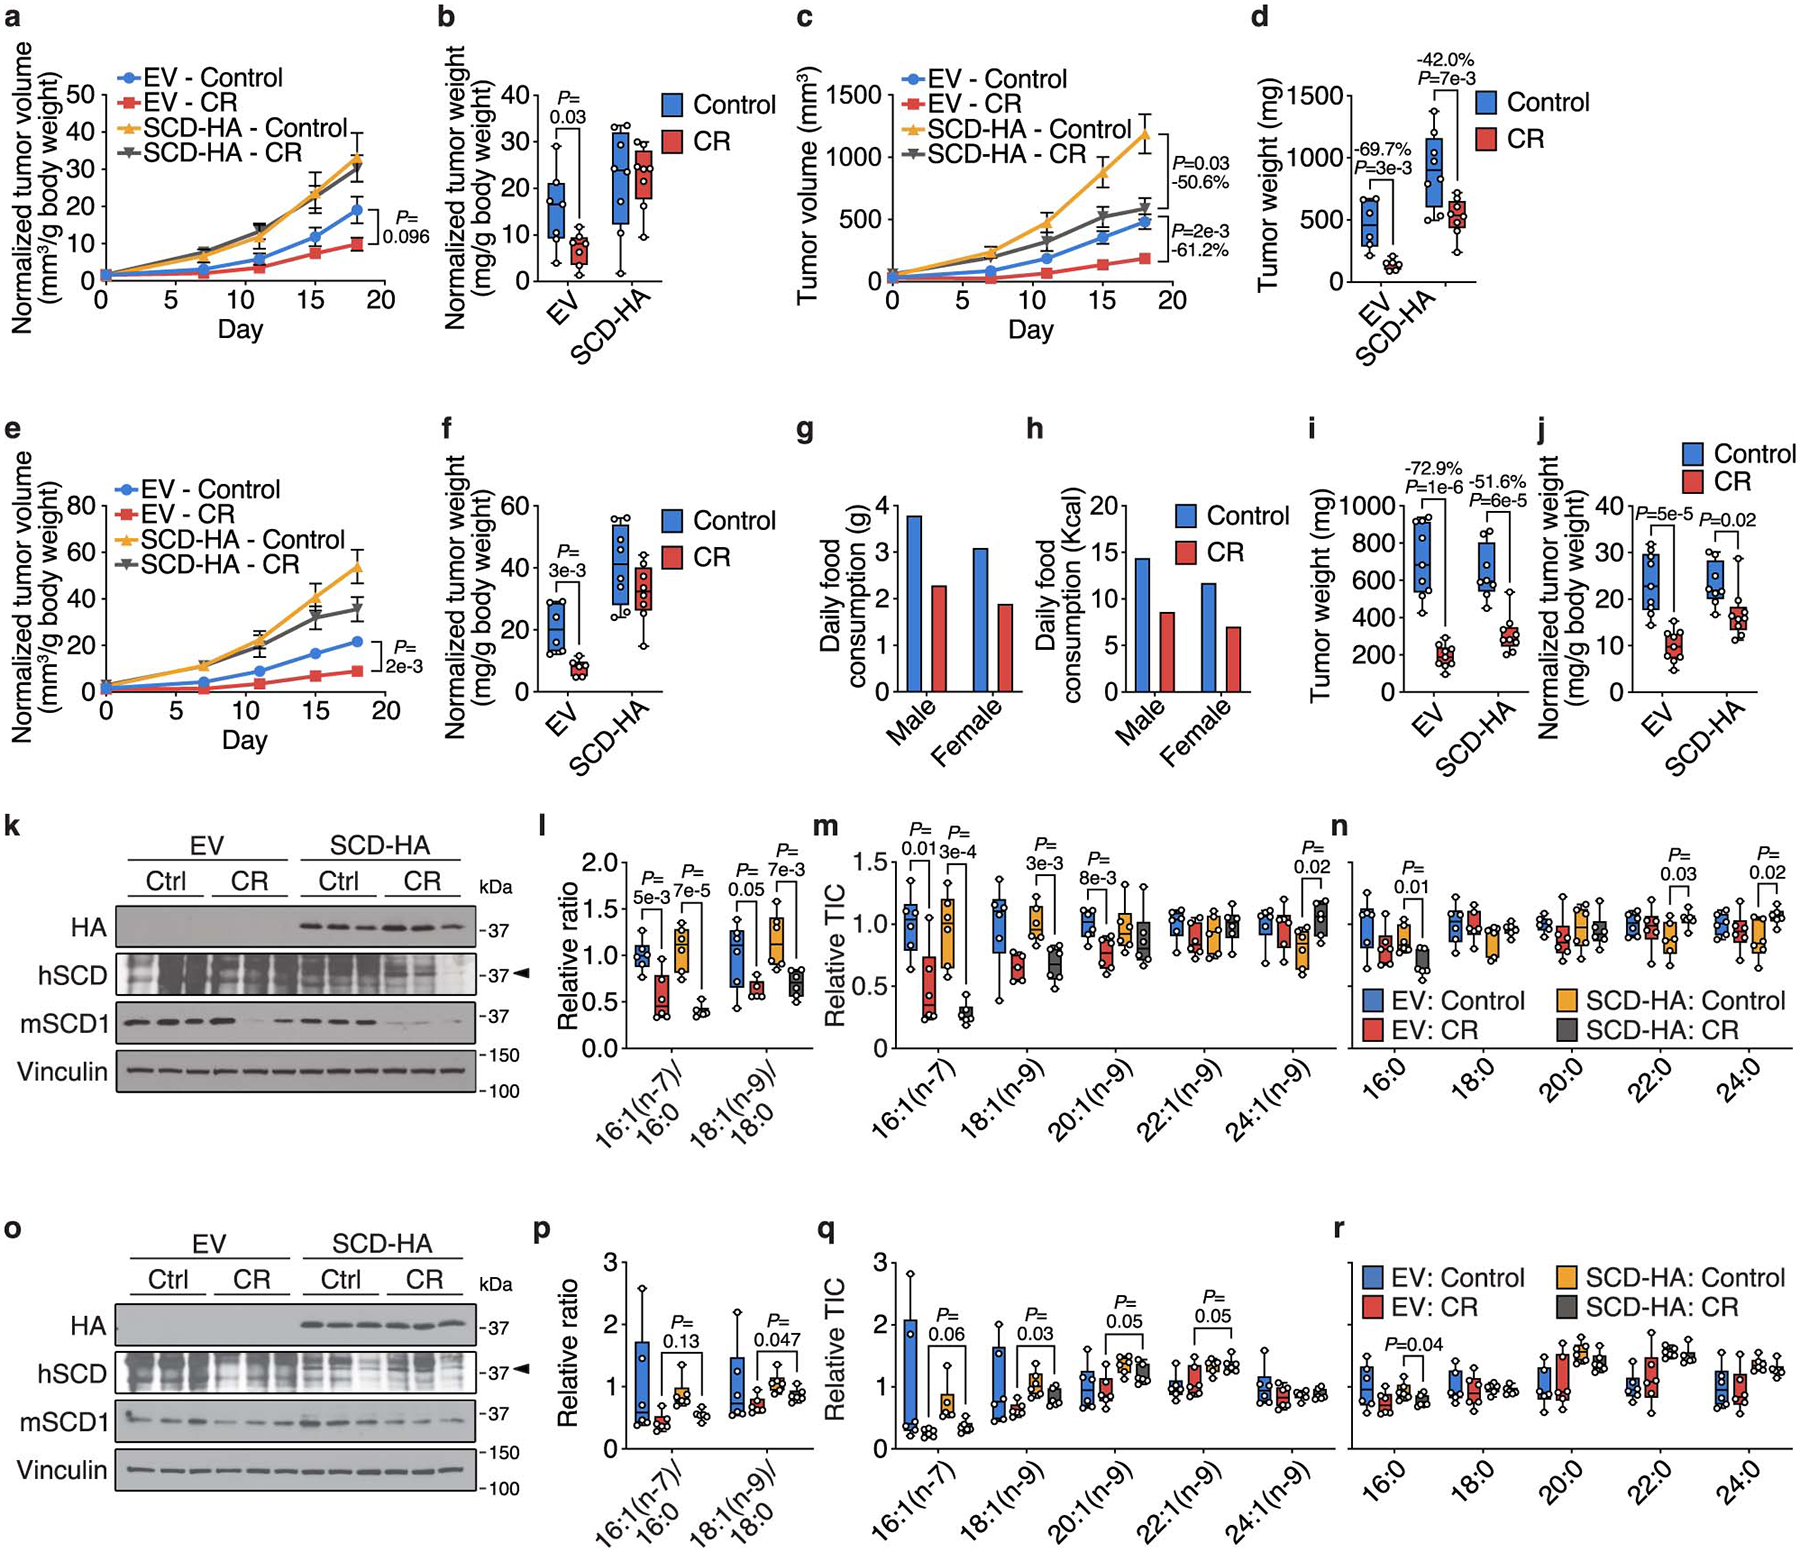
a, b, The indicated fatty acid levels (a) and MUFA/SFA ratios (b) measured in subcutaneous AL1376 tumors from mice exposed to a control or CR diet. Control n = 10, CR n = 8. c, Immunoblot and quantification for mouse Scd1 (mSCD1) and vinculin in subcutaneous AL1376 tumors from male mice exposed to a control or CR diet. n = 7 per group. d, e, The indicated fatty acid levels (d) and MUFA/SFA ratios (e) measured in subcutaneous AL1376 tumors from mice exposed to a control or KD diet. Control n = 8, KD n = 9. f, Immunoblot and quantification for mSCD1 and vinculin in subcutaneous AL1376 tumors from male mice exposed to a control or KD diet. n = 5 per group. g, h, Tumor volumes (g) and weights (h) of subcutaneous AL1376 tumors expressing an empty vector (EV) or SCD-HA in male mice exposed to a control or CR diet. n = 4 per group. i, j, Tumor volumes (i) and weights (j) of subcutaneous AL1376 tumors in mice exposed to a control diet, CR, or high fat CR diets consisting of soybean oil (HFCR-Soybean) or palm oil (HFCR-Palm). Control n = 5 mice, CR n = 4 mice, HFCR-Soybean n = 4 mice, HFCR-Palm n = 4 mice. k, l, Tumor volumes (k) and weights (l) of subcutaneous AL1376 tumors expressing EV or SCD-HA in mice exposed to a control or KD diet consisting of palm oil (KD-Palm). EV: Control n = 4 mice, EV: KD-Palm n = 5 mice, SCD-HA: Control n = 6 mice, SCD-HA: KD-Palm n = 6 mice. m, Model summarizing how low glycemic diets alter lipid metabolism to impact tumor growth. Data are presented as box-and-whisker plots displaying median, interquartile range (boxes), and minima and maxima (whiskers) (a,b,d,e,h,j,l) or mean ± SEM (c,f,g,i,k). Comparisons were made using a two-tailed Student’s t-test (a-f,h,j,l) or two-way repeated measures analysis of variance (ANOVA) (g,i,k).
Inhibition of tumor SCD by both CR and the KD may be caused by a factor common to both diets. Notably, SCD expression is up-regulated by insulin signaling23, and we find insulin stimulation increases SCD levels in AL1376 and LGSP cells (Extended Data Fig. 6s). Thus, CR- and KD-mediated insulin reduction may reduce tumor SCD expression. Taken together, these findings suggest that which lipids are available to cancer cells in the setting of reduced SCD activity could explain the distinct effects of the diets on tumor growth. CR lowers tumor lipid availability, and concomitant SCD inhibition may prevent cancer cell adaptation to a lipid-depleted environment and impair tumor growth. Notably, CR does not induce SFA accumulation in tumors, but decreases MUFA levels and the MUFA/SFA ratio (Fig. 4a–b, Extended Data Fig. 6b–g). Since SCD inhibition induces cell death only when SFAs accumulate, these data are consistent with CR impairing proliferation to slow tumor growth rather than causing cell death and tumor regression (Fig. 1a, Extended Data Fig. 2d–e), and argues palmitate toxicity associated with extreme SCD inhibition is not caused by CR. In contrast, the KD raises tumor lipid availability, which maintains tumor levels of 18:1(n-9) and 18:1(n-9)/18:0 to allow tumor growth despite reduced SCD activity (Figure 4d–e, Extended Data Fig. 6k–p). Together, these data support a model where the ability of low glycemic diets to cause an imbalance between unsaturated and saturated fatty acids contributes to whether the diet affects tumor growth (Fig. 4m).
To test this model with respect to CR, we subcutaneously implanted AL1376 cells engineered to express SCD into male mice. SCD expression promotes growth of CR tumors and partially rescues the anti-tumor effects of CR (Fig. 4g–h). Notably, the ~40% tumor growth inhibition in the SCD-expressing tumors is accounted for by the 40% reduction in caloric intake with the CR diet (Extended Data Fig. 7g–h), and when data are normalized to animal body weights, the inhibitory effects of CR are almost completely rescued (Extended Data Fig. 7a–b). Similar results are observed in AL1376 tumors from female mice (Extended Data Fig. 7c–f) and in LGSP tumors (Extended Data Fig. 7i–j). Therefore, enforced SCD expression partially rescues CR-mediated tumor growth inhibition.
To confirm increased SCD activity in SCD-expressing tumors, we found evidence for increased MUFA/SFA ratios in smaller but not larger tumors. In larger tumors collected 18 days after diet initiation, CR is equally effective at lowering MUFA and MUFA/SFA levels for both control and SCD-expressing tumors (Extended Data Fig. 7k–n). However, PDAC tumors are heterogeneous even when grown subcutaneously9, and analysis of bulk tumors containing many cell types may mask cancer cell increases in MUFA/SFA and MUFA levels. Large tumors also have necrotic and hypoxic regions that would inhibit the oxygen-requiring SCD reaction to impair MUFA synthesis24,25 and make cells dependent on exogenous lipids26. SCD expression partially rescues MUFA and MUFA/SFA levels, particularly 18:1(n-9) and 18:1(n-9)/18:0, in smaller tumors collected 7 days after diet initiation that do not contain necrotic regions (Extended Data Fig. 7o–r), consistent with an imbalance in unsaturated to saturated fatty acids influencing how effective CR is at impairing tumor growth.
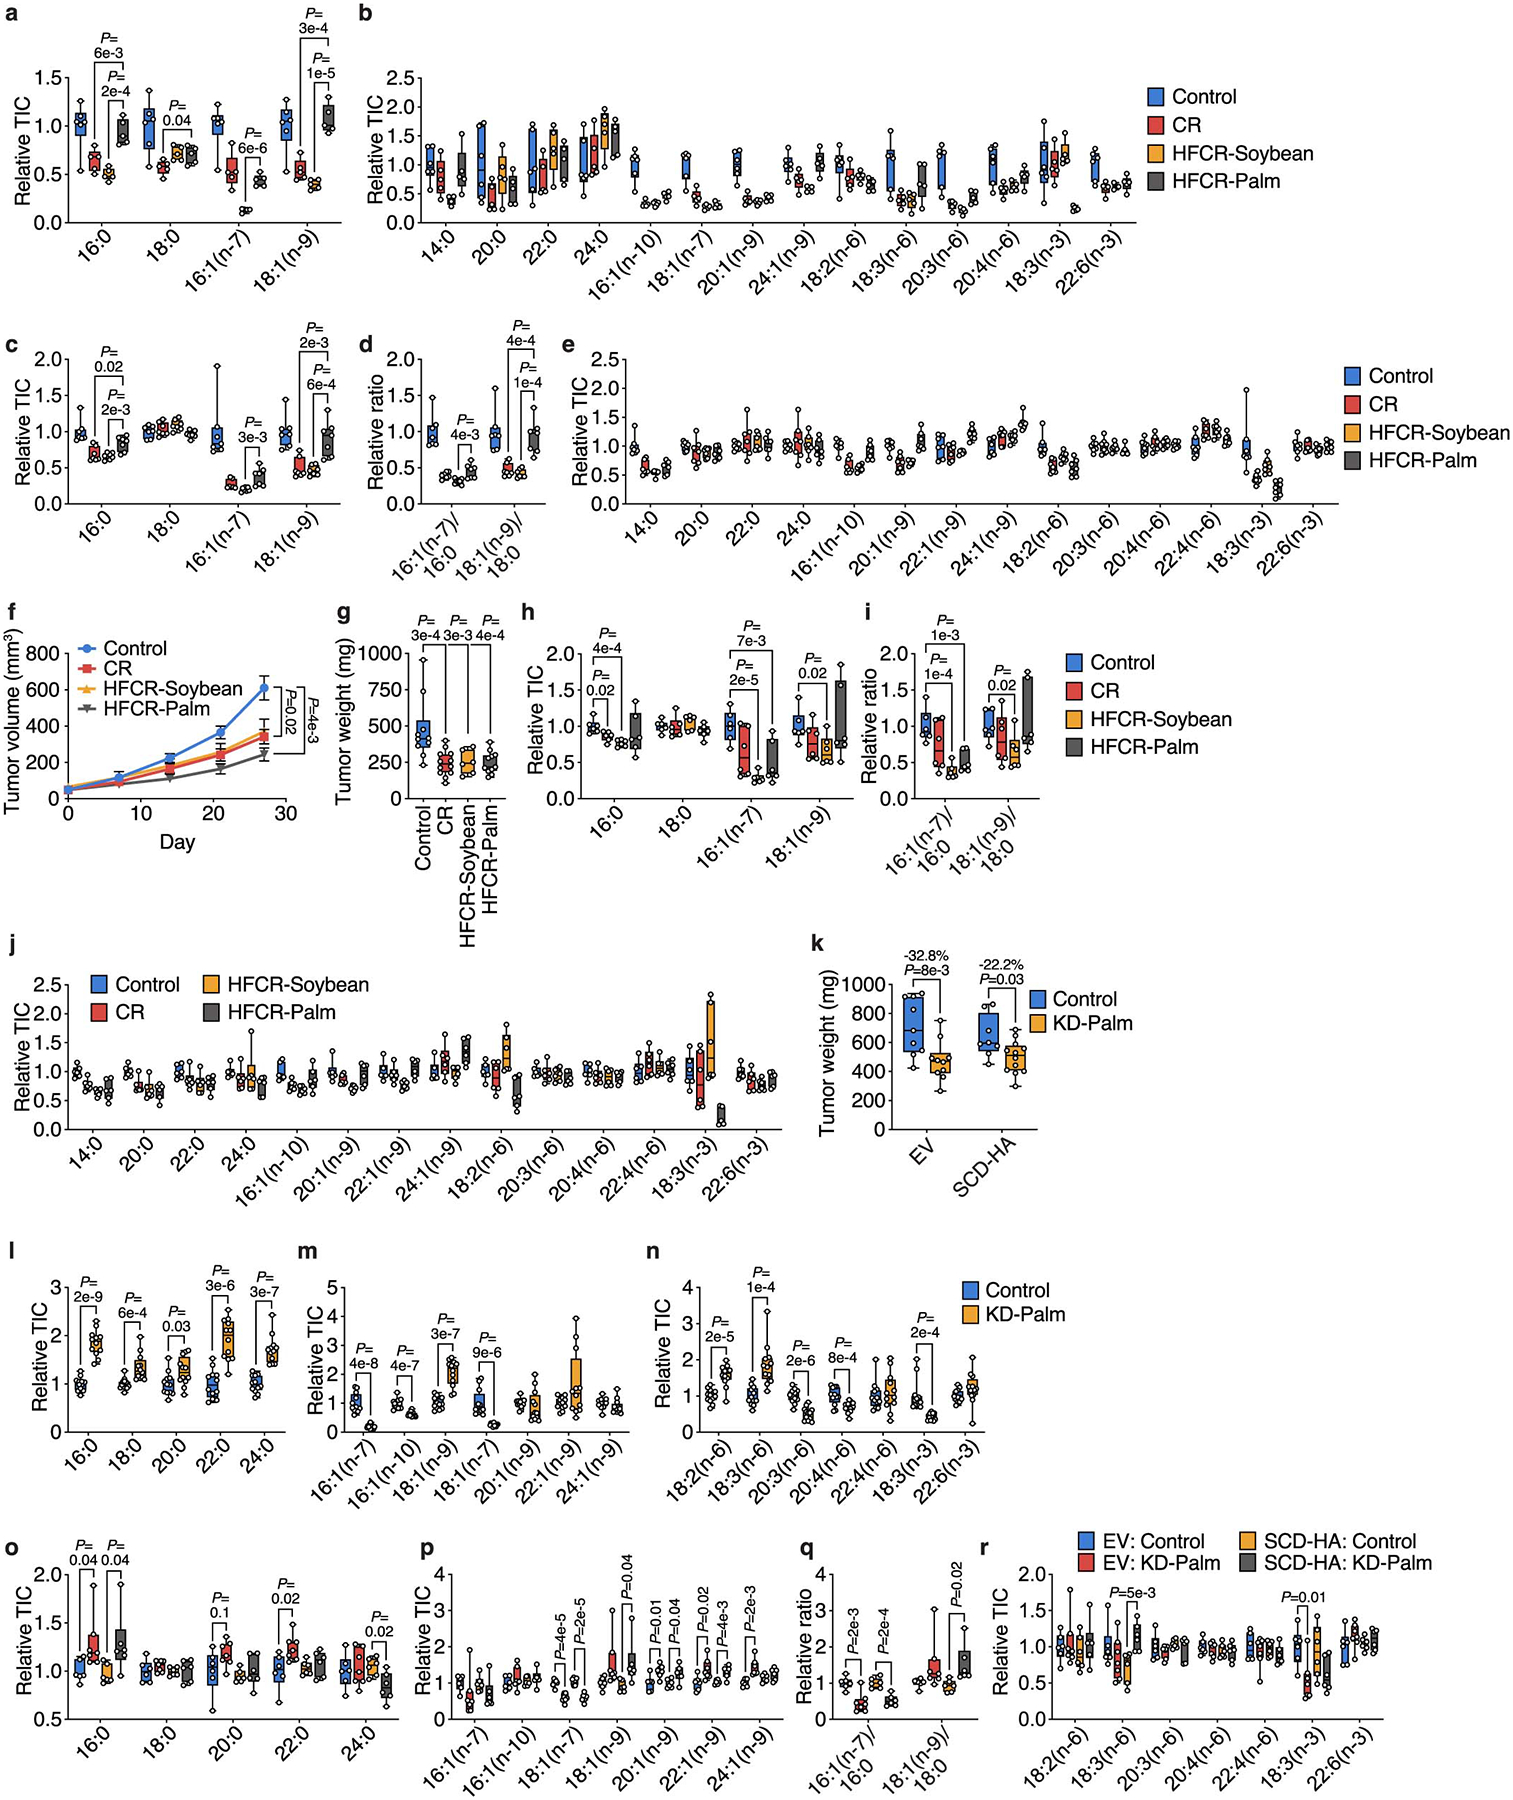
We next asked whether a high fat caloric restriction (HFCR) diet could increase systemic lipid availability to rescue CR-mediated impairment of SCD activity and tumor growth. One HFCR diet contained soybean oil (HFCR-Soybean), which consists of the PUFA 18:2(n-6) as the most abundant fatty acid (Extended Data Table 1). Since the toxicity of SCD inhibition is maximized when accompanied by 16:0 accumulation, we also considered a 16:0-enriched diet containing palm oil (HFCR-Palm), which consists of 16:0 and 18:1(n-9) as abundant fatty acids (Extended Data Table 1). Only HFCR-Palm partially rescues the growth of AL1376 tumors relative to CR (Fig. 4i–j). While HFCR-Palm restores circulating 16:0 and 18:1(n-9) back to control levels, HFCR-Soybean does not raise circulating 18:2(n-6) despite being enriched with dietary 18:2(n-6), and further lowers circulating MUFAs (Extended Data Fig. 8a–b). The distinct effects of these diets on circulating fatty acids argue further study of how dietary fat compositions change systemic lipid availability is needed. Regardless, only HFCR-Palm rescues tumor levels of 16:0, 18:1(n-9), and 18:1(n-9)/18:0 back to control levels (Extended Data Fig. 8c–e), consistent with a restored 18:1(n-9)/18:0 ratio rescuing tumor growth in the context of CR. Interestingly, HFCR-Palm does not rescue LGSP tumor growth (Extended Data Fig. 8f–g), but 16:0, 18:1(n-9), and 18:1(n-9)/18:0 levels are not restored to control levels in most HFCR-Palm LGSP tumors analyzed (Extended Data Fig. 8h–j), suggesting that LGSP cells may differ in their ability to access the fatty acids provided by HFCR-Palm. Taken together, these data support a model where CR inhibits tumor growth by altering tumor lipid availability while also inhibiting tumor SCD activity, such that the anti-tumor effects of the diet can be mitigated by restoring tumor 18:1(n-9)/18:0 either with exogenous SCD expression or with HFCR-Palm (Fig. 4m).
With respect to the KD, we asked whether a 16:0-enriched KD may impair tumor growth because the effects of SCD inhibition are maximized when SFAs accumulate. A palm oil-based KD (KD-Palm) has double the amount of 16:0 relative to a lard-based KD while maintaining similar 18:1(n-9) levels (Extended Data Table 1). KD-Palm inhibits AL1376 and LGSP tumor growth, and this is rescued by exogenous SCD expression (Fig. 4k–l, Extended Data Fig. 8k). KD-Palm elevates circulating SFAs (Extended Data Fig. 8l–n) and leads to SFA accumulation in tumors (Extended Data Fig. 8o–r). SCD expression prevents accumulation of some SFAs, particularly longer chain SFAs (Extended Data Fig. 8o). Therefore, the effects of the KD on tumor growth can be dependent on dietary fat composition, and are consistent with a model where KD-Palm increases tumor SFAs, which synergizes with KD-mediated tumor SCD inhibition to impair tumor growth (Fig. 4m).
The interaction between dietary fat composition and low glycemic diet-induced tumor SCD inhibition to cause an imbalance between saturated and unsaturated fatty acids provides a mechanism by which low glycemic diets impact tumor growth. To begin to assess if low glycemic diet effects on lipid metabolism might influence human tumor growth, we evaluated associations between dietary patterns and survival time among 1,165 pancreatic cancer patients in two large prospective cohorts (the Nurses’ Health Study and Health Professionals Follow-up Study). A dietary pattern lower in carbohydrates and higher in fat and protein was associated with longer survival time, and this association was modestly stronger for low-carbohydrate dietary patterns in which the fat and protein components were plant-based instead of animal-based (Extended Data Table 2). Moreover, diets consisting of more fat, as opposed to protein, were associated with longer survival times, and this association was again more pronounced for plant-based fats (Extended Data Table 2). While more work is needed to understand mechanisms by which distinct dietary fat compositions affect human tumor growth and metabolism, the fact that plant-derived lipids contain more unsaturated fatty acids than animal-derived lipids27 is provocative.
Low glycemic diets may not be the right intervention for all cancer patients. Both CR and KD regimens are difficult to maintain and tolerate, and CR-associated weight loss might limit treatment options. Moreover, although a SFA-enriched KD can inhibit mouse tumor growth, studies have suggested negative effects of long-term dietary SFA consumption, including induction of pro-metastatic CD36 and potential associations with cardiovascular diseases28,29. Given our findings that SCD inhibition is exacerbated by low lipid or high saturated fatty acid availability, identifying diets or interventions that induce these conditions may improve the efficacy of SCD inhibitor-based therapy. Nevertheless, this study demonstrates how diet can alter tumor metabolite availability and influence cancer cell metabolism to affect growth. A better understanding of dietary effects on tumor metabolism and progression may lead to orthogonal strategies to mimic the effects of a particular diet and provide guidance for how to incorporate dietary interventions to improve cancer patient care.
Methods:
Cell lines and culture.
AL1376 pancreatic ductal adenocarcinoma cells were isolated from C57BL/6J LSL-Kras(G12D);Trp53fl/fl;Pdx1-Cre mice as previously described30. LGSP lung adenocarcinoma cells were derived from the C57BL/6J LSL-Kras(G12D);Trp53fl/fl;Ad-Cre mouse lung cancer model as previously described10. HeLa, Panc1, and A549 cells were obtained from the American Type Culture Collection (ATCC). No cell lines used in this study were found in the database of commonly misidentified cell lines that is maintained by the International Cell Line Authentication Committee. All cells were cultured in DMEM (Corning Life Sciences) without pyruvate supplemented with 10% heat inactivated dialyzed fetal bovine serum (VWR) unless otherwise specified. Lipid Mixture 1 (Millipore Sigma L0288) was supplemented at 1% v/v where indicated. Cells were passaged for no more than 6 months and routinely assayed for mycoplasma contamination.
Animal studies.
All experiments conducted in this study were approved by the MIT Committee on Animal Care (IACUC). For subcutaneous tumor growth, a maximum tumor burden of 2 cm3 was permitted per IACUC protocol, and these limits were not exceeded. Male and female C57BL/6J mice between 3–4 months old were used in this study. All animals were housed at ambient temperature and humidity (18–23°C, 40–60% humidity) with a 12 h light and 12 h dark cycle and co-housed with littermates with ad libitum access to water, unless otherwise stated. All experimental groups were age-matched, numbered, and assigned based on treatment, and experiments were conducted in a blinded manner. Data was collected from distinct animals, where n represents biologically independent samples. Statistical methods were not performed to pre-determine sample size.
For subcutaneous tumors, C57BL/6J mice (The Jackson Laboratory 000664) were injected with 1–2 ⨉ 105 mouse AL1376 cells or 4 ⨉ 105 mouse LGSP cells as previously described30. Cells were injected subcutaneously into both flanks in 100 μl of phosphate-buffered saline (PBS) per injection. All mice were administered the AIN-93G control diet (Envigo TD.94045) during tumor formation, and 9–12 days after cell injection when palpable tumors had formed, animals were randomly placed into different diet groups. Mice were weighed before the start of diet administration to ensure different cohorts had similar starting body weights, and body weights were also measured over the course of each experiment. Tumor volume was determined using (π/6)(W 2)(L), where W represents width and L represents length as measured by calipers. At the end of each experiment, animals were euthanized, blood was collected by cardiac puncture, and tumors or tissues were rapidly harvested, weighed, and freeze-clamped in liquid nitrogen.
Animal diets.
The AIN-93G diet (Envigo TD.94045) was used as the control diet. 40% caloric restriction (CR), high fat caloric restriction diet consisting of soybean oil (HFCR-Soybean), high fat caloric restriction diet consisting of palm oil (HFCR-Palm), the lard-based ketogenic diet (KD), and a KD consisting of palm oil (KD-Palm) were formulated by modifying the AIN-93G diet as shown in Extended Data Table 1. CR (Envigo TD.170111) was formulated such that animals fed at 40% restriction consumed the same amounts of protein, fat, vitamins, and minerals, and only calories from carbohydrates were reduced by 40%. HFCR-Soybean (Envigo TD.200397) and HFCR-Palm (Envigo TD.200396) were formulated by approximately doubling the amount of fat relative to CR at the expense of further lowering carbohydrate content. For CR studies, mice were individually housed. Prior to diet administration, the average daily consumption (by weight) of the AIN-93G control diet was determined. Upon experimental diet initiation, control mice were fed daily with the determined average daily food consumption weight, and calorie restricted mice were fed daily with a food weight corresponding to 40% of the control caloric consumption. The lard-based KD (Envigo TD.170112) was formulated by eliminating carbohydrates, reducing the protein component, and increasing fat content through the addition of lard and soybean oil. KD-Palm (Envigo TD.200399) was formulated by replacing the lard from the standard KD with palm oil. For KD studies, both control and KD groups were fed ad libitum. Average daily food consumption by weight and calories was measured over three days.
Inhibitors.
A939572 (Tocris 4845), GSK2194069 (Tocris 5303), PF-05175157 (Tocris 5790), and rotenone (Selleck Chemicals S2348) were used at the indicated concentrations.
Plasmids and generation of stable cDNA expressing cells.
For overexpression of SCD with a C-terminal HA tag, a lentivirus vector pLV[Exp]-Neo-CMV>hSCD/HA was constructed and ordered from VectorBuilder. tet-pLKO-Neo was used as an empty vector control. Stable cDNA expressing cell lines were generated by lentivirus infection for 24 h, followed by selection in DMEM containing 800 μg/ml G418. After selection, cells were maintained in 400 μg/ml G418 until used in experimental assays.
Blood glucose and plasma hormone measurements.
Blood glucose levels were measured using a Contour glucose meter (Ascensia Diabetes Care). Blood glucose from CR studies was assayed ~20–24 hours after the previous meal. Blood glucose from KD studies was assayed at 8:00 am. Plasma insulin for CR and KD studies was sampled after a 4 h fast and was measured with an ultra-sensitive mouse insulin ELISA (Crystal Chem #90080). Plasma glucagon, FGF21, and corticosterone were measured using a glucagon ELISA (R&D Systems DGCG0), an FGF21 ELISA (R&D Systems MF2100), and a corticosterone parameter assay (R&D Systems KGE009).
Tumor, plasma, and tumor interstitial fluid metabolite extraction.
For tumors, frozen tissues were ground into powder using a mortar and pestle. Tissue powder was then weighed into glass vials (Thermofisher C4010-1, C4010-60BLK). Blood collected from animals was immediately placed in EDTA tubes (Sarstedt 41.1395.105) and centrifuged to separate plasma. Tumor interstitial fluid (TIF) was harvested as previously described3. For absolute quantification of polar metabolites in biofluids, plasma or TIF was mixed 1:1 with a solution of isotopically labeled amino acids, pyruvate, lactate, and β-hydroxybutyrate at known concentrations (Cambridge Isotope Laboratories, MSK-A2-1.2, CNLM-3819-H, CLM-1822-H, CLM-2440, CLM-10768, CLM-3853) in glass vials. Metabolites were extracted in 1.5 ml dichloromethane:methanol (containing 25 mg/L butylated hydroxytoluene, Millipore Sigma B1378):0.88% KCl (w/v) (8:4:3), vortexed for 15 min, and centrifuged at maximum speed for 10 min. The extraction buffer contained 0.75 μg/ml norvaline and either 0.7 μg/ml tridecanoic acid or 0.7 μg/ml cis-10-heptadecenoic acid as internal standards. Polar metabolites (aqueous fraction) were transferred to Eppendorf tubes, dried under nitrogen gas, and stored at −80°C until further analysis. Lipids (organic fraction) were transferred to glass vials, dried under nitrogen gas, and immediately processed for analysis.
For glucose measurements in TIF, TIF was mixed 1:1 with a solution of isotopically labeled glucose at a known concentration (Cambridge Isotope Laboratories, CLM-1396). Samples were extracted in 300 μl of ice cold HPLC grade methanol, vortexed for 10 min, and centrifuged at maximum speed for 10 min. 280 μl of each extract was removed, dried under nitrogen gas, and stored at −80°C until further analysis.
Cell culture isotopic labeling experiments and metabolite extraction.
Cell lines were seeded at an initial density of 50,000–120,000 cells/well in a six-well dish in 2 mL of DMEM medium. Cells were incubated for 24 h and then washed three times with 2 mL of PBS. Cells were then incubated for 24 or 48 h in the indicated media and drug conditions. For β-OHB isotope labeling experiments, cells were cultured in the presence of 5 mM [U-13C4]-β-OHB (Cambridge Isotope Laboratories, CLM-3853) for 24 h. To determine fatty acid synthesis rates, cells were cultured in the presence of 10 mM [U-13C6]-glucose (Cambridge Isotope Laboratories, CLM-1396) and 1 mM [U-13C5]-glutamine (Cambridge Isotope Laboratories, CLM-1822-H) for 24 hours prior to fatty acid analysis.
Following the indicated treatments, media was aspirated from cells, and cells were rapidly washed in ice cold saline three times. The saline was aspirated, and 700 μl of methanol (containing 25 mg/L butylated hydroxytoluene, Millipore Sigma B1378):0.88% KCl (w/v) (4:3) was added. Cells were scraped on ice, the extract was transferred to glass vials (Thermofisher C4010-1, C4010-60BLK), and 800 μl of dichloromethane was added. The final extraction buffer contained 0.75 μg/ml norvaline and either 0.7 μg/ml tridecanoic acid or 0.7 μg/ml cis-10-heptadecenoic acid as internal standards. The resulting extracts were vortexed for 15 min and centrifuged at maximum speed for 10 min. Lipids (organic fraction) were transferred to glass vials, dried under nitrogen gas, and immediately processed for analysis.
Gas chromatography-mass spectrometry (GC-MS) analysis of polar metabolites.
Polar metabolites were analyzed by GC-MS as described previously31. Dried and frozen metabolite extracts were derivatized with 16 μl of MOX reagent (Thermo Fisher TS-45950) for 60 min at 37°C, followed by derivatization with 20 μl of N-tert-butyldimethylsilyl-N-methyltrifluoroacetamide with 1% tert-butyldimethylchlorosilane (Millipore Sigma 375934) for 30 min at 60°C. Derivatized samples were analyzed by GC-MS, using a DB-35MS column (Agilent Technologies 122–3832) installed in an Agilent 7890B gas chromatograph coupled to an Agilent 5997B mass spectrometer. Helium was used as the carrier gas at a constant flow rate of 1.2 mL/min. One microliter of sample was injected in split mode (1:10) at 270°C. After injection, the GC oven was held at 100°C for 1 min, increased to 105°C at 2.5°C/min, held at 105°C for 2 min, increased to 250°C at 3.5°C/min, and then ramped to 320°C at 20°C/min. The MS system operated under electron impact ionization at 70 eV, and the MS source and quadrupole were held at 230°C and 150°C, respectively. The detector was used in scanning mode with an ion range of 100–650 m/z. Total ion counts were determined by integrating appropriate ion fragments for each metabolite31 using El-Maven software (Elucidata). Mass isotopologue distributions were corrected for natural abundance using IsoCorrectoR32. Metabolite data was normalized to the internal standard and biofluid volumes/tissue weights. Absolute concentrations of metabolites were calculated based on the known concentrations of isotopically labeled internal standards.
Glucose in tumor interstitial fluid was analyzed by GC-MS as described previously33. Dried and frozen metabolite extracts were derivatized with 50 μl of 2% (w/v) hydroxylamine hydrochloride in pyridine (Millipore Sigma) for 60 min at 90°C, followed by derivatization with 100 μl of propionic anhydride (Millipore Sigma) for 30 min at 60°C. Derivatized samples were then dried under nitrogen gas and resuspended in 100 μl of ethyl acetate (Millipore Sigma) in glass GC-MS vials. Samples were analyzed by GC-MS as described above, except helium was used as the carrier gas at a constant flow rate of 1.1 mL/min, and one microliter of sample was injected in splitless mode at 250°C. After injection, the GC oven was held at 80°C for 1 min, ramped to 280°C at 20°C/min, and held at 280°C for 4 min.
Gas chromatography-mass spectrometry (GC-MS) analysis of fatty acid methyl esters.
Fatty acid methyl esters (FAMEs) were analyzed by GC-MS. Dried lipid extracts were resuspended in 100 μl of toluene in glass vials and derivatized with 200 μl of 2% sulfuric acid in methanol overnight at 50°C. After derivatization, 500 μl of 5% NaCl was added, and FAMEs were extracted twice with 500 μl of hexane. Samples from cultured cell lines were dried under nitrogen gas, resuspended in 50 μl of hexane, and analyzed by GC-MS. Samples from animal tissues or biofluids were cleaned up with Bond Elut LRC-Florisil columns (Agilent Technologies 12113049). Columns were pre-conditioned with 3 mL of hexane, and then the FAME extracts in hexane were added to the column. FAMEs were finally eluted twice with 1 ml of hexane:diethyl ether (95:5 v/v), dried under nitrogen gas, and resuspended in hexane for GC-MS analysis. GC-MS was conducted with a DB-FastFAME column (Agilent Technologies G3903-63011) installed in an Agilent 7890A gas chromatograph coupled to an Agilent 5975C mass spectrometer. Helium was used as the carrier gas at a constant pressure of 14 psi. One microliter of sample was injected in splitless mode at 250°C. After injection, the GC oven was held at 50°C for 0.5 min, increased to 194°C at 25°C/min, held at 194°C for 1 min, increased to 245°C at 5°C/min, and held at 245°C for 3 min. The MS system operated under electron impact ionization at 70 eV, and the MS source and quadrupole were held at 230°C and 150°C, respectively. The detector was used in scanning mode with an ion range of 104–412 m/z. Total ion counts were determined by integrating appropriate ion fragments for each FAME using El-Maven software (Elucidata). Metabolite data was background corrected using a blank sample and normalized to the internal standard and biofluid volumes/tissue weights. Mass isotopologue distributions were corrected for natural abundance using IsoCorrectoR32. Absolute concentrations of fatty acids were calculated based on an external standard curve using the Supelco 37 Component FAME Mix (Millipore Sigma CRM47885). For calculation of relative fatty acid synthesis rates, the mass isotopologue distributions and total pool sizes of detected fatty acids were used in the fatty acid source analysis (FASA) script as previously described34. Raw data for fatty acid synthesis rate calculations are shown in Supplementary Table 1.
Proliferation assays.
Cells were seeded at an initial density of 20,000–40,000 cells/well in a 24-well dish in 1 mL of DMEM medium. Cells were incubated for 24 h, and cell number was assayed using sulforhodamine B staining, as previous described35, to establish the number of cells at the start of the experiment. Cells were then washed three times with 0.5 mL of PBS and incubated for 72 h in 1 mL of the indicated media and drug conditions. For evaluating the effects of changing media glucose concentrations on cell proliferation, media was changed daily to avoid depletion of glucose in the media. The number of cells at the end of the experiment was assayed using sulforhodamine B staining. Proliferation rate was determined using the following formula: Proliferation rate (doublings/day) = [Log2(Final Day 3 cell number/Initial Day 0 cell number)]/3 days.
Preparation of de-lipidated fetal bovine serum and bovine serum albumin-fatty acid (BSA-FA) conjugates.
Fetal bovine serum was stripped of lipids as previously described to generate de-lipidated cell culture media14. Exogenous fatty acids were supplemented in de-lipidated media as BSA-FA conjugates. Stock solutions of 0.17 mM BSA (0.17 mM), 0.17 mM BSA/1 mM 16:0, 0.17 mM BSA/1 mM 18:1(n-9), and 0.17 mM BSA/1 mM 18:2(n-6) were prepared as described by the Seahorse Bioscience protocol for the XF Analyzer. Solutions were filter-sterilized prior to addition to cell culture media at the indicated concentrations.
Immunohistochemistry.
5 μm sections from formalin fixed, paraffin embedded tumors were stained with antibodies against Ki67 (Biocare Medical CRM325C, clone SP6, 1:50) or cleaved caspase 3 (Cell Signaling Technology 9664, clone 5A1E, 1:800) using standard techniques. Ki67 or cleaved caspase 3 positivity was quantified using the positive pixel count algorithm in Aperio ImageScope.
Immunoblotting.
Powdered tumor tissue was lysed in radioimmunoprecipitation assay (RIPA) buffer (Boston BioProducts BP-115-250) supplemented with Halt Protease and Phosphatase Inhibitor Cocktail (Thermo Fisher 78442) for 15 min at 4°C. Cell extracts were pre-cleared by centrifugation at maximum speed for 10 min at 4°C, and protein concentration was measured with the Pierce BCA Protein Assay Kit (Thermo Scientific). For detection of SCD, lysates were not boiled. Lysates were resolved on SDS-PAGE and transferred electrophoretically to 0.2 μm nitrocellulose membranes (Bio-Rad) at 100 V for 60 min. The blots were blocked in Tris-buffered saline buffer (TBST; 10 mmol/L Tris-HCl, pH 8, 150 mmol/L NaCl, and 0.2% Tween-20) containing 5% (w/v) nonfat dry milk for 1 h, and then incubated with the specific primary antibody diluted in blocking buffer at 4°C overnight. Membranes were washed three times in TBST and incubated with HRP-conjugated secondary antibody for 1 h at room temperature. Membranes were washed three times and developed using enhanced chemiluminescence (Perkin-Elmer). Antibodies were used as follows: mouse Scd1 (Cell Signaling Technology 2438, 1:1000), human SCD (Abcam ab19862, clone CD.E10, 1:1000), HA-tag (Cell Signaling Technology 3724, clone C29F4, 1:1000), SREBP-1 (Santa Cruz sc-13551, clone 2A4, 1:500), p-AKT S473 (Cell Signaling Technology 4060, clone D9E, 1:1000), AKT (Cell Signaling Technology 4691, clone C67E7, 1:1000), β-actin (Cell Signaling Technology 8457, clone D6A8, 1:5000), Vinculin (Cell Signaling Technology 13901, clone E1E9V, 1:1000), anti-rabbit IgG HRP-linked secondary antibody (Cell Signaling Technology 7074, 1:5000), and anti-mouse IgG HRP-linked secondary antibody (Cell Signaling Technology 7076, 1:5000). The mouse Scd1 antibody (Cell Signaling Technology 2438) was validated to preferentially recognize mouse Scd1 over human SCD, whereas the human SCD antibody (Abcam ab19862) was validated to only recognize human SCD. Western blots were quantified by densitometry using ImageJ; data are normalized to the loading control. Uncropped versions of all Western blots are shown in Supplementary Figures 1–23.
Statistics and reproducibility.
Sample sizes, reproducibility, and statistical tests used for each figure are denoted in the figure legends. All graphs were generated using Graphpad Prism 9.
Patient Populations studied.
We examined the associations of low-carbohydrate diet and macronutrient intake with survival among patients with pancreatic cancer. These analyses were performed using data from two ongoing longitudinal US cohorts, the Nurses’ Health Study (NHS) and Health Professionals Follow-Up Study (HPFS)36–38. In brief, the NHS was initiated in 1976, enrolling 121,700 female registered nurses aged 30 to 55 years36,37. The HPFS began in 1986, when 51,529 male healthcare professionals between 40 and 75 years of age were included38. The study protocols were approved by the Institutional Review Boards of the Brigham and Women’s Hospital and Harvard T. H. Chan School of Public Health (Boston, MA), and those of participating registries as required. Investigators obtained written informed consent from participants to further retrieve medical records. After excluding patients with non-adenocarcinoma histology, 1,165 eligible patients were included in analyses.
Ascertainment of Diet in Patients.
Starting from 1980, a food frequency questionnaire (FFQ) was included in the NHS for dietary assessment, and with expanded 131-item FFQs administered in 1984, 1986 and quadrennially thereafter. In HPFS, participants were queried to answer the quadrennial 131-item FFQs starting in 1986. FFQ items included how often on average during the previous year participants consumed each food of a specified standardized portion size or a commonly used unit, with 9 response options ranging from “never or <1 time per month” to “≥6 times per day”. The average daily intake of nutrients was calculated by multiplying the consumption frequency of each food item by its nutrient content (based on the US Department of Agriculture Nutrient Database and supplemented by other published sources) and then summing across all items. The validity and reproducibility of FFQs in measuring dietary information and the estimated nutrient intake in both cohorts have been reported elsewhere39–45. Macronutrient intake was calculated as percentage of total energy consumption. Overall, animal-based and plant-based low-carbohydrate dietary pattern scores were evaluated, as previously described46–48. In sum, the percentages of energy intake from macronutrients (carbohydrate, fat, and protein) were divided into 11 categories with equal sample sizes. The carbohydrate categories were scored from 10 (lowest intake) to 0 (highest intake), whereas fat and protein categories were scored from 0 (lowest intake) to 10 (highest intake). Overall low-carbohydrate diet score, ranging from 0 (the lowest intake of fat and protein and the highest carbohydrate intake) to 30 (the highest intake of fat and protein, and the lowest carbohydrate intake), was calculated by summing the carbohydrate, fat, and protein scores. The same scores were created according to protein and fat from animal and plant sources separately. Specifically, to calculate plant-based low-carbohydrate diet scores, the percentages of energy from carbohydrate, plant protein, and plant fat were considered. For animal-based low carbohydrate diet scores, percentages of energy from carbohydrate, animal protein, and animal fat were used in calculations.
Ascertainment of Human Pancreatic Cancer Cases.
Physician-diagnosed incident cases of pancreatic cancer were reported biennially by participants via questionnaires or identified during follow-up of participant deaths. Study physicians (blinded to exposure status) reviewed medical records and pathology reports with participants’ permission to confirm diagnoses, disease stage, and histologic findings. Investigators referred to state cancer registry data when medical records were unavailable.
Ascertainment of Patient Study Participant Deaths.
Deaths were ascertained through next-of-kin reporting, postal authorities, and the National Death Index, with an identifying rate exceeding 96%49,50. Investigators accessed death certificates and medical records with permission from next of kin of dead participants.
Ascertainment of Covariates in Patient Population Studies.
Covariates were selected a priori as potential confounders. We considered age at diagnosis (continuous), sex (women, men), race/ethnicity (white, black, other, unknown), diagnosis period (1986–1999, 2000–2014), stage at diagnosis (localized, locally advanced, metastatic, unknown), smoking status (never, past, current, unknown), alcohol intake (never, 1–3 drinks/month, 1–6 drinks/week, ≥1 drinks/day, unknown), physical activity (continuous), BMI (continuous), and diabetes status at diagnosis (no diabetes or unreported, short-term (≤4 years), long-term (>4 years)) as covariates in multivariable analyses. Demographics were collected at enrollment in both cohorts. Self-administered biennial (for anthropometric measurements, lifestyle characteristics, and medical history, etc.) or quadrennial (for diet) questionnaires were sent to participants throughout follow-up, achieving cumulative follow-up rates exceeding 90% of potential person-time. The validity and reproducibility of information on covariates have previously been described40–44,51.
Patient Population Statistical Analysis.
Overall survival was calculated from the date of pancreatic cancer diagnosis until the date of death or the end of the study period (defined as 2014 for both cohorts) if a patient was still alive. We performed pooled analyses in the combined dataset of the NHS and HPFS given no statistically significant heterogeneity by cohort was detected for exposures. Cox proportional hazard models were used to estimate age- and multivariable-adjusted hazard ratios (HRs) and 95% confidence intervals (95%CIs) of the associations between low-carbohydrate diet scores (in quartiles) and macronutrient intakes (in quartiles) and overall survival. We calculated the average low-carbohydrate diet scores and macronutrient intake for each participant using FFQs returned in the up to 20 years before diagnosis to better represent long-term dietary exposures and to reduce measurement error, except for those with implausible energy intakes (<600 or >3500 kcal/day for women, <800 or >4200 kcal/day for men). The proportionality assumption was verified using interactions between exposures and the (log-)time scale, and we observed no violation. Population-based data analyses were conducted using SAS software, version 9.4 for UNIX (SAS Institute Inc., Cary, NC). All tests were 2-sided, with P values for trend <.05 indicating statistical significance.
Data Availability.
All data generated or analyzed during this study are included in this published article and in Supplementary Table 1, Supplementary Figures 1–23, and Source Data for Figures 1–4 and Extended Data Figures 1–8. Correspondence and requests for materials should be addressed to Matthew G. Vander Heiden (mvh@mit.edu).
Extended Data
Extended Data Figure 1. Caloric restriction, but not the ketogenic diet, impairs growth of tumor allografts.
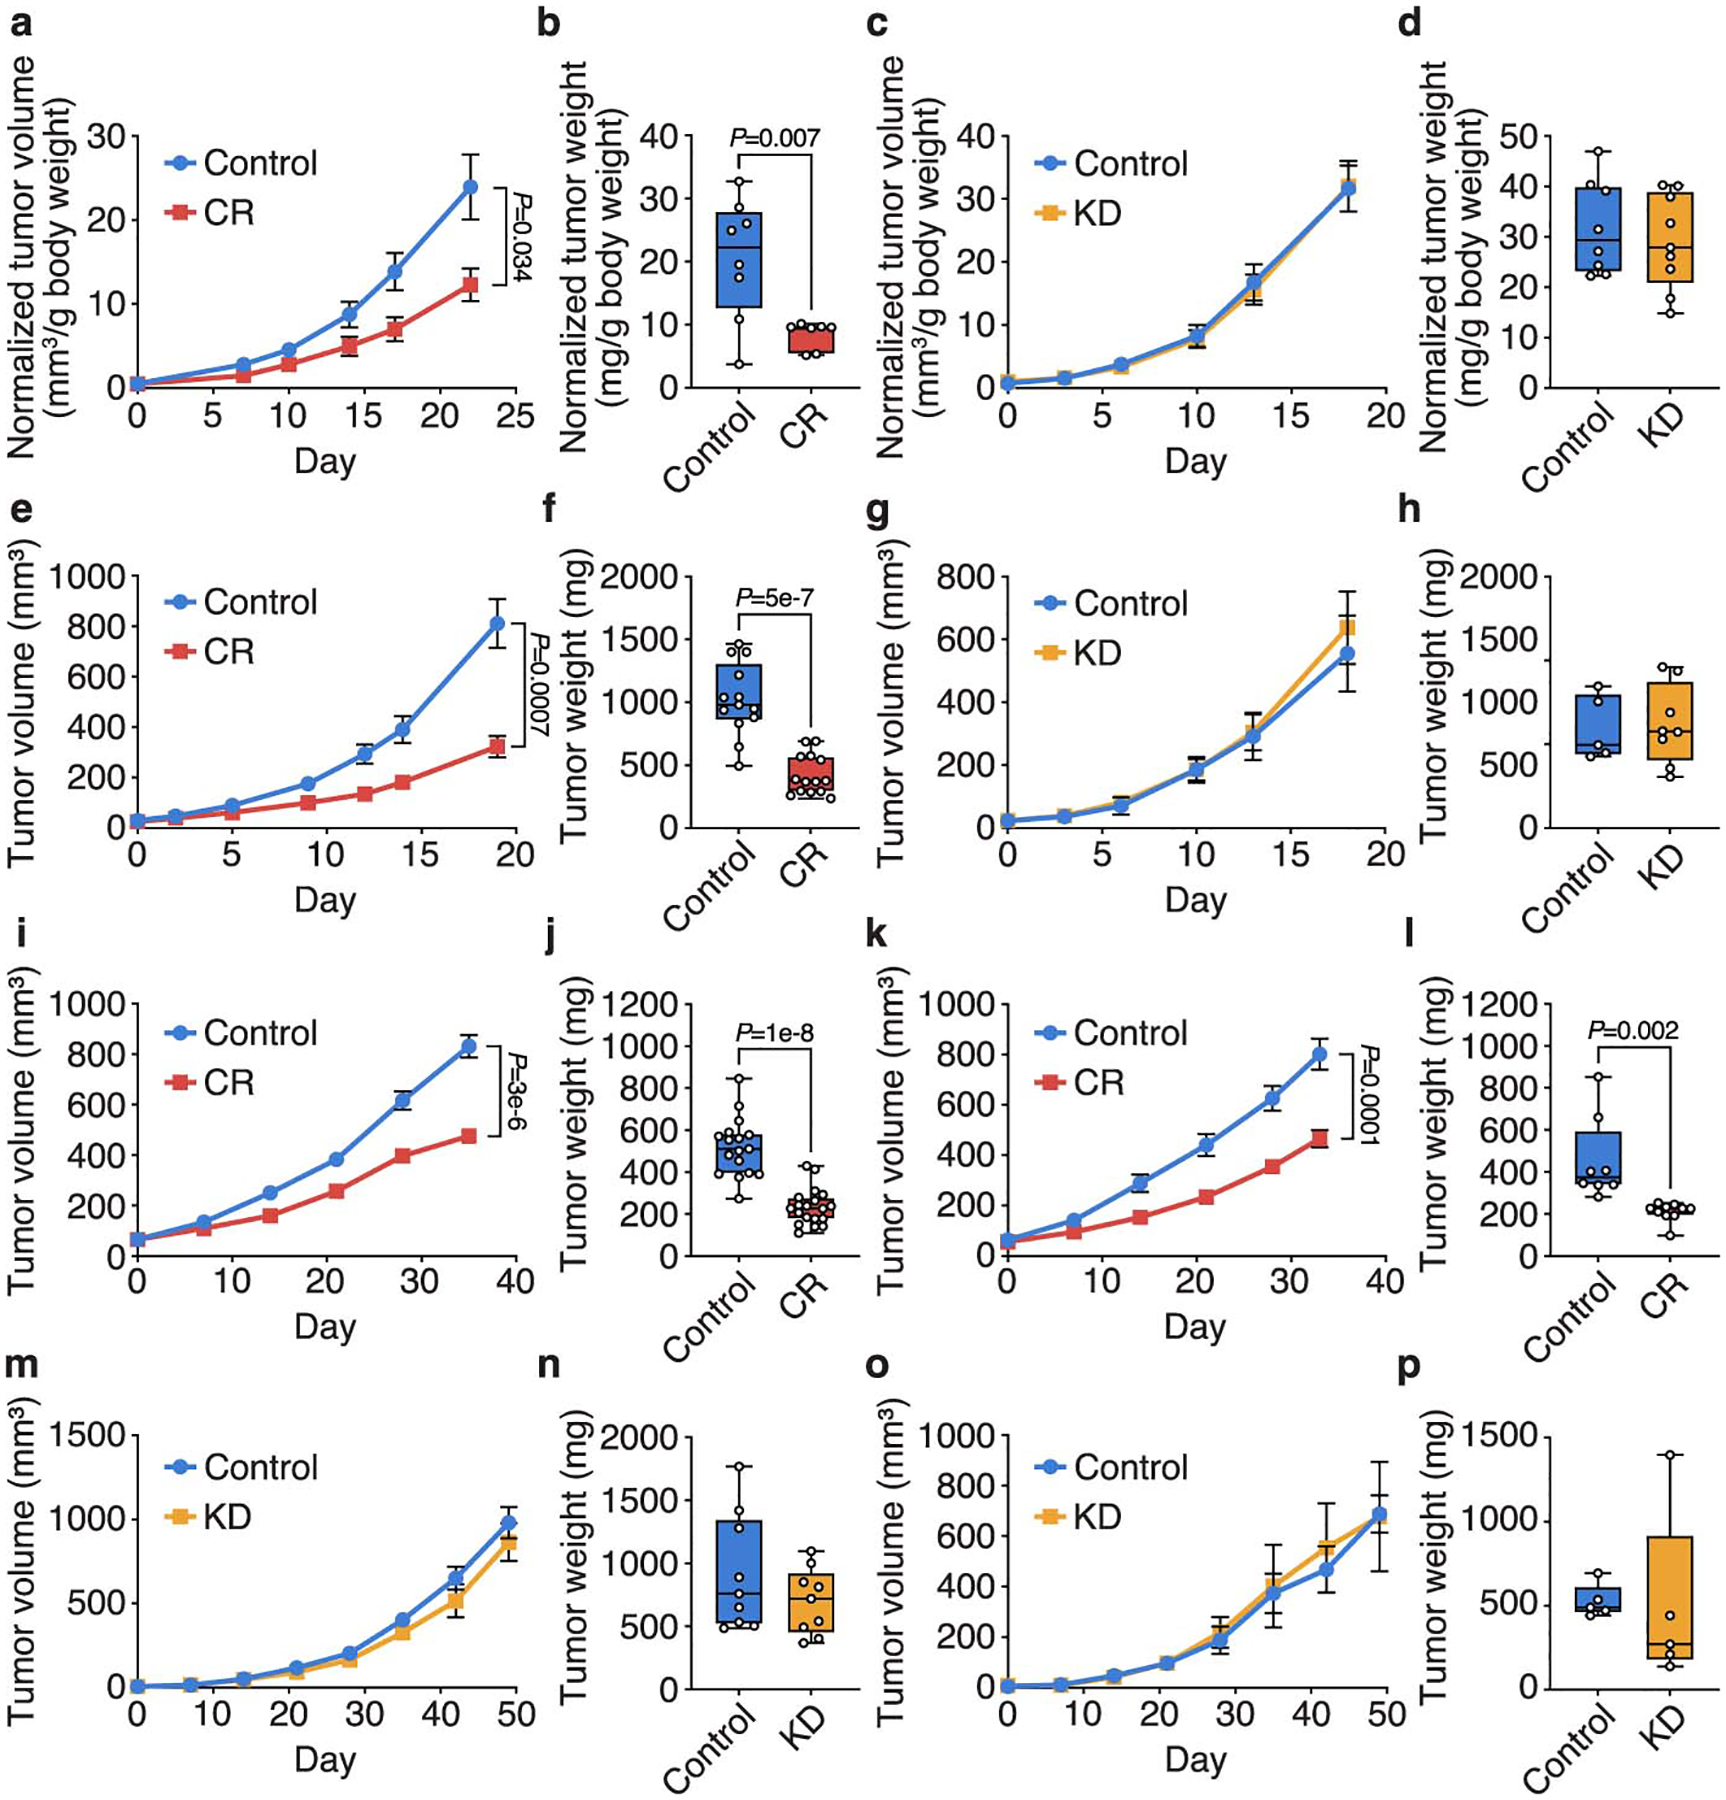
a-d, Normalized tumor volumes (a,c) and normalized tumor weights (b,d) of subcutaneous AL1376 PDAC allografts in male mice exposed to CR or a control diet (a,b), or the KD or a control diet (c,d). Tumor volumes and weights normalized to animal body weight are shown. (a,b) Control n = 5 mice, CR n = 4 mice; (c,d) Control n = 5 mice, KD n = 5 mice. e-h, Tumor volumes (e,g) and tumor weights (f,h) of subcutaneous AL1376 PDAC allografts in female mice exposed to CR or a control diet (e,f), or the KD or a control diet (g,h). (e,f) Control n = 8 mice, CR n = 8 mice; (g,h) Control n = 4 mice, KD n = 4 mice. i-l, Tumor volumes (i,k) and tumor weights (j,l) of subcutaneous LGSP non-small cell lung cancer (NSCLC) allografts in male (i,j) and female (k,l) mice exposed to CR or a control diet. (i,j) Control n = 10 mice, CR n = 11 mice; (k,l) Control n = 5 mice, CR n = 5 mice. m-p, Tumor volumes (m,o) and tumor weights (n,p) of subcutaneous LGSP NSCLC allografts in male (m,n) and female (o,p) mice exposed to KD or a control diet. (m,n) Control n = 5 mice, KD n = 5 mice; (o,p) Control n = 3 mice, KD n = 3 mice. Data are presented as box-and-whisker plots displaying median, interquartile range (boxes), and minima and maxima (whiskers) (b,d,f,h,j,l,n,p) or mean ± SEM (a,c,e,g,i,k,m,o). Comparisons were made using a two-tailed Student’s t-test (b,d,f,h,j,l,n,p) or two-way repeated measures analysis of variance (ANOVA) (a,c,e,g,i,k,m,o).
Extended Data Figure 2. Caloric restriction and the ketogenic diet have distinct effects on whole-body physiology.
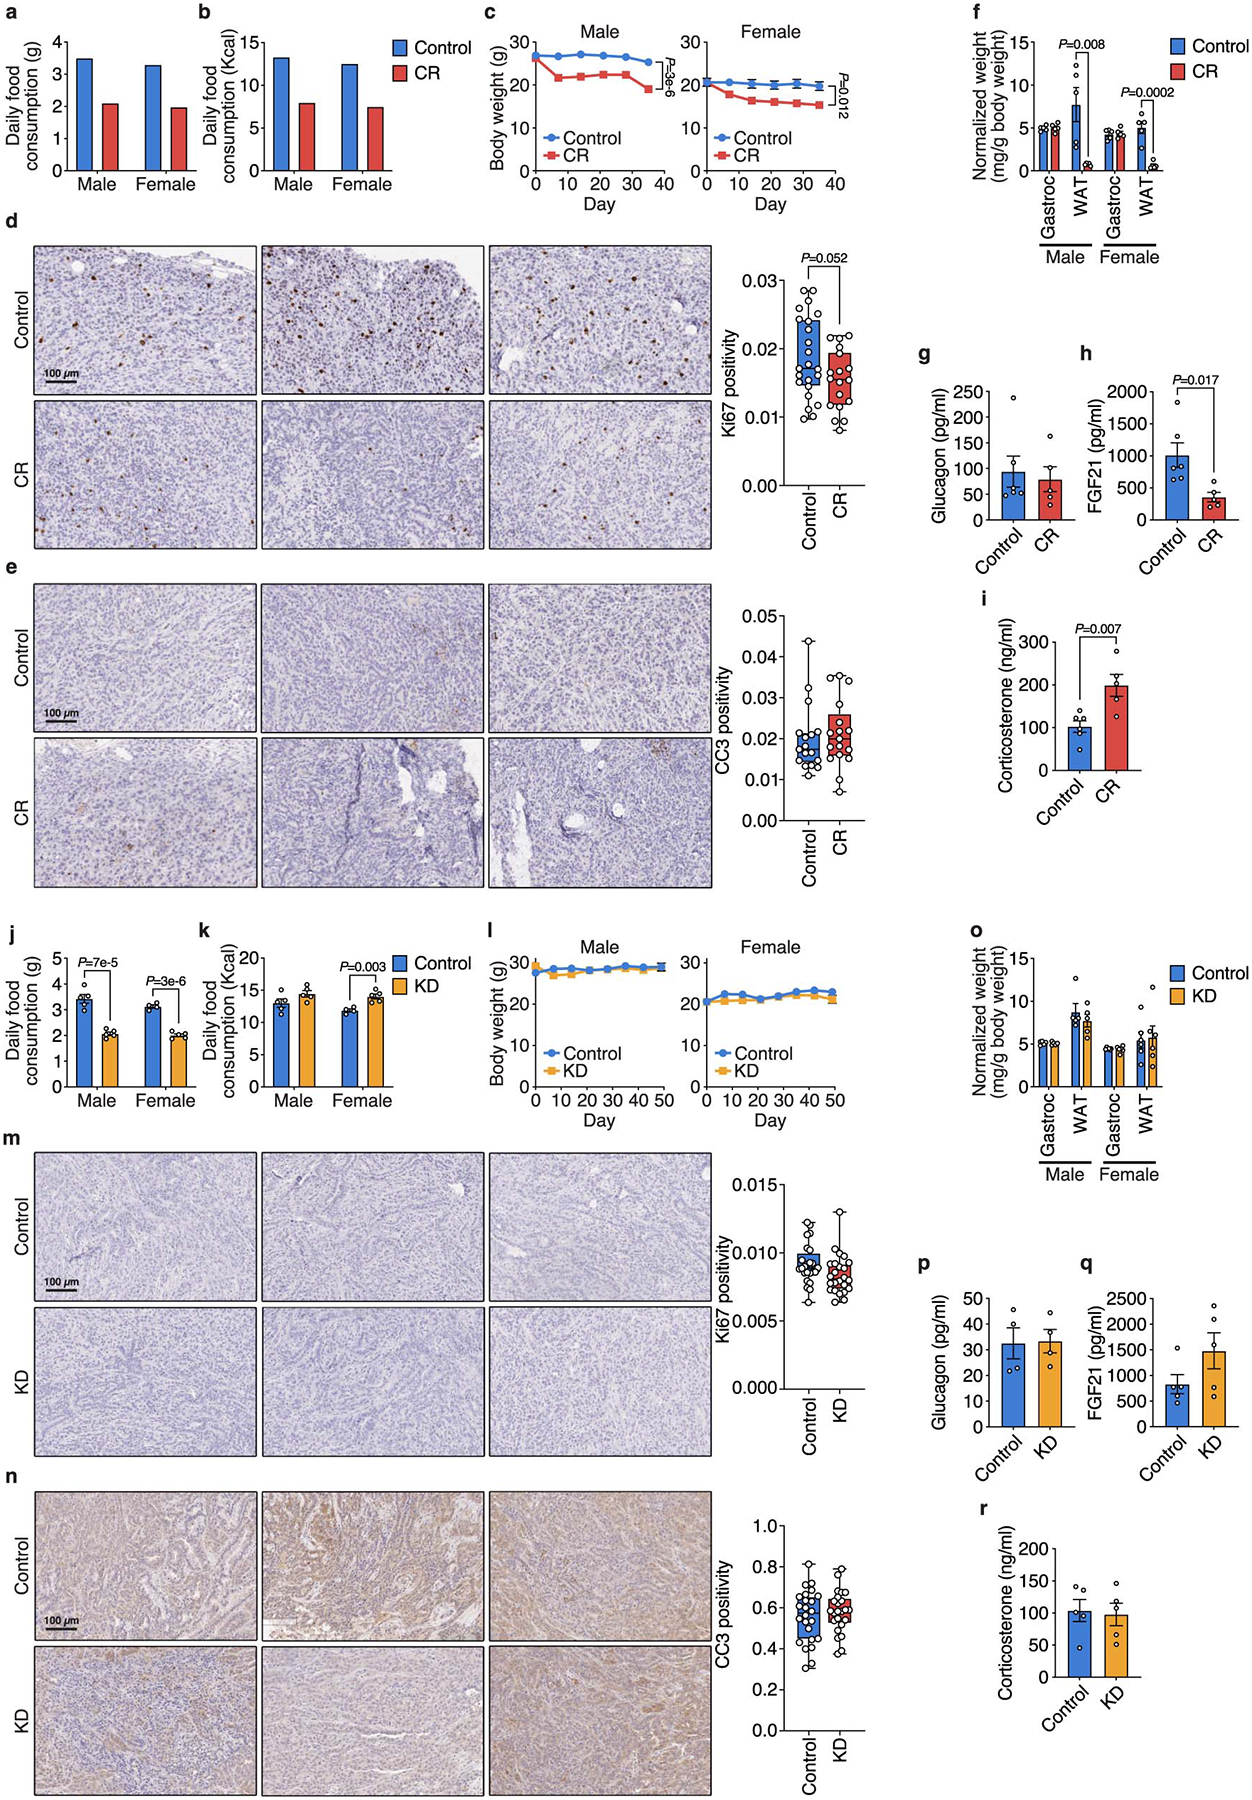
a, b, Daily food consumption by weight (a) and daily caloric consumption (b) of the control diet and CR by male and female mice. c, Body weights of male and female mice exposed to CR or a control diet. Male Control n = 10, Male CR n = 11, Female Control n = 5, Female CR n = 5. d, e, Ki67 (d) and cleaved caspase 3 (CC3) (e) immunohistochemical staining in subcutaneous AL1376 tumors from mice exposed to a control or CR diet. n = 3 tumors per group. 5–8 independent fields from each tumor were quantified: Control n = 23, CR n = 18 (d); n = 17 per group (e). f, Weights of gastrocnemius muscle (Gastroc) and white adipose tissue (WAT) in male and female mice exposed to CR or a control diet. Tissue weights normalized to animal body weight are shown. n = 5 per group. g-i, Plasma glucagon (g), FGF21 (h), and corticosterone (i) levels in male mice exposed to CR or a control diet. Control n = 6, CR n = 5. j, k, Daily food consumption by weight (j) and daily caloric consumption (k) of the control diet and KD by male and female mice. Male Control n = 5, Male KD n = 5, Female Control n = 4, Female KD n = 5. l, Body weights of male and female mice exposed to KD or a control diet. Male Control n = 5, Male KD n = 5, Female Control n = 3, Female KD n = 3. m, n, Ki67 (m) and CC3 (n) immunohistochemical staining in subcutaneous AL1376 tumors from mice exposed to a control diet or the KD. n = 3 tumors per group. 5–8 independent fields from each tumor were quantified: n = 24 per group (m, n). o, Weights of Gastroc and WAT in male and female mice exposed to KD or a control diet. Tissue weights normalized to animal body weight are shown. Male Control n = 5, Male KD n = 5, Female Control n = 6, Female KD n = 6. p-r, Plasma glucagon (p), FGF21 (q), and corticosterone (r) levels in male mice exposed to KD or a control diet. (p) n = 4 per group; (q-r) n = 5 per group. Data are presented as mean ± SEM (a-c,f-l,o-r) or box-and-whisker plots displaying median, interquartile range (boxes), and minima and maxima (whiskers) (d,e,m,n). Comparisons were made using a two-tailed Student’s t-test.
Extended Data Figure 3. β-OHB is metabolized by PDAC cells.
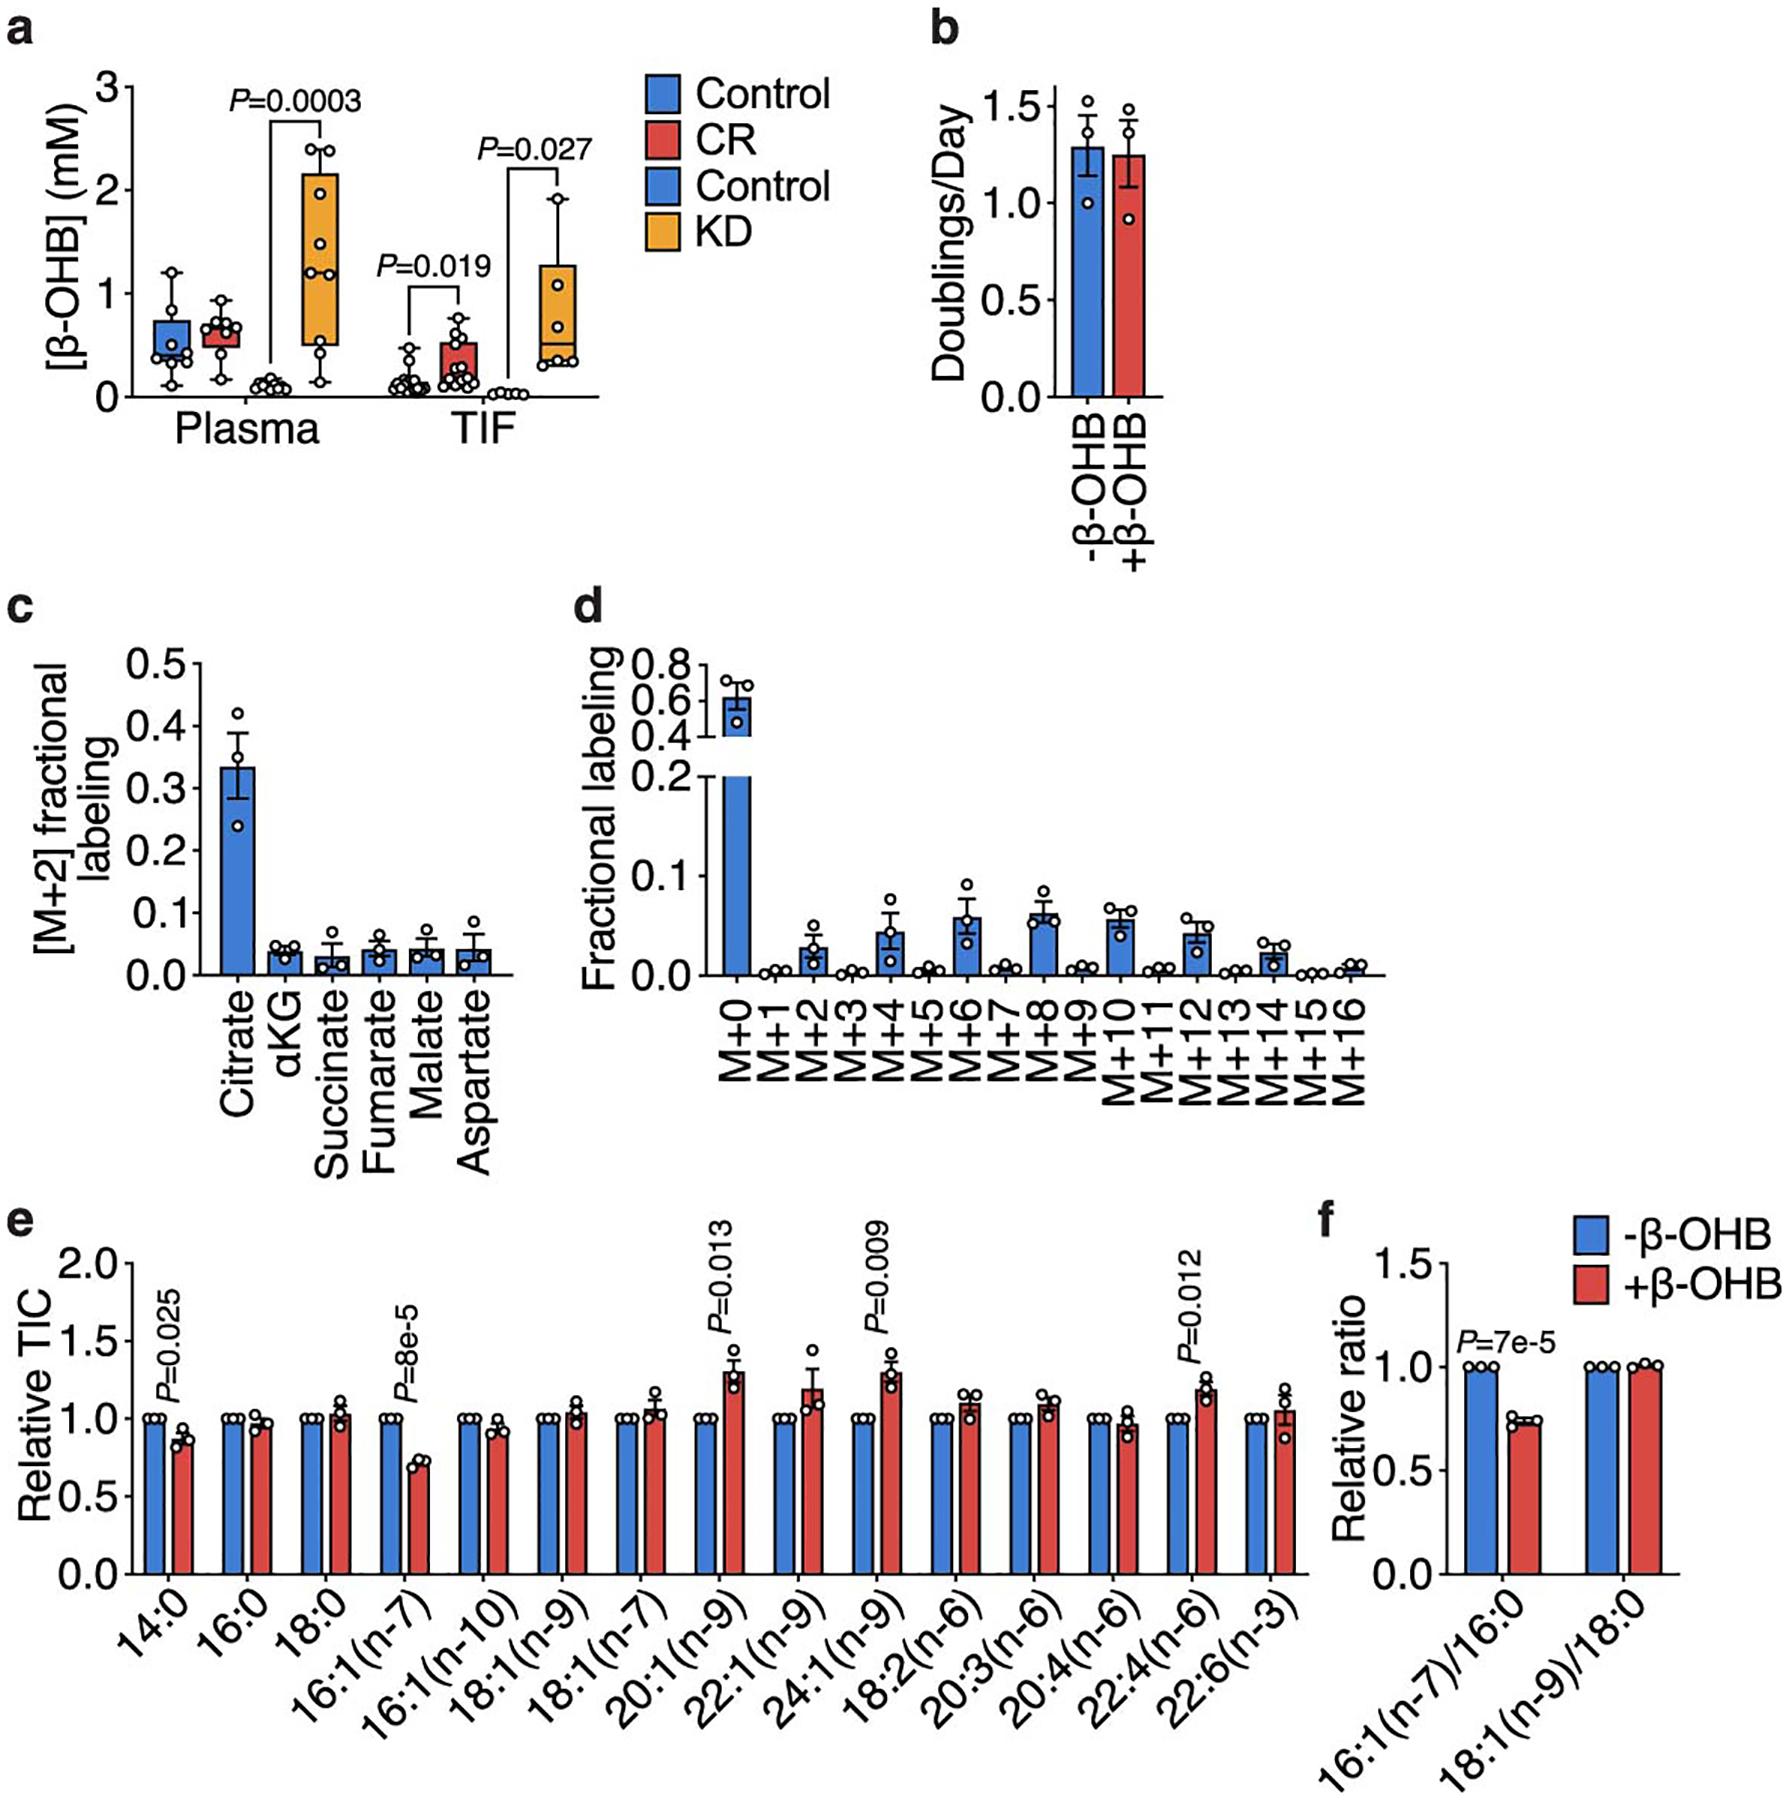
a, Concentrations of β-OHB in plasma and tumor interstitial fluid (TIF) from mice implanted with subcutaneous AL1376 tumors exposed to a control diet, CR, or the KD. Plasma Control (CR cohort) n = 8, Plasma CR n = 8, Plasma Control (KD cohort) n = 10, Plasma KD n = 9, TIF Control (CR cohort) n = 16, TIF CR n = 13, TIF Control (KD cohort) n = 5, TIF KD n = 6. b, Doubling times of AL1376 cells cultured in media with or without 5 mM β-OHB. c, Fractional labeling of [M+2] TCA cycle metabolites from AL1376 cells cultured in the presence of 5 mM [U-13C]-β-OHB for 24 h. d, Mass isotopologue distribution of labeled palmitate from AL1376 cells cultured in the presence of 5 mM [U-13C]-β-OHB for 24 h. e, f, The indicated fatty acid levels (e) and MUFA/SFA ratios (f) measured in AL1376 cells cultured in media with or without 5 mM β-OHB for 24 h. Data are presented as box-and-whisker plots displaying median, interquartile range (boxes), and minima and maxima (whiskers) (a) or mean ± SEM (b-f). Unless otherwise indicated, n = 3 biologically independent replicates, and comparisons were made using a two-tailed Student’s t-test.
Extended Data Figure 4. Increased stearoyl-CoA desaturase activity is required for cancer cells to adapt to exogenous lipid limitation.
a, Levels of the indicated fatty acids in lipidated and de-lipidated fetal bovine serum (FBS). b, Doubling times of the specified cells cultured in media containing lipidated versus de-lipidated serum. c, Fold changes in levels of the indicated fatty acids in cells cultured in de-lipidated versus lipidated media for 24 h. d, Relative fatty acid synthesis rates in the indicated cells cultured in lipidated versus de-lipidated media. A one-tailed Student’s t-test was used for comparison between groups. e, f, Representative mass isotopologue distributions (MIDs) of 16:0 (e) and 18:0 (f) from AL1376 cells labeled with [U-13C]-glucose and [U-13C]-glutamine for 24 h in lipidated versus de-lipidated media. g, h, Representative MIDs of 16:1(n-7) (g) and 18:1(n-9) (h) from AL1376 cells labeled with [U-13C]-glucose and [U-13C]-glutamine for 24 h in lipidated versus de-lipidated media containing 50 nM A939572. MIDs above M+12 are predominantly observed, consistent with a majority of lipogenic acetyl-CoA being derived from glucose and glutamine. i, Immunoblot for the mature activated form of SREBP1 (m-SREBP1) and β-actin in lysates from AL1376 cells cultured in lipidated versus de-lipidated media for 24 h, with or without 50 nM A939572, 50 μM 18:1(n-9), or 50 μM 18:2(n-6). Data is representative of three biologically independent experiments. j, Absolute fatty acid concentrations in AL1376 and LGSP cells cultured in lipidated media. k, l, Ratios of 16:1(n-7)/16:0 (k) and 18:1(n-9)/18:0 (l) in cells cultured in lipidated versus de-lipidated media with or without the SCD inhibitor A939572 (LGSP: 50 nM; HeLa, Panc1, A549: 200 nM) for 24 h. m, n, 16:1(n-7) (m) and 18:1(n-9) (n) synthesis rates in cells cultured in lipidated versus de-lipidated media with or without A939572 (LGSP: 50 nM; HeLa, Panc1, A549: 200 nM) for 24 h as indicated. A one-tailed ratio paired t-test was used for comparison between groups. o, Doubling times of the specified cells cultured in lipidated versus de-lipidated media with the indicated concentrations of A939572. p, Doubling times of LGSP cells cultured in de-lipidated media with or without 50 nM A939572, BSA, 100 μM 18:1(n-9), 100 μM 18:2(n-6), or 15 μM 16:0. q, Doubling times of cells cultured in de-lipidated media containing 200 nM A939572, BSA, or 25 μM 18:2(n-6). r-v, 18:1(n-9) (r), 16:1(n-7) (s), 18:1(n-9)/18:0 (t), 16:1(n-7)/16:0 (u), and 16:0 (v) levels in LGSP cells cultured in de-lipidated media with or without 50 nM A939572, BSA, 100 μM 18:1(n-9), 100 μM 18:2(n-6), or 15 μM 16:0 for 48 h. w, Relative fatty acid synthesis rates in LGSP cells cultured in de-lipidated media containing 50 nM A939572, BSA, 100 μM 18:1(n-9), or 100 μM 18:2(n-6). x, Doubling times of cells cultured in de-lipidated media containing A939572 (LGSP: 50 nM; HeLa, Panc1, A549: 200 nM), the FASN inhibitor GSK2194069 (LGSP: 0.3 μM; HeLa, A549: 0.015 μM; Panc1: 0.05 μM), or the ACC inhibitor PF-05175157 (LGSP: 10 μM; HeLa: 0.3 μM; Panc1: 1 μM; A549: 0.5 μM). A paired two-tailed Student’s t-test was used for comparison between groups in Panc1 and A549 cells. All data are presented as mean ± SEM; unless otherwise indicated, n = 3 biologically independent replicates, and a two-tailed Student’s t-test was used for comparison between groups unless otherwise noted above.
Extended Data Figure 5. Determining whether SCD inhibition affects cancer cell proliferation via NAD+ limitation or changes to cellular fatty acid levels.
a, Doubling times of the indicated cell lines cultured in de-lipidated media with or without 1 mM pyruvate and rotenone (AL1376: 400 nM; LGSP, A549: 100 nM; HeLa, Panc1: 50 nM). b, Doubling times of the indicated cell lines cultured in de-lipidated media containing the indicated concentrations of the SCD inhibitor A939572 and 1 mM pyruvate. c, Doubling times of the indicated cell lines cultured in de-lipidated media with or without 50 nM A939572. d-i, Relative levels of 16:0 (d), 18:0 (e), 16:1(n-7) (f), 18:1(n-9) (g), 16:1(n-7)/16:0 (h), and 18:1(n-9)/18:0 (i) in the indicated cell lines cultured in de-lipidated media with or without 50 nM A939572. j-l, Relative levels of 16:1(n-10) (j), normalized levels of 16:1(n-10)/16:0 (k), and relative levels of 16:1(n-10)/16:0 (l) in the indicated cell lines cultured in de-lipidated media with or without 50 nM A939572. All data are presented as mean ± SEM; n = 3 biologically independent replicates. A two-tailed Student’s t-test was used for comparison between groups.
Extended Data Figure 6. Caloric restriction and the ketogenic diet alter fatty acid composition and SCD activity in tumors.
a, The indicated fatty acid levels measured in subcutaneous AL1376 tumors from mice exposed to a control or CR diet. Control n = 10, CR n = 8. b-d, The indicated fatty acid levels (b,d) and MUFA/SFA ratios (c) measured in subcutaneous AL1376 tumors from male or female mice exposed to a control or CR diet. Male Control n = 6, Male CR n = 4, Female Control n = 4, Female CR n = 4. e-g, The indicated fatty acid levels (e,g) and MUFA/SFA ratios (f) measured in subcutaneous LGSP tumors from male mice exposed to a control or CR diet. Control n = 6, CR n = 6. h-i, Immunoblot and quantification for mouse Scd1 (mSCD1) and vinculin in subcutaneous AL1376 tumors from female mice (h, n = 7 per group) or subcutaneous LGSP tumors from male mice (i, n = 6 per group) exposed to a control or CR diet. j, The indicated fatty acid levels measured in subcutaneous AL1376 tumors from mice exposed to a control diet or KD. Control n = 8, KD n = 9. k-m, The indicated fatty acid levels (k,m) and MUFA/SFA ratios (l) measured in subcutaneous AL1376 tumors from male or female mice exposed to a control diet or KD. Male Control n = 5, Male KD n = 5, Female Control n = 3, Female KD n = 4. n-p, The indicated fatty acid levels (n,p) and MUFA/SFA ratios (o) measured in subcutaneous LGSP tumors from male mice exposed to a control diet or KD. Control n = 6, KD n = 6. q-r, Immunoblot and quantification for mSCD1 and vinculin in subcutaneous AL1376 tumors from female mice (q, Control n = 3, KD n = 4) or subcutaneous LGSP tumors from male mice (r, n = 6 per group) exposed to a control diet or KD. s, AL1376 and LGSP cells were serum-starved in the presence of 1% Lipid Mixture for 16 h followed by insulin stimulation (100 nM) for 3 h. Lysates were immunobloted for mSCD1, p-AKT S473, AKT, and vinculin. Data is representative of three biologically independent experiments. Data are presented as box-and-whisker plots displaying median, interquartile range (boxes), and minima and maxima (whiskers) (a,e-g,j,n-p) or mean ± SEM (b-d,h-i,k-m,q-r). Comparisons were made using a two-tailed Student’s t-test.
Extended Data Figure 7. Exogenous SCD expression partially rescues tumor growth inhibition by caloric restriction.
a, b, Tumor volumes (a) and tumor weights (b) normalized to animal body weight of subcutaneous AL1376 tumors expressing EV or SCD-HA in male mice exposed to a control or CR diet. EV: Control n = 4 mice, EV: CR n = 4 mice, SCD-HA: Control n = 4 mice, SCD-HA: CR n = 4 mice. c, d, Tumor volumes (c) and tumor weights (d) of subcutaneous AL1376 tumors expressing EV or SCD-HA in female mice exposed to a control or CR diet. EV: Control n = 4 mice, EV: CR n = 4 mice, SCD-HA: Control n = 4 mice, SCD-HA: CR n = 4 mice. e, f, Tumor volumes (e) and tumor weights (f) normalized to animal body weight of subcutaneous AL1376 tumors expressing EV or SCD-HA in female mice exposed to a control or CR diet. EV: Control n = 4 mice, EV: CR n = 4 mice, SCD-HA: Control n = 4 mice, SCD-HA: CR n = 4 mice. g, h, Daily food consumption by weight (g) and daily caloric consumption (h) of the control diet and CR by male and female mice. i, j, Tumor weights (i) and tumor weights normalized to animal body weight (j) of subcutaneous LGSP tumors expressing EV or SCD-HA in mice exposed to a control or CR diet. EV: Control n = 6 mice, EV: CR n = 5 mice, SCD-HA: Control n = 6 mice, SCD-HA: CR n = 6 mice. k, Immunoblot for HA, human SCD (hSCD), mouse Scd1 (mSCD1), and vinculin in subcutaneous AL1376 tumors expressing an empty vector (EV) or SCD-HA from mice exposed to a control or CR diet for 18 days. l-n, The indicated MUFA/SFA ratios (l) and fatty acid levels (m-n) measured in subcutaneous AL1376 tumors expressing EV or SCD-HA from mice exposed to a control or CR diet for 18 days. EV: Control n = 6, EV: CR n = 6, SCD-HA: Control n = 6, SCD-HA: CR n = 6. o, Immunoblot for HA, hSCD, mSCD1, and vinculin in subcutaneous AL1376 tumors expressing an empty vector (EV) or SCD-HA from mice exposed to a control or CR diet for 7 days. p-r, The indicated MUFA/SFA ratios (p) and fatty acid levels (q-r) measured in subcutaneous AL1376 tumors expressing EV or SCD-HA from mice exposed to a control or CR diet for 7 days. EV: Control n = 6, EV: CR n = 6, SCD-HA: Control n = 6, SCD-HA: CR n = 6. Data are presented as box-and-whisker plots displaying median, interquartile range (boxes), and minima and maxima (whiskers) (b,d,f,i-j,l-n,p-r) or mean ± SEM (a,c,e,g,h). Comparisons were made using two-way repeated measures analysis of variance (ANOVA) (a,c,e) or a two-tailed Student’s t-test (b,d,f,i-j,l-n,p-r).
Extended Data Figure 8. Changing the fat composition of caloric restriction and the ketogenic diet alters tumor growth and tumor fatty acid composition.
a, b, The indicated fatty acid levels measured in plasma from mice exposed to a control diet, CR, high fat caloric restriction diet consisting of soybean oil (HFCR-Soybean), and high fat caloric restriction diet consisting of palm oil (HFCR-Palm). Control n = 6, CR n = 5, HFCR-Soybean n = 5, HFCR-Palm n = 5. c-e, The indicated fatty acid levels (c,e) and MUFA/SFA ratios (d) measured in subcutaneous AL1376 tumors from mice exposed to a control diet, CR, HFCR-Soybean, or HFCR-Palm. Control n = 7, CR n = 7, HFCR-Soybean n = 7, HFCR-Palm n = 7. f, g, Tumor volumes (f) and tumor weights (g) of subcutaneous LGSP tumors in mice exposed to a control diet, CR, HFCR-Soybean, or HFCR-Palm. Control n = 5 mice, CR n = 6 mice, HFCR-Soybean n = 5 mice, HFCR-Palm n = 6 mice. h-j, The indicated fatty acid levels (h,j) and MUFA/SFA ratios (i) measured in subcutaneous LGSP tumors from mice exposed to a control diet, CR, HFCR-Soybean, or HFCR-Palm. Control n = 6, CR n = 6, HFCR-Soybean n = 6, HFCR-Palm n = 6. k, Tumor weights of subcutaneous LGSP tumors expressing an empty vector (EV) or SCD-HA in mice exposed to a control or KD diet consisting of palm oil (KD-Palm). EV: Control n = 6 mice, EV: KD-Palm n = 6 mice, SCD-HA: Control n = 6 mice, SCD-HA: KD-Palm n = 6 mice. l-n, The indicated fatty acid levels measured in plasma from mice exposed to a control diet or KD-Palm. Control n = 12, KD-Palm n = 12. o-r, The indicated fatty acid levels (o,p,r) and MUFA/SFA ratios (q) measured in subcutaneous AL1376 tumors expressing an EV or SCD-HA from mice exposed to a control diet or KD-Palm. EV: Control n = 6, EV: KD-Palm n = 7, SCD-HA: Control n = 6, SCD-HA: KD-Palm n = 6. Data are presented as box-and-whisker plots displaying median, interquartile range (boxes), and minima and maxima (whiskers) (a-e, g-r) or mean ± SEM (f). Comparisons were made using a two-tailed Student’s t-test (a-e, h-r), a two-way repeated measures analysis of variance (ANOVA) (f), or a one-way ANOVA (g).
Extended Data Table 1.
Compositions of diets used in this study.
| AIN-93G (Control) | Ketogenic Diet (Lard, KD) | Ketogenic Diet (Palm Oil, KD-Palm) | 40% Caloric Restriction (CR) | High Fat Caloric Restriction-Soybean Oil (HFCR-Soybean) | High Fat Caloric Restriction-Palm Oil (HFCR-Palm) | ||
|---|---|---|---|---|---|---|---|
| Protein (g/kg) | Casein | 200 | 171 | 171 | 333.3 | 400 | 400 |
| L-Cystine | 3 | 2.7 | 2.7 | 5 | 6 | 6 | |
| Carbohydrate (g/kg) | Corn Starch | 397.5 | 0 | 0 | 222.4 | 0 | 0 |
| Maltodextrin | 132 | 0 | 0 | 70 | 72.9 | 72.9 | |
| Sucrose | 100 | 0 | 0 | 90 | 36 | 36 | |
| Fat(g/kg) | Lard | 0 | 600 | 0 | 0 | 0 | 0 |
| Soybean Oil | 70 | 100 | 75 | 116.7 | 290 | 30 | |
| Palm Oil | 0 | 0 | 625 | 0 | 0 | 260 | |
| Fatty acid composition (g/kg) | 14:0 | 0.0 | 6.0 | 6.3 | 0.0 | 0.0 | 2.6 |
| 16:0 | 7.7 | 149.0 | 289.5 | 12.8 | 31.9 | 120.3 | |
| 16:1(n-7) | 0.0 | 12.0 | 3.1 | 0.0 | 0.0 | 1.3 | |
| 18:0 | 2.8 | 82.0 | 31.1 | 4.7 | 11.6 | 12.9 | |
| 18:1(n-9) | 16.1 | 257.0 | 261.0 | 26.8 | 66.7 | 108.3 | |
| 18:2(n-6) | 37.1 | 161.0 | 99.1 | 61.9 | 153.7 | 40.6 | |
| 18:3(n-3) | 5.6 | 14.0 | 9.1 | 9.3 | 23.2 | 3.7 | |
| Vitamins and Minerals (g/kg) | Cellulose | 50 | 50 | 50 | 83.3 | 100 | 100 |
| Mineral Mix, AIN-93G-MX | 35 | - | - | 58.3 | 70 | 70 | |
| Mineral Mix, w/o Ca &P | - | 24.6 | 24.6 | - | - | - | |
| Calcium Phosphate | - | 18.8 | 18.8 | - | - | - | |
| Calcium Carbonate | - | 9.1 | 9.1 | - | - | - | |
| Vitamin Mix, AIN-93-VX | 10 | 18.4 | 18.4 | 16.7 | 20 | 20 | |
| Choline Bitartrate | 2.5 | 5.4 | 5.4 | 4.2 | 5 | 5 | |
| TBHQ | 0.014 | 0.02 | 0.02 | 0.023 | 0.06 | 0.06 | |
| Summary (% kcal) | Protein | 18.8% | 8.7% | 8.7% | 31.0% | 30.6% | 30.6% |
| Carbohydrate | 63.9% | 1.0% | 1.0% | 40.6% | 12.1% | 12.1% | |
| Fat | 17.2% | 90.3% | 90.3% | 28.4% | 57.2% | 57.2% | |
| Kcal/g | 3.8 | 7 | 7 | 3.8 | 4.6 | 4.6 |
Extended Data Table 2.
Low-carbohydrate dietary pattern or macronutrient intake and overall survival among 1,165 pancreatic cancer patients in two large cohorts.
| HR (95% Cl) for death | P trend § | ||||
|---|---|---|---|---|---|
| Quartile 1 | Quartile 2 | Quartile 3 | Quartile 4 | ||
| Overall low-carbohydrate dietary pattern | |||||
| Person-months | 2,821 | 2,598 | 3,793 | 2,900 | |
| Cases/deaths | 284/280 | 286/277 | 305/292 | 290/280 | |
| Age-adjusted model* | 1 [reference] | 1.00 (0.85–1.19) | 0.83 (0.71–0.98) | 0.95 (0.81–1.13) | .20 |
| Multivariable model 1† | 1 | 1.02 (0.86–1.21) | 0.84 (0.71–0.99) | 0.88 (0.74–1.04) | .03 |
| Multivariable model 2‡ | 1 | 1.02 (0.86–1.20) | 0.81 (0.68–0.96) | 0.86 (0.72–1.02) | .02 |
| Animal-based low-carbohydrate dietary pattern | |||||
| Person-months | 3,089 | 3,169 | 2,957 | 2,897 | |
| Cases/deaths | 288/284 | 297/283 | 280/272 | 300/290 | |
| Age-adjusted model* | 1 | 0.92 (0.78–1.09) | 0.91 (0.77–1.08) | 0.95 (0.80–1.12) | .52 |
| Multivariable model 1† | 1 | 0.96 (0.81–1.13) | 0.88 (0.74–1.04) | 0.94 (0.79–1.11) | .33 |
| Multivariable model 2‡ | 1 | 0.95 (0.81–1.13) | 0.87 (0.73–1.03) | 0.92 (0.78–1.10) | .25 |
| Plant-based low-carbohydrate dietary pattern | |||||
| Person-months | 2,658 | 2,442 | 2,826 | 4,186 | |
| Cases/deaths | 291/283 | 293/286 | 282/275 | 299/285 | |
| Age-adjusted model* | 1 | 1.02 (0.87–1.20) | 0.95 (0.81–1.13) | 0.84 (0.71–1.00) | .03 |
| Multivariable model 1† | 1 | 1.11 (0.94–1.31) | 1.01 (0.86–1.20) | 0.88 (0.75–1.04) | .08 |
| Multivariable model 2‡ | 1 | 1.10 (0.93–1.30) | 1.00 (0.84–1.18) | 0.86 (0.73–1.02) | .05 |
| Total fat | |||||
| Person-months | 2,542 | 3,229 | 3,273 | 3,068 | |
| Cases/deaths | 291/285 | 291/281 | 292/279 | 291/284 | |
| Age-adjusted model* | 1 | 0.87 (0.74–1.03) | 0.85 (0.72–1.01) | 0.96 (0.81–1.13) | .58 |
| Multivariable model 1† | 1 | 0.93 (0.78–1.10) | 0.86 (0.72–1.02) | 0.85 (0.71–1.02) | .05 |
| Multivariable model 2‡ | 1 | 0.92 (0.77–1.09) | 0.83 (0.70–0.99) | 0.84 (0.71–1.01) | .03 |
| Animal fat | |||||
| Person-months | 2,943 | 3,171 | 3,297 | 2,701 | |
| Cases/deaths | 291/279 | 291/279 | 292/286 | 291/285 | |
| Age-adjusted model* | 1 | 0.93 (0.78–1.09) | 0.95 (0.80–1.12) | 1.09 (0.92–1.29) | .31 |
| Multivariable model 1† | 1 | 0.92 (0.77–1.08) | 0.98 (0.83–1.17) | 0.96 (0.80–1.15) | .84 |
| Multivariable model 2‡ | 1 | 0.91 (0.77–1.07) | 0.98 (0.82–1.16) | 0.95 (0.79–1.15) | .81 |
| Plant fat | |||||
| Person-months | 2,501 | 2,895 | 3,477 | 3,239 | |
| Cases/deaths | 291/288 | 291/285 | 292/282 | 291/274 | |
| Age-adjusted model* | 1 | 0.86 (0.73–1.01) | 0.80 (0.68–0.95) | 0.80 (0.68–0.95) | .007 |
| Multivariable model 1† | 1 | 0.89 (0.75–1.06) | 0.86 (0.72–1.02) | 0.78 (0.65–0.93) | .007 |
| Multivariable model 2‡ | 1 | 0.86 (0.73–1.03) | 0.85 (0.71–1.01) | 0.77 (0.64–0.91) | .005 |
| Total protein | |||||
| Person-months | 3,008 | 2,929 | 3,542 | 2,633 | |
| Cases/deaths | 291/281 | 291/281 | 292/280 | 291/287 | |
| Age-adjusted model* | 1 | 0.94 (0.80–1.11) | 0.91 (0.77–1.08) | 1.00 (0.85–1.18) | .94 |
| Multivariable model 1† | 1 | 0.88 (0.74–1.04) | 0.90 (0.76–1.07) | 0.90 (0.75–1.07) | .30 |
| Multivariable model 2‡ | 1 | 0.88 (0.74–1.04) | 0.90 (0.75–1.07) | 0.88 (0.74–1.06) | .23 |
| Animal protein | |||||
| Person-months | 3,056 | 3,341 | 3,039 | 2,676 | |
| Cases/deaths | 291/281 | 291/275 | 292/286 | 291/287 | |
| Age-adjusted model* | 1 | 0.91 (0.77–1.07) | 1.01 (0.86–1.20) | 1.03 (0.87–1.21) | .47 |
| Multivariable model 1† | 1 | 0.94 (0.79–1.11) | 1.03 (0.87–1.22) | 0.95 (0.79–1.13) | .79 |
| Multivariable model 2‡ | 1 | 0.95 (0.80–1.13) | 1.02 (0.86–1.21) | 0.95 (0.79–1.13) | .74 |
| Plant protein | |||||
| Person-months | 2,670 | 2,827 | 3,552 | 3,063 | |
| Cases/deaths | 291/286 | 291/282 | 292/282 | 291/279 | |
| Age-adjusted model* | 1 | 0.94 (0.80–1.11) | 0.85 (0.72–1.00) | 0.92 (0.78–1.09) | .21 |
| Multivariable model 1† | 1 | 1.00 (0.84–1.18) | 0.95 (0.80–1.13) | 1.09 (0.91–1.31) | .46 |
| Multivariable model 2‡ | 1 | 0.98 (0.83–1.16) | 0.94 (0.79–1.12) | 1.06 (0.89–1.28) | .65 |
| Total carbohydrate | |||||
| Person-months | 3,115 | 3,013 | 3,436 | 2,548 | |
| Cases/deaths | 291/284 | 291/281 | 292/279 | 291/285 | |
| Age-adjusted model* | 1 | 0.95 (0.80–1.12) | 0.87 (0.73–1.02) | 1.03 (0.87–1.22) | .99 |
| Multivariable model 1† | 1 | 0.95 (0.79–1.13) | 1.01 (0.84–1.20) | 1.11 (0.92–1.34) | .19 |
| Multivariable model 2‡ | 1 | 0.94 (0.79–1.12) | 1.01 (0.85–1.21) | 1.13 (0.93–1.37) | .15 |
Abbreviations: HR, hazard ratio; CI, confidence interval
Low-carbohydrate dietary pattern was calculated from food frequency questionnaires as a score with higher values indicating lesser carbohydrate intake and greater fat and protein intake. Plant-based and animal-based patterns included protein and fat from plant or animal sources, respectively. Macronutrient intake was calculated from food frequency questionnaires as percentage of total energy consumption.
Cox proportional hazards models were adjusted for age at diagnosis (continuous).
Models were adjusted for age at diagnosis (continuous), sex (women, men), race/ethnicity (white, black, other, unknown), diagnosis period (1986–1999, 2000–2014), stage at diagnosis (localized, locally advanced, metastatic, unknown), smoking status (never, past, current, unknown), alcohol intake (never, 1–3 drinks/month, 1–6 drinks/week, ≥1 drinks/day, unknown), and physical activity (continuous).
Models were additionally adjusted for body mass index (continuous) and diabetes status at diagnosis (no diabetes, short-term (≤4 years), long-term (>4 years)).
Two-sided P-value for trend was calculated by entering the quartile as an ordinary variable and assessed by the Wald test without correction for multiple comparisons.
Supplementary Material
Acknowledgments:
We thank members of the Vander Heiden laboratory for useful discussions and experimental advice. E.C.L. was supported by the Damon Runyon Cancer Research Foundation (DRG-2299-17). A.N.L. was a Robert Black Fellow of the Damon Runyon Cancer Research Foundation (DRG-2241-15) and was supported by a NIH Pathway to Independence Award (K99CA234221). Z.L. and K.M.S. were supported by NIH training grant T32GM007287. B.M.W was supported by the Lustgarten Foundation, Dana-Farber Cancer Institute Hale Family Center for Pancreatic Cancer Research, the NIH (U01CA210171, P50CA127003), Stand Up to Cancer, Pancreatic Cancer Action Network, Noble Effort Fund, Wexler Family Fund, Promises for Purple, and Bob Parsons Fund. M.G.V.H. acknowledges support from the Emerald Foundation, the Lustgarten Foundation, a Faculty Scholar grant from the Howard Hughes Medical Institute, Stand Up To Cancer, the MIT Center for Precision Cancer Medicine, the Ludwig Center at MIT, and the NIH (R35CA242379, R01CA168653, R01CA201276, P30CA14051). Nurses’ Health Study and Health Professionals Follow-up Study was supported by grants UM1 CA186107, U01 CA176726, P01 CA87969, U01 CA167552, and R03 CA223619 from the NIH. The authors thank all participants and staff of the Nurses’ Health Study and Health Professionals Follow-Up Study for their contributions to this research. We are grateful for help from the following state cancer registries: Alabama, Arizona, Arkansas, California, Colorado, Connecticut, Delaware, Florida, Georgia, Idaho, Illinois, Indiana, Iowa, Kentucky, Louisiana, Maine, Maryland, Massachusetts, Michigan, Nebraska, New Hampshire, New Jersey, New York, North Carolina, North Dakota, Ohio, Oklahoma, Oregon, Pennsylvania, Rhode Island, South Carolina, Tennessee, Texas, Virginia, Washington, and Wyoming. The authors also thank the Channing Division of Network Medicine, Brigham and Women’s Hospital and Harvard Medical School for leading the Nurses’ Health Study, and Harvard T.H. Chan School of Public Health for leading the Health Professionals Follow-Up Study. The authors assume full responsibility for analyses and interpretation of these data.
Competing interests:
M.G.V.H. is a scientific advisor for Agios Pharmaceuticals, Aeglea Biotherapeutics, iTeos Therapeutics, and Auron Therapeutics. B.M.W. declares research funding from Celgene and Eli Lilly and Company and consulting for BioLineRx, Celgene, and GRAIL. E.C.L., A.M.W., Y.Z., C.Y., Z.L., A.N.L., and K.M.S. declare no competing interests.
References:
- 1.Lien EC & Vander Heiden MG A framework for examining how diet impacts tumour metabolism. Nat Rev Cancer 19, 651–661 (2019). [DOI] [PubMed] [Google Scholar]
- 2.Sullivan MR et al. Increased Serine Synthesis Provides an Advantage for Tumors Arising in Tissues Where Serine Levels Are Limiting. Cell Metab 29, 1410–1421.e4 (2019). [DOI] [PMC free article] [PubMed] [Google Scholar]
- 3.Sullivan MR et al. Quantification of microenvironmental metabolites in murine cancers reveals determinants of tumor nutrient availability. Elife 8, e44235 (2019). [DOI] [PMC free article] [PubMed] [Google Scholar]
- 4.Maddocks ODK et al. Modulating the therapeutic response of tumours to dietary serine and glycine starvation. Nature 544, 372–376 (2017). [DOI] [PubMed] [Google Scholar]
- 5.Gao X et al. Dietary methionine influences therapy in mouse cancer models and alters human metabolism. Nature (2019). [DOI] [PMC free article] [PubMed] [Google Scholar]
- 6.Kalaany NY & Sabatini DM Tumours with PI3K activation are resistant to dietary restriction. Nature 458, 725–731 (2009). [DOI] [PMC free article] [PubMed] [Google Scholar]
- 7.Hopkins BD et al. Suppression of insulin feedback enhances the efficacy of PI3K inhibitors. Nature 560, 499–503 (2018). [DOI] [PMC free article] [PubMed] [Google Scholar]
- 8.Nencioni A, Caffa I, Cortellino S & Longo VD Fasting and cancer: molecular mechanisms and clinical application. Nat Rev Cancer 18, 707–719 (2018). [DOI] [PMC free article] [PubMed] [Google Scholar]
- 9.Danai LV et al. Altered exocrine function can drive adipose wasting in early pancreatic cancer. Nature 558, 600–604 (2018). [DOI] [PMC free article] [PubMed] [Google Scholar]
- 10.Gocheva V et al. Quantitative proteomics identify Tenascin-C as a promoter of lung cancer progression and contributor to a signature prognostic of patient survival. Proc Natl Acad Sci U S A 114, E5625–E5634 (2017). [DOI] [PMC free article] [PubMed] [Google Scholar]
- 11.Kennedy AR et al. A high-fat, ketogenic diet induces a unique metabolic state in mice. Am J Physiol Endocrinol Metab 292, E1724–39 (2007). [DOI] [PubMed] [Google Scholar]
- 12.Mukherjee P, El-Abbadi MM, Kasperzyk JL, Ranes MK & Seyfried TN Dietary restriction reduces angiogenesis and growth in an orthotopic mouse brain tumour model. Br J Cancer 86, 1615–1621 (2002). [DOI] [PMC free article] [PubMed] [Google Scholar]
- 13.Zhang J et al. Low ketolytic enzyme levels in tumors predict ketogenic diet responses in cancer cell lines in vitro and in vivo. J Lipid Res 59, 625–634 (2018). [DOI] [PMC free article] [PubMed] [Google Scholar]
- 14.Hosios AM, Li Z, Lien EC & Vander Heiden MG Preparation of Lipid-Stripped Serum for the Study of Lipid Metabolism in Cell Culture. Bio-protocol 8, e2876 (2018). [DOI] [PMC free article] [PubMed] [Google Scholar]
- 15.Peck B & Schulze A Lipid desaturation - the next step in targeting lipogenesis in cancer. FEBS J 283, 2767–2778 (2016). [DOI] [PubMed] [Google Scholar]
- 16.Vriens K et al. Evidence for an alternative fatty acid desaturation pathway increasing cancer plasticity. Nature 566, 403–406 (2019). [DOI] [PMC free article] [PubMed] [Google Scholar]
- 17.Kim W et al. Polyunsaturated Fatty Acid Desaturation Is a Mechanism for Glycolytic NAD+ Recycling. Cell Metab (2019). [DOI] [PMC free article] [PubMed] [Google Scholar]
- 18.Sullivan LB et al. Supporting Aspartate Biosynthesis Is an Essential Function of Respiration in Proliferating Cells. Cell 162, 552–563 (2015). [DOI] [PMC free article] [PubMed] [Google Scholar]
- 19.Birsoy K et al. An Essential Role of the Mitochondrial Electron Transport Chain in Cell Proliferation Is to Enable Aspartate Synthesis. Cell 162, 540–551 (2015). [DOI] [PMC free article] [PubMed] [Google Scholar]
- 20.Titov DV et al. Complementation of mitochondrial electron transport chain by manipulation of the NAD+/NADH ratio. Science 352, 231–235 (2016). [DOI] [PMC free article] [PubMed] [Google Scholar]
- 21.Diehl FF, Lewis CA, Fiske BP & Vander Heiden MG Cellular redox state constrains serine synthesis and nucleotide production to impact cell proliferation. Nat Metab 1, 861–867 (2019). [DOI] [PMC free article] [PubMed] [Google Scholar]
- 22.Piccolis M et al. Probing the Global Cellular Responses to Lipotoxicity Caused by Saturated Fatty Acids. Mol Cell 74, 32–44.e8 (2019). [DOI] [PMC free article] [PubMed] [Google Scholar]
- 23.Mauvoisin D & Mounier C Hormonal and nutritional regulation of SCD1 gene expression. Biochimie 93, 78–86 (2011). [DOI] [PubMed] [Google Scholar]
- 24.Young RM et al. Dysregulated mTORC1 renders cells critically dependent on desaturated lipids for survival under tumor-like stress. Genes Dev 27, 1115–1131 (2013). [DOI] [PMC free article] [PubMed] [Google Scholar]
- 25.Ackerman D et al. Triglycerides Promote Lipid Homeostasis during Hypoxic Stress by Balancing Fatty Acid Saturation. Cell Rep 24, 2596–2605.e5 (2018). [DOI] [PMC free article] [PubMed] [Google Scholar]
- 26.Kamphorst JJ et al. Hypoxic and Ras-transformed cells support growth by scavenging unsaturated fatty acids from lysophospholipids. Proc Natl Acad Sci U S A 110, 8882–8887 (2013). [DOI] [PMC free article] [PubMed] [Google Scholar]
- 27.Coulston AM The role of dietary fats in plant-based diets. Am J Clin Nutr 70, 512S–515S (1999). [DOI] [PubMed] [Google Scholar]
- 28.Pascual G et al. Targeting metastasis-initiating cells through the fatty acid receptor CD36. Nature 541, 41–45 (2017). [DOI] [PubMed] [Google Scholar]
- 29.Siri-Tarino PW, Chiu S, Bergeron N & Krauss RM Saturated Fats Versus Polyunsaturated Fats Versus Carbohydrates for Cardiovascular Disease Prevention and Treatment. Annu Rev Nutr 35, 517–543 (2015). [DOI] [PMC free article] [PubMed] [Google Scholar]
- 30.Mayers JR et al. Tissue of origin dictates branched-chain amino acid metabolism in mutant Kras-driven cancers. Science 353, 1161–1165 (2016). [DOI] [PMC free article] [PubMed] [Google Scholar]
- 31.Lewis CA et al. Tracing compartmentalized NADPH metabolism in the cytosol and mitochondria of mammalian cells. Mol Cell 55, 253–263 (2014). [DOI] [PMC free article] [PubMed] [Google Scholar]
- 32.Heinrich P et al. Correcting for natural isotope abundance and tracer impurity in MS-, MS/MS- and high-resolution-multiple-tracer-data from stable isotope labeling experiments with IsoCorrectoR. Sci Rep 8, 17910 (2018). [DOI] [PMC free article] [PubMed] [Google Scholar]
- 33.Antoniewicz MR, Kelleher JK & Stephanopoulos G Measuring deuterium enrichment of glucose hydrogen atoms by gas chromatography/mass spectrometry. Anal Chem 83, 3211–3216 (2011). [DOI] [PMC free article] [PubMed] [Google Scholar]
- 34.Argus JP et al. Development and Application of FASA, a Model for Quantifying Fatty Acid Metabolism Using Stable Isotope Labeling. Cell Rep 25, 2919–2934.e8 (2018). [DOI] [PMC free article] [PubMed] [Google Scholar]
- 35.Vichai V & Kirtikara K Sulforhodamine B colorimetric assay for cytotoxicity screening. Nat Protoc 1, 1112–1116 (2006). [DOI] [PubMed] [Google Scholar]
- 36.Colditz GA & Hankinson SE The Nurses’ Health Study: lifestyle and health among women. Nat Rev Cancer 5, 388–396 (2005). [DOI] [PubMed] [Google Scholar]
- 37.Belanger CF, Hennekens CH, Rosner B & Speizer FE The nurses’ health study. Am J Nurs 78, 1039–1040 (1978). [PubMed] [Google Scholar]
- 38.Health, H. T. H. C. S. O. P. Health Professionals Follow-Up Study.
- 39.Hu FB et al. Reproducibility and validity of dietary patterns assessed with a food-frequency questionnaire. Am J Clin Nutr 69, 243–249 (1999). [DOI] [PubMed] [Google Scholar]
- 40.Feskanich D et al. Reproducibility and validity of food intake measurements from a semiquantitative food frequency questionnaire. J Am Diet Assoc 93, 790–796 (1993). [DOI] [PubMed] [Google Scholar]
- 41.Willett WC et al. Reproducibility and validity of a semiquantitative food frequency questionnaire. Am J Epidemiol 122, 51–65 (1985). [DOI] [PubMed] [Google Scholar]
- 42.Rimm EB et al. Reproducibility and validity of an expanded self-administered semiquantitative food frequency questionnaire among male health professionals. Am J Epidemiol 135, 1114–26; discussion 1127 (1992). [DOI] [PubMed] [Google Scholar]
- 43.Willett WC Nutritional epidemiology (Oxford University Press, 2012). [Google Scholar]
- 44.Yuan C et al. Validity of a Dietary Questionnaire Assessed by Comparison With Multiple Weighed Dietary Records or 24-Hour Recalls. Am J Epidemiol 185, 570–584 (2017). [DOI] [PMC free article] [PubMed] [Google Scholar]
- 45.Yuan C et al. Relative Validity of Nutrient Intakes Assessed by Questionnaire, 24-Hour Recalls, and Diet Records as Compared With Urinary Recovery and Plasma Concentration Biomarkers: Findings for Women. Am J Epidemiol 187, 1051–1063 (2018). [DOI] [PMC free article] [PubMed] [Google Scholar]
- 46.Halton TL, Liu S, Manson JE & Hu FB Low-carbohydrate-diet score and risk of type 2 diabetes in women. Am J Clin Nutr 87, 339–346 (2008). [DOI] [PMC free article] [PubMed] [Google Scholar]
- 47.Halton TL et al. Low-carbohydrate-diet score and the risk of coronary heart disease in women. N Engl J Med 355, 1991–2002 (2006). [DOI] [PubMed] [Google Scholar]
- 48.Liu Y et al. Plant-based and animal-based low-carbohydrate diets and risk of hepatocellular carcinoma among US men and women. Hepatology (2020). [DOI] [PubMed] [Google Scholar]
- 49.Stampfer MJ et al. Test of the National Death Index. Am J Epidemiol 119, 837–839 (1984). [DOI] [PubMed] [Google Scholar]
- 50.Rich-Edwards JW, Corsano KA & Stampfer MJ Test of the National Death Index and Equifax Nationwide Death Search. Am J Epidemiol 140, 1016–1019 (1994). [DOI] [PubMed] [Google Scholar]
- 51.Colditz GA et al. Validation of questionnaire information on risk factors and disease outcomes in a prospective cohort study of women. Am J Epidemiol 123, 894–900 (1986). [DOI] [PubMed] [Google Scholar]
Associated Data
This section collects any data citations, data availability statements, or supplementary materials included in this article.
Supplementary Materials
Data Availability Statement
All data generated or analyzed during this study are included in this published article and in Supplementary Table 1, Supplementary Figures 1–23, and Source Data for Figures 1–4 and Extended Data Figures 1–8. Correspondence and requests for materials should be addressed to Matthew G. Vander Heiden (mvh@mit.edu).