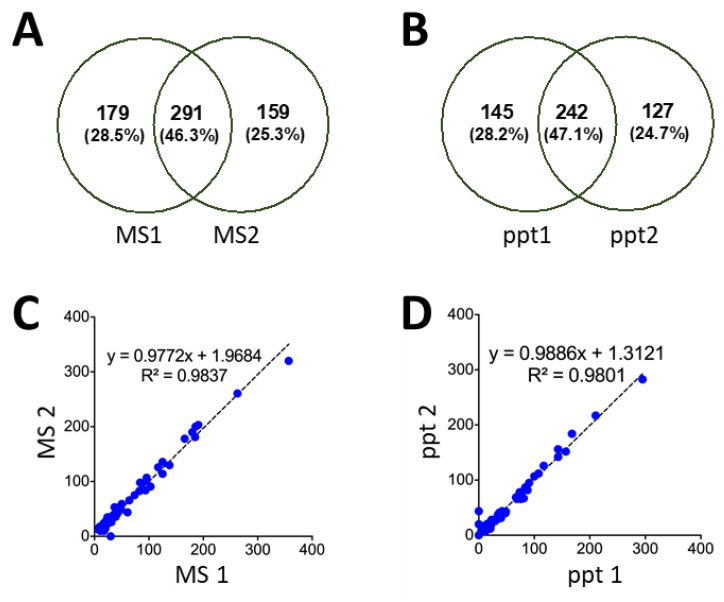
Figure 7.
Venn diagram showing overlapping peptides with PSM >3, identified in the precipitation pellet from pepsin-digested yeast. (A) Consists of replicate MS analysis of a single sample, while (B) compares two independently precipitated samples of yeast. Quantitative analysis of the identified proteins is shown through PSMs per protein, plotting the correlation between (C) two MS replicates and (D) independent precipitations.

