Abstract
Dust storms, such as those associated with haboobs and strong regional winds, are frequently assumed to cause increases in cases of Valley fever (coccidioidomycosis). The disease is caused by inhaling arthroconidia of Coccidioides fungi that, after being disturbed from semi‐desert subsoil, have become airborne. Fungal arthroconidia can be transported in low‐wind conditions as well as in individual dust events, but there is no reliable evidence that all or most dust storms consistently lead to subsequent increases in coccidioidomycosis cases. Following a review of the relevant literature, this study examines the relationship between dust storms and coccidioidomycosis cases to determine if there is a consistent and general association between them. All recorded dust storms from 2006 to 2020 in and near the Phoenix area of Maricopa County, Arizona and the Bakersfield area of Kern County, California were used in a compositing analysis (superposed epoch analysis) of subsequent coccidioidomycosis cases in each area. Analyses of monthly and weekly disease case data showed no statistical differences in the patterns of coccidioidomycosis cases following dust storms versus non‐dust storm conditions, for the entire data set as well as for seasonal subsets of the data. This study thoroughly analyzes post‐dust storm coccidioidomycosis cases for a large set of dust storms, and it confirms and expands upon previous literature, including a recent study that measured airborne arthroconidia and found no consistent links connecting wind and dust conditions to increases in coccidioidomycosis.
Keywords: Valley fever, coccidioidomycosis, dust storms, haboobs, climate, weather, health, disease
Key Points
It is often asserted that large dust storms like haboobs generally lead to increases in cases of Valley fever (coccidioidomycosis)
This study thoroughly tests that assertion using dust storm and coccidioidomycosis case data over many years
Consistent with literature, results show no statistical difference in cases of the disease after dust storm and non‐dust‐storm conditions
1. Introduction
1.1. The Problem and Aim
Dust storms and Valley fever (coccidioidomycosis) are commonly connected in scientific literature (e.g., Ampel, 2020; Nguyen et al., 2013; Tong et al., 2017), public health references (e.g., CDPH–California Department of Public Health, 2017; CDC–Centers for Disease Control and Prevention, 2020), policy recommendations (e.g., Hall et al., 2020), and popular media (e.g., Gerbis, 2021; Goodyear, 2014). Often, such sources contain statements that dust storms are an important factor for spreading the disease in endemic areas. As an infection caused by inhaling the spores (arthroconidia) of two closely related desert soil fungi, Coccidioides immitis and Coccidioides posadasii, Valley fever is indeed closely associated with exposure to dust from digging and similar earth surface disturbances (Nguyen et al., 2013). And, dust storms are by their nature highly visible and newsworthy, especially those occurring with Santa Ana winds in California and, in Arizona, those known as haboobs that advance as a menacing “wall” of blowing dirt and dust that can reach as high as 1,500 m (Figure 1). It is not surprising, therefore, that a causal link between dust storms and Valley fever cases is frequently asserted. However, this is a largely unchallenged hypothesis; in fact, there is scant published evidence for a consistent physical relationship between dust storms and Valley fever, and few indications from broader work that we should expect a dependable link between the two phenomena. Thus, the aim of this study is to assess the dust storm‐Valley fever hypothesis and determine if dust storms are consistently associated with increases in coccidioidomycosis.
Figure 1.
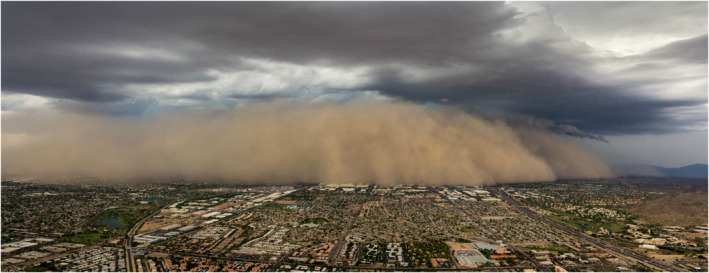
Panoramic photograph from a helicopter of an advancing haboob on 25 August 2015 in Phoenix, Arizona. The view is to the south, with Baseline Road running east‐west in the foreground and intersecting with Interstate 10 at bottom right. Winds in this storm gusted to almost 50 mph (80 km/hr) with visibility reduced to near 0 m in places (NCEI–National Centers for Environmental Information, 2021). Concentrations of Coccidioides arthroconidia across the area were lower for this dust storm day than on the clear days immediately before and after (Gade et al., 2020). Image credit: © Jerry Ferguson (https://imgur.com/04apBty), used with permission.
This paper has two main parts: first, a review of the pertinent literature focusing on the particular connections between coccidioidomycosis and dust storms, and second, an analysis of multiple years of dust storm and coccidioidomycosis data to evaluate their relationship for the two main US endemic areas in Arizona and California.
1.2. Coccidioidomycosis Background
An excellent review of the environmental, epidemiological and other dimensions of coccidioidomycosis is provided by Nguyen et al. (2013), which is a good source for most of the information summarized in this section. The disease is acquired by inhaling the arthroconidia (dried hyphal cells) of C. immitis and C. posadasii, closely related soil fungi that grow in the hot arid and semi‐arid regions of North, Central and South America. In the US, most cases of the disease are from Arizona (particularly Phoenix in Maricopa County, but also Tucson in Pima County and the adjoining Pinal County) and from California (Bakersfield in Kern County and the surrounding areas of the south San Joaquin Valley, from whence the disease gets its colloquial name). The fungus is dimorphic, with a saprophytic (soil) phase and a parasitic (host) phase.
In the saprophytic phase, the distribution of Coccidioides across the landscape is not ubiquitous; it is known to be highly focal spatially, and frequently associated with the subsurface burrows of rodents and other animals (Taylor & Barker, 2019). Evidence suggests that arthroconidia cannot survive for extended periods on the surface because of high temperatures and/or ultraviolet radiation in the desert environment (Fisher et al., 2007; Maddy, 1965). Arthroconidia are barrel‐shaped and about 3–5 μm in size; when they are disturbed from the soil (possibly millions or more from a specific site) by physical disturbance and feasibly by strong winds, they are released into the air and may be carried meters to potentially many kilometers. Two recent studies dealing with solar farm construction are examples of the many instances in the literature that document the importance of soil disturbance and the resulting airborne dust causing coccidioidomycosis (Colson et al., 2017; Sondermeyer Cooksey et al., 2017).
Once inhaled, arthroconidia can lodge in the lung and infect the tissue by switching to the parasitic phase. The fungus forms spherules, specialized structures that produce and release hundreds of endospores, which in turn disperse and multiply, spreading primarily as a pulmonary infection, although it can disseminate to other organs. Annual human case counts can exceed 20,000 per year in the US, with naïve populations susceptible to higher infection rates (Pearson et al., 2019). A vaccine is still in development, although the disease is treatable with antifungal drugs and deaths are relatively rare (Ampel, 2020).
1.3. Dust Storm Background
Dust storms require two essential components, a ready supply of dust and sufficiently strong winds to suspend the particles. High wind speeds are usually necessary to entrain particles from the surface and make them airborne, but in the present context there is an important exception: a physical disturbance can raise a dust cloud independently of the wind, such as tilling/plowing, construction‐related earthmoving, digging, vehicles traveling on unpaved roads or off‐road, and landslides (Chow et al., 1992; Cisneros et al., 2017; Jibson, 2002; Lader et al., 2016). Zender and Talamantes (2006) cite research on wind speeds necessary to entrain arthroconidia‐sized particles, which are ∼20 m s−1 (∼45 mph) without particle saltation/sandblasting (such as undisturbed desert areas with a dry surface soil crust) and 6–10 m s−1 (13–22 mph) in locations where dry soil particles can saltate (such as recently disturbed soil). Airborne dust concentrations can therefore be much higher during and soon after physical soil disturbances, both because of the disturbance itself and because of the consequent increase in supply of material and ease of entrainment by wind over disturbed versus undisturbed soils. It is also important to note that, as the principal dust sources for dust storms, disturbed soils are generally not favorable habitat for small burrowing animals that are the presumed reservoir of Coccidioides (Maddy, 1965; Taylor & Barker, 2019).
Dust storms are distinct from general dusty conditions because they are a particular kind of storm event, that is, they have strong winds. Atmospheric processes at different spatial and temporal scales cause those winds and enable dust storms to be characterized for areas such as the western US (Lei & Wang, 2014). Within the endemic areas of Arizona and California, there are two relevant process‐related scales for the common causes of widespread blowing dust. First, dust storms are often associated with thunderstorms in arid and semi‐arid regions, typically within the gust front, a zone of high‐speed surface winds flowing ahead of the storm. Thunderstorms are a common cause of notable dust storms in Arizona, primarily in mid and late summer during the North American monsoon, and such events can pick up massive amounts of surface material (Eager et al., 2017), forming a characteristic wall of dust (kilometers to tens of kilometers across; see Figure 1) that can travel across rural and urban areas (several hours). These dust storms are termed haboobs, following the Arabic name for similar storms in Sudan, the Arabian Peninsula, and nearby areas. Second, at a broader scale are dust storms associated with sustained strong winds caused by synoptic weather systems (covering many hundreds of kilometers and lasting a day or more at a location), such as the passage of a front or during strong regional winds such as the Santa Ana in California. These systems are the main cause of dust storms in California and also a cause in Arizona. Frontal systems bring precipitation during their peak in winter, but dust concerns are greatest in the fall and especially during the spring when such systems are still windy but may not deliver precipitation to dampen the soil and reduce dustiness.
1.4. Historical Development of Knowledge About Coccidioidomycosis and Dust Storms
The disease now known as coccidioidomycosis was first recognized in the 1890s and its fungal pathogenic cause was confirmed within a decade (Deresinski & Mirels, 2019). The realization that the spores were likely inhaled came with the discovery that the primary infection was pulmonary (Ophüls, 1905), although it took nearly three decades until C. immitis was isolated from the soil and confirmed as the source of infection (Stewart & Meyer, 1932). The presumption that spores “are carried through the air, presumably associated with dust” emerged soon afterward (Dickson, 1938). Seasonal increases in cases of the disease were associated with agricultural activities during summer and “a peak in the dusty fall and the ebb in the wet winter” by Smith (1940).
Smith et al. (1946) focused on the importance of dust in relation to coccidioidomycosis, noting four studies commenting on dust “as constituting the vehicle of ‘natural’ infection.” Their study at military airfields in Kern County was the first to analyze precipitation data and coccidioidomycosis infections; they noted the effect of rain on reducing dust‐related exposures and hypothesized that wetter winters resulted in a greater abundance of fungal spores for inhalation the subsequent summer. They were also careful to point out the confounding effects of soil disturbance and resulting billows of dust when the airfields were being constructed, as well as the post‐construction reductions in cases once surfaces were paved and grassy areas established. The thinking of the time regarding key environmental factors in the endemic area was summarized by Egeberg (1954) who, in addition to noting the characteristic seasonal temperature and precipitation patterns, suggested the importance of dust‐producing soils and winds necessary to carry the dust.
Hugenholtz (1957) published the first analysis of coccidioidomycosis specifically in relation to wind and dust storms. Using data from 1943 to 1956 at Williams AFB in Arizona (now Phoenix‐Mesa Gateway Airport), he compared coccidioidomycosis cases with precipitation and temperature as well as two dust variables: number of days with dust storms, and number of hours of dust storms. He documented the opposite‐phase seasonal relationship between precipitation and coccidioidomycosis but found no environmental conditions associated with year‐to‐year variability in cases and inconsistent associations with dust storms. Maddy (1965) noted that “a study of prevailing winds over the entire endemic area has not given any indication that viable arthrospores (as arthroconidia were then called) are blown more than a few miles beyond their source in nature” although we now know it is possible that fungal aerosols can be carried much further (Golan & Pringle, 2017).
Perhaps the signal event that, more than any other, connected dust storms with coccidioidomycosis was the so‐called “Tempest from Tehachapi” (Pappagianis & Einstein, 1978), the great Bakersfield dust storm of 20 December 1977. This historic dust storm is listed as number nine on the list of California's top weather events of the twentieth century (National Weather Service, 2004). It was caused by hurricane‐strength Santa Ana winds that occurred at the end of an extended drought within a period of relatively low case counts (winter), which was followed days later by the onset of winter rains that effectively halted any further blowing dust. The storm not only moved surface dust, it also scoured soil to depths of 15 cm (Flynn et al., 1979). A striking rise and subsequent decrease in cases in and near Kern County was observed during the following weeks (Pappagianis & Einstein, 1978). A different major California event, the 1994 Northridge earthquake, caused thousands of landslides; although the winds were moderate at the time (and thus technically not a conventional dust storm), the resulting dust clouds were associated with increased coccidioidomycosis cases in Simi Valley (Jibson, 2002; Schneider et al., 1997).
1.5. Detection of Airborne Coccidioides Spores in Relation to Dust Storms
The first successful extractions of Coccidioides arthroconidia from the atmosphere were in 1956 in California and 1959 in Arizona (Ajello et al., 1965). Importantly, in this latter study, despite extensive sampling at Williams AFB during dust storms, no positive samples were obtained; yet, two samples from a paved and irrigated residential area in Phoenix were positive on days without dust storms. More than 40 years later, four air samples positive for Coccidioides were detected near Bakersfield in 2001, three over undisturbed ranch land and one over cultivated land; all of these occurred on low‐wind days (Daniels et al., 2002). Three air samples taken near Florence, Arizona in 2014 were positive for Coccidioides; these samples were not collected during a dust storm but instead they contained dust from artificially disturbed subsurface and surface soils that included rodent burrows (Chow et al., 2016). The authors also noted the oft‐described spatially focal distribution of positive soil sampling locations, with several negative sites less than 1.5 m from a positive site.
A recent study in Phoenix, AZ provided especially valuable insights into the varying concentrations, seasonality and locally uneven spatial distribution of airborne Coccidioides spores (Gade et al., 2020). One set of samples characterized concentrations of arthroconidia on the days before, during and after a major dust storm on 25 August 2015 (the haboob illustrated in Figure 1); positive samples were found at 18 of 21 (86%) sites on the day before the dust storm, while only four sites (19%) were positive on the day of the dust storm and on the day after. Gade et al. (2020) suggest that this is initial evidence that large dust storms might even temporarily reduce airborne arthroconidia counts. Furthermore, on the dust storm day, the positive sites were not spatially clustered and they were intermingled between sites with no detected spores, enabling two deductions relevant to the present study: (a) the source of the arthroconidia must have been local (within a few kilometers based on site location spacing, possibly much less, assuming the dust in the storm was well‐mixed as seen in Figure 1) meaning the dust storm did not supply arthroconidia from its dust source region outside the city, and (b) neither did the dust storm spread arthroconidia widely across the urban area—concentrations remained highly localized. The second set of air samples in Gade et al. (2020) covered 45 days from late September to early November 2015. There were no reported dust storms during the entire period (NCEI, 2021); yet, several sites detected arthroconidia for many successive days or weeks while most others had sporadic detections on just a few days during the sampling period. These results provide a corollary to the deductions above: during normal non‐dust storm conditions the location and airborne dispersal of arthroconidia are also limited to the local scale.
1.6. Contemporary Studies of Coccidioidomycosis and Dust Storms
Apart from the study by Gade et al. (2020), virtually all we have learned in recent years about the atmospheric controls on the Coccidioides fungus in the environment has been inferred from human disease data. Coccidioidomycosis became nationally notifiable in 1995 (Benedict et al., 2019) and studies since then have confirmed and added to historical analyses by including many more atmospheric variables, geospatial techniques, and statistical modeling. This work has refined the general characterization of atmospheric controls as follows: (i) the hot and semi‐arid conditions that define the current endemic areas and potential shifts under climate change (Gorris et al., 2018, 2019; Ocampo‐Chavira et al., 2020; Weaver et al., 2020); and (ii) the basic seasonality of the disease and its association with the annual lag between previous fall/winter precipitation (via soil moisture) and subsequent cases along with concurrent dry conditions (Coopersmith et al., 2017; Khan, 2020; Kolivras & Comrie, 2003; Park et al., 2005; Shriber et al., 2017; Stacy et al., 2012; Talamantes et al., 2007; Tamerius & Comrie, 2011; Weaver & Kolivras, 2018; Zender & Talamantes, 2006).
Many of the above studies also specifically included dust and wind variables in their analyses (e.g., wind speed and direction, wind gusts, PM10, and drought and vegetation indices) in addition to precipitation. Nonetheless, precipitation relationships emerge as the most consistent link across all studies. Significant associations with dust‐related variables have been found far less frequently; they are inconsistent across studies and occasionally even contradictory (Weaver & Kolivras, 2018), and there is a lack of convincing evidence indicating dust as a driver of coccidioidomycosis seasonality (Gorris et al., 2018).
Two separate studies relating coccidioidomycosis to dust storms in particular focused on the 5 July 2011 haboob in Phoenix. Brown et al. (2014) examined dust storms and weekly case reports for the year and could identify no causal relationship between them. Sprigg et al. (2014) applied a sophisticated weather and dust modeling system and also could not find definitive evidence linking the storm to coccidioidomycosis cases. They commented that most coccidioidomycosis cases do not need a dust storm to produce infection, that windblown dust happens year‐round, and that physical soil disturbance by other means was likely important.
Tong et al. (2017) identified an increase in dust events across the western US from the 1990s to the 2000s. They claimed that monthly correlations between dust events and coccidioidomycosis in Maricopa and Pima counties in Arizona for 2001–2011 were higher than matching precipitation correlations. Regrettably, they did not account for major inhomogeneities in disease reports resulting from the 2009 change in laboratory definition (ADHS–Arizona Department of Health Services, 2018) that effectively doubled cases for several years at the end of their study period, and which added a strong artificial upward trend (in addition, they did not lag the correlations to account for incubation and reporting delays). Therefore, the correlations of the strong artificial upward trend in cases and the dust storm trend reported by Tong et al. (2017) are possibly spurious and their related inferences linking dust storm trends to coccidioidomycosis trends must be treated with caution. Furthermore, a recent study (Pu et al., 2019) has shown that the dust storm trend for the southwest US has been flat in the decade since the study period in Tong et al. (2017), while coccidioidomycosis cases have continued to climb.
The most recent study of coccidioidomycosis and dust storms is the Gade et al. (2020) paper mentioned above. This work is especially promising because it provides a new approach to observe arthroconidia in the atmosphere and to connect those patterns to environmental conditions, circumventing the need to infer atmospheric and other environmental controls from human case data, and satisfying calls for a novel observation technique that can do so (e.g., Kolivras & Comrie, 2004). Still, while regular sampling of arthroconidia from the air is now technically feasible, it will be some time until such data can be collected and linked to variability of the disease over multiple seasons and locations. Until such data become available, there is one further avenue that can be explored to closely examine the possible causal connections between dust storms and coccidioidomycosis: an analysis of reported dust storms and subsequent cases of the disease.
1.7. Refining the Question
The literature is clear that a principal infection pathway for coccidioidomycosis occurs when arthroconidia are disturbed from dry subsurface soil and become airborne in localized dust clouds that can be inhaled. It seems intuitive to extend the connection by assuming that windy conditions in the semi‐arid Coccidioides habitat would lead to more widespread dispersal of arthroconidia and an associated increase in coccidioidomycosis cases—even more so for notable dust storms. There is even a well‐known case of the latter in the literature. Yet, studies have shown repeatedly that windy conditions are not generally associated with increases in the disease. Likewise, the few valid studies related specifically to dust storms also found no corresponding increases in arthroconidia concentrations or human cases. Those studies focused on individual events or overall trend, and no study has thoroughly examined a large set of relevant dust storms to evaluate whether or not they are consistently associated with increases in coccidioidomycosis cases occurring soon afterward.
Note that the question is not whether a dust storm is able to transport arthroconidia and cause an infection in a given instance—that answer is demonstrably yes—but, more precisely, if dust storms in general are followed by increases in coccidioidomycosis cases. Specifically, this study examines if recorded dust storms in the core endemic areas are consistently followed by increases in coccidioidomycosis cases, as is frequently asserted. Furthermore, coccidioidomycosis is known to be acquired under a wide range of weather conditions, so it is important to discern whether major dust storms over populated areas lead to a disproportionate increase in cases as compared to non‐dust storm conditions.
2. Data and Methods
2.1. Dust Storm Data
Dust storm records were obtained from the Storm Events Database of the US National Centers for Environmental Information (NCEI, 2021). This database contains reports categorized by type of event that are submitted by National Weather Service personnel. Dust storm reports are based primarily on information from trained spotters and law enforcement officers. Each event report includes location, time, and other details as well as narrative text further describing the dust event such as visibility, wind gusts, and affected areas. This data set is useful for identifying dust storm events that are notable and visible, and it provides a record of dust storms that is distinct from other less‐useful variables such as wind speed (that does not include dust) or PM10 concentration (that is easily confounded by non‐dust sources).
Data were selected for Maricopa County and Kern County from 2006 to 2020 (regular reports commenced in the mid‐2000s). The reports were processed to include days with dust storms located in and around the relevant population centers (greater Phoenix and Bakersfield); events that were located far from these areas in remote parts of each county were excluded. All types of dust storms were included (those due to haboobs, frontal systems, etc.). This resulted in 76 storm days in the Phoenix area and 15 in the Bakersfield area over the period. Figure 2 illustrates dust storm totals by month for the two study areas, labeled by county for consistency with the coccidioidomycosis analyses. The differences in dust storm frequency and seasonal timing are clear, with the most prominent being the summer dust storms in Phoenix (many of which are haboobs). All individual months in the record were flagged as either not containing any dust storms or containing dust storms (one or more).
Figure 2.
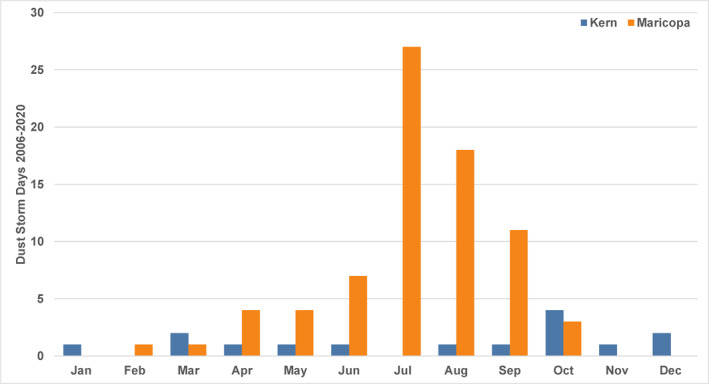
Total days per month with reported dust storms in the Bakersfield area of Kern County, CA and the Phoenix area of Maricopa County, AZ from 2006 to 2020.
2.2. Coccidioidomycosis Data
Reported coccidioidomycosis cases cannot be tied precisely to the date or location of exposure. Each reported case is subject to a sequence of events with variable timing: disease incubation, speed and severity of symptom onset, delay until medical care is sought and received, diagnosis interval, laboratory testing period, and time until the result is reported. The incubation period is 1–4 weeks and the median time from symptom onset to laboratory report has been estimated as 54 days (ADHS–Arizona Department of Health Services, 2018; Tamerius & Comrie, 2011). These delays must be accounted for when comparing case report dates to potential exposure dates (i.e., dust storms).
Monthly coccidioidomycosis case count data for 2016–2020 from Maricopa County and Kern County were obtained respectively from the Arizona Department of Health Services (ADHS) and the Kern County Public Health Services Department (KCPHSD). The Maricopa County cases are recorded as report date, which is within 5 days of laboratory result. The case counts for Maricopa County from June 2009 to December 2012 were divided by two to adjust for the approximately doubled case counts in that period that resulted from changes to laboratory reporting practices (ADHS–Arizona Department of Health Services, 2018). Kern County cases are by diagnosis date, which provides a consistent reporting basis over time across data system changes. Figure 3 shows, for both study areas, the overall time series of monthly coccidioidomycosis cases plotted with months having one or more dust storm days.
Figure 3.
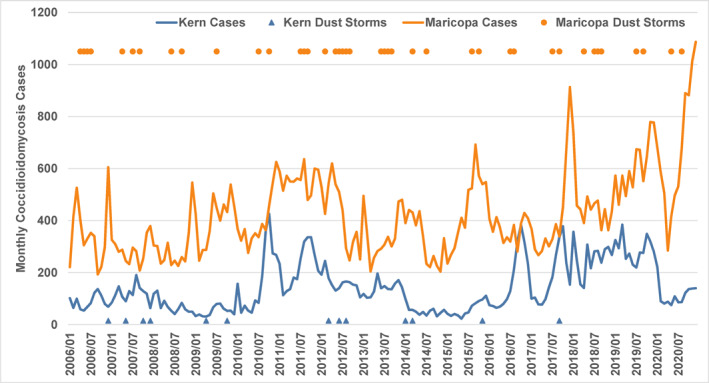
Monthly coccidioidomycosis cases in Kern County, CA and Maricopa County, AZ and months with one or more dust storm days (y‐axis value is arbitrary), 2006–2020.
Coccidioidomycosis cases on a weekly basis were also obtained for Maricopa County from ADHS. Using weekly data for Kern County is impractical because the counts in many weeks fall below the privacy threshold of 11 cases. The Maricopa County data are reported using the same date system (“MMWR weeks”) as those reported nationally (CDC–Centers for Disease Control and Prevention, 2021). The latter are raw preliminary data that are subject to changes, sometimes substantial; instead, the data used here have received the same agency processing as the monthly data. The finer timescale of the weekly data set may help resolve potential dust storm associations that may not be as apparent at the monthly level. The same adjustment procedure as for the monthly data was applied to weekly case counts from June 2009 to December 2012 to reflect changes in laboratory reporting practices. Figure 4 shows the overall time series of Maricopa County weekly coccidioidomycosis cases plotted with weeks having one or more dust storm days.
Figure 4.
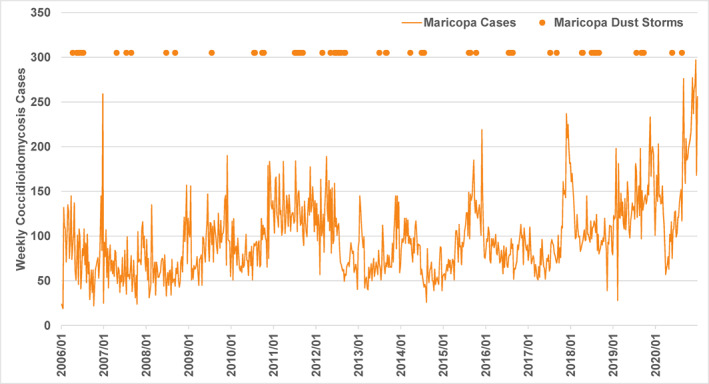
Weekly coccidioidomycosis cases in Maricopa County, AZ and weeks with one or more dust storm days (y‐axis value is arbitrary), 2006–2020.
2.3. Analyses
Compositing, also known as superposed epoch analysis, is used regularly in the earth and atmospheric sciences and is a simple but powerful technique to separate small signals from a noisy background. Composites (averages) of a variable are calculated for a series of fixed time periods following occurrences of key events (i.e., coccidioidomycosis cases after dust storms) and the resulting series are compared. Thus, in each location for monthly data, all months in the record containing one or more dust storm days were identified; then, coccidioidomycosis cases in each of the subsequent 12 months were superposed (i.e., the event months in bin zero, the one‐month‐later ones in bin 1, the two‐months‐later ones in bin 2, and so on through month 12. The values in each bin were averaged, creating a post‐dust storm composite time series of coccidioidomycosis from lag‐zero months (the event) to lag‐12 months later. This superposition of each month for 12 monthly steps after each dust storm provides an extended “response time” that accounts for incubation/reporting delays as well as any subsequent signal of increases or decreases in cases. The results were plotted with the average case count in the dust storm event month (M + 0) on the left and corresponding averages for each sequential post‐event month to the right. The same procedure was carried out for all the matching months containing zero dust storm days. The corresponding set of weekly analyses were constructed following the same methods. Differences in means were compared using 95% confidence intervals based on the t‐distribution to allow for small sample sizes.
If dust storms have a consistent association with coccidioidomycosis cases, then such analyses will reveal if there is a meaningful pattern. Hypothetically, such a pattern should be strongest in the period soon after the dust storm (allowing for the exposure to reporting delays mentioned previously). Composite analyses were calculated for all dust storm months/weeks in the study period and for seasonal subgroups.
3. Results
3.1. All Dust Storm Months
Results for all dust storm versus non‐dust storm months in the data set are presented in Figure 5. Two kinds of comparisons can be made in each study area, using the confidence intervals to guide interpretation: (i) changes over time within each lag series, and (ii) dust storm versus non‐dust storm composites. For Maricopa County there are no significant increases in coccidioidomycosis cases following dust storm months, not only within the relevant first few months after dust storms but also in later months. Likewise, the post‐dust storm coccidioidomycosis series is not significantly different from the non‐dust storm series for the same period. Although there is a slight increase in the post‐dust storm values until lag M + 4 and a slight decrease in the months thereafter, none of these values is significantly different from others in the time series or from matching months in the non‐dust storm series.
Figure 5.
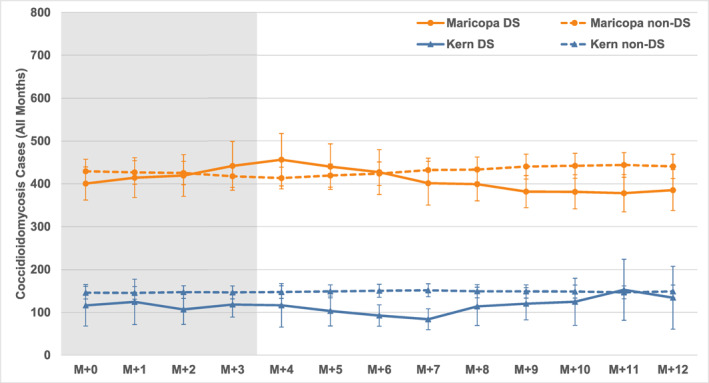
Composite coccidioidomycosis cases for 0‐ to 12‐month lags (M + 0 to M + 12) for all months with and without dust storms in Kern County, CA (Kern DS and Kern non‐DS) and Maricopa County, AZ (Maricopa DS and Maricopa non‐DS), 2006–2020. Dust storm occurrence/non‐occurrence is in month M + 0 on the left, and each line denotes the average case count in subsequent months from left to right. Vertical bars indicate 95% confidence intervals (t‐distribution). Lag months zero to three (M + 0 to M + 3), in which any dust storm‐related case increases should be apparent, are shaded in gray.
Results for Kern County are similar: there are no significant increases in coccidioidomycosis cases following dust storm months during the relevant initial few months. The average coccidioidomycosis cases in the post‐dust storm series are overall slightly lower than those in the non‐dust storm series, but the differences are not significant. The post‐dust storm series is significantly lower than the non‐dust storm series from lags M + 5 to M + 7.
3.2. Summer Dust Storm Months
Most dust storms in Maricopa County occur from June to September (Figure 2). These are predominantly haboobs, and to examine them more closely the data record was split to focus on the four summer months when thunderstorms are prevalent. The matching period for Kern County was used for comparison. Figure 6 illustrates those results: there are no significant differences in coccidioidomycosis cases between dust storm and non‐dust storm lag series for the summer haboob season in Maricopa County or for summer dust storms in Kern County. In Maricopa County the post‐dust storm values are slightly lower (but not significantly so) and both series increase in the post‐summer months, reflecting the typical annual fall/winter rise in cases. The sample sizes are, of course, smaller than for the all‐month analysis and therefore the confidence intervals are wider than in Figure 5. This is especially true for the Kern County data where, again, there are no significant differences between coccidioidomycosis cases following dust storm and non‐dust storm months.
Figure 6.
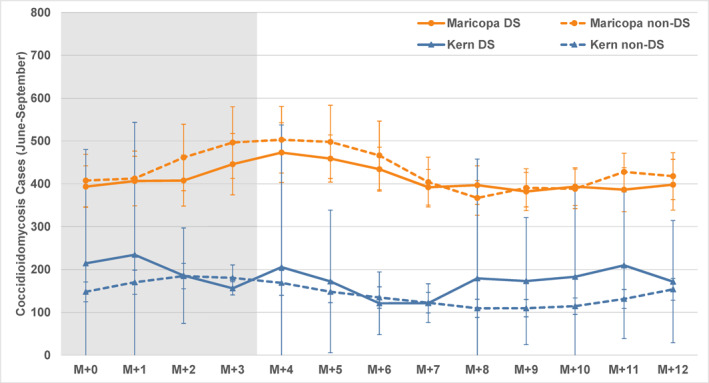
Composite coccidioidomycosis cases as for Figure 5, for the summer months (June to September).
3.3. Shoulder‐Season and Winter Dust Storm Months
Dust storms are infrequent in the core winter months but they occur with greater frequency in the shoulder seasons, especially the spring months in Arizona (Figure 2). Figure 7 illustrates results for October through May in both study areas. As with the previous analyses, there are no significant trends in the time series of coccidioidomycosis cases during the key initial months (or the months thereafter) following post‐dust storm and non‐dust storm conditions. The small sample sizes and high variability for post‐dust storm months during this part of the year in Maricopa County lead to large confidence intervals, and there are no significant differences between the two series. In Kern County, while there is no meaningful increase or decrease in cases following dust storms, all of the months from lag M + 0 through M + 9, except lags M + 1 and M + 3, are significantly different across the two series, but with lower overall average coccidioidomycosis cases following dust storm conditions.
Figure 7.
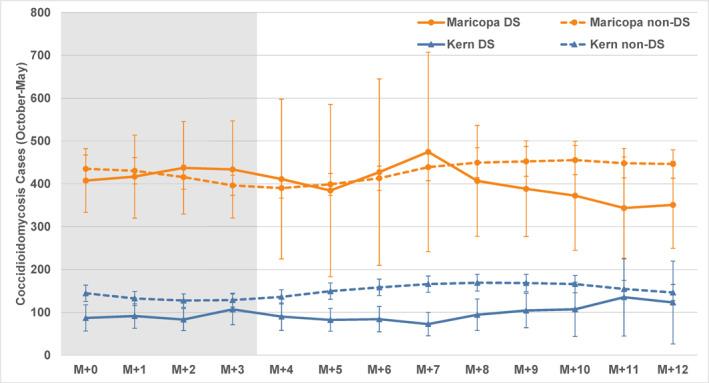
Composite coccidioidomycosis cases as for Figure 5, for the shoulder season and winter months (October to May).
3.4. Weekly Analyses for Arizona
Results for all dust storm versus non‐dust storm weeks are presented in Figure 8. There are no significant increases in Arizona weekly coccidioidomycosis cases following dust storm weeks in Maricopa County, and no significant difference from non‐dust‐storm conditions either, as for the monthly data. There are a couple of weeks with slightly higher or lower values during the 12 weeks post‐event, but none of these differences are statistically significant. Likewise, while the averages in the subsequent months vary slightly, there are no significant differences between the two sets of conditions.
Figure 8.
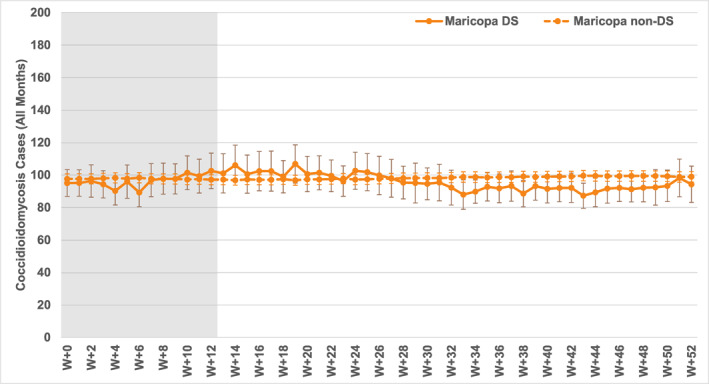
Composite coccidioidomycosis cases for 0‐ to 52‐week lags (W + 0 to W + 52) for all weeks with and without dust storms in Maricopa County (Maricopa DS and Maricopa non‐DS), 2006–2020. Dust storm occurrence/non‐occurrence is in week W + 0 on the left, and each line denotes the average case count in subsequent weeks from left to right. Vertical bars indicate 95% confidence intervals (t‐distribution); those for Maricopa DS are colored darker for clarity. Lag weeks 0 to 12 (W + 0 to W + 12), in which any dust storm‐related case increases should be apparent, are shaded in gray.
Weekly results for the summer dust storm (haboob) season from June to September in Maricopa County are shown in Figure 9. Again, the patterns in the weekly data are similar to those in the monthly data, with no significant differences in coccidioidomycosis cases between dust storm and non‐dust storm lag series. Interestingly, the non‐dust storm series does show significantly higher averages between the earliest few lag weeks (W + 0 to W + 3) and those several weeks later (W + 11 to W + 28), reflecting the typical year‐end seasonal increase in cases. While the post‐dust storm series generally tracks the same pattern, the changes over time are not significant and average concentrations are slightly lower (but not significantly different from the non‐dust storm series). Clearly, coccidioidomycosis patterns following haboobs are essentially the same as those following normal weather conditions.
Figure 9.
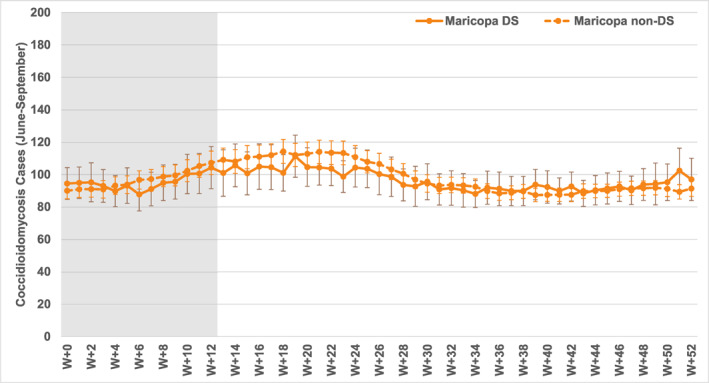
Composite coccidioidomycosis cases as for Figure 8, for the summer weeks (June to September).
Figure 10 illustrates weekly results for October through May in Maricopa County. A minority of dust storms occurs during this part of the year, so sample sizes are small and the associated averages exhibit high variability (with large confidence intervals) in the post‐dust storm composite. There are several weeks with relatively higher average coccidioidomycosis cases starting at lag W + 7, but it is important to note that there are no statistically significant differences; this applies to temporal changes and to differences between post‐dust storm and non‐dust storm conditions in the initial 12 weeks. In contrast, non‐dust storm conditions have large sample sizes and those case averages are significantly higher in the initial weeks as compared to lower values after the initial period.
Figure 10.
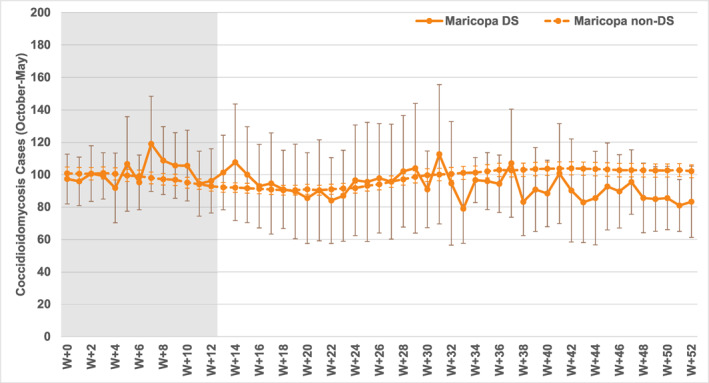
Composite coccidioidomycosis cases as for Figure 8, for the shoulder season and winter weeks (October to May).
4. Conclusions and Discussion
This study set out to examine if, as is sometimes assumed, dust storms in the primary coccidioidomycosis endemic areas of the US are consistently followed by a rise in cases of the disease—the results show no indication of a reliable relationship between the two. All recorded dust storms in or near the main population centers of Maricopa County, AZ and Kern County, CA that occurred during the 15‐year study period were included in the study. Yet, in both the monthly and weekly analyses, no statistically significant differences were found between composites of coccidioidomycosis cases subsequent to dust storm and non‐dust storm conditions.
This finding is consistent with the scientific literature summarized earlier. Still, it is perhaps not intuitive because coccidioidomycosis infections occur when Coccidioides arthroconidia in dry subsurface soil are disturbed, become airborne, and are inhaled. Although there is a widely cited early study linking a single dust storm to an increase in cases (Pappagianis & Einstein, 1978), virtually every study of windy conditions in general and dust storms in particular has failed to find a robust association with increased coccidioidomycosis. Prior dust storm studies have examined only individual storms or broad correlations, while the present study thoroughly examines a large number of relevant dust storms by superposing events to assess their potential association with coccidioidomycosis cases.
Possible uncertainties in this study include the following: any omissions or partial information in the dust storm records; the potentially lower susceptibility of the populations living in the two core endemic areas (as compared to the naïve populations studied in some of the older literature); the coarse monthly resolution relative to dust storms that was ameliorated by also examining weekly composites; and the imprecision of the exposure‐diagnosis‐reporting chain, which was managed by examining data for an extended period after each storm.
There are several implications of confirming no consistent relationship between dust storms and cases of the disease. First, it is important to underscore that coccidioidomycosis cases do occur following dust storms, just no more than they do for other weather conditions, and therefore we must look elsewhere in the infection pathway to better understand the other key factors, that is, disturbance of infected subsoil and proximity to any such disturbances. Second, the absence of an increase in cases is presumably because dust storms do not, of themselves, generally cause higher than normal arthroconidia concentrations in the air, as was shown by Gade et al. (2020). Third, arthroconidia do not need to be carried from surrounding areas by dust storms to raise disease cases in populated areas, and therefore sources of arthroconidia are as likely to be local in scale within an urban area, as was also shown in the measurements by Gade et al. (2020).
These behaviors fit with our understanding of (i) the distribution of arthroconidia (exposure sources) on the landscape, and (ii) the nature of atmospheric dispersion. Regarding arthroconidia sources, these are highly likely to be focal at fine spatial scales of ∼1 m or less (i.e., animal burrows; see Figure 11), and only at certain times when they have developed in the soil in concert with precipitation and, hypothetically, consequent vegetation food sources for burrowing animals. The literature also strongly favors active disturbance at the site, whether from animals or humans digging in or near old burrows, which is even more time‐specific. Recall that dust storms pick up most of their dust from the surface of lands that have seen extensive agricultural and other development that alters the soil (and rodent habitat availability), and they likely entrain far less from the subsurface of relatively unchanged desert soils that are presumably more favorable for rodent burrows. Regarding atmospheric dispersion, once arthroconidia are disturbed and become airborne, the suspended particles are subject to Gaussian dispersion (e.g., Turner, 1994). Their concentration decreases logarithmically in three dimensions (distance downwind, plume width, and plume height), leading to a rapid drop‐off of particle concentrations away from the source. For example, a simple dispersion model (NOAA ARL‐National Oceanic & Atmospheric Administration: Air Resources Laboratory, 2019) shows that under well‐mixed (neutral) atmospheric conditions such as occurs with high wind speeds (10–20 m s−1), particle concentrations emitted continuously at 1 million per second (∼1 billion over 15 min) drop below 1 m−3 along the plume centerline within a few kilometers of the source and within a few hundred meters width on either side of the centerline; with gentle winds (∼2 m s−1) the matching dimensions are roughly half the downwind distance and twice the width. Thus, arthroconidia concentrations are likely to be spatially patchy under most wind conditions, on the order of 1–2 km or less, as measurements in Phoenix have demonstrated (Gade et al., 2020).
Figure 11.
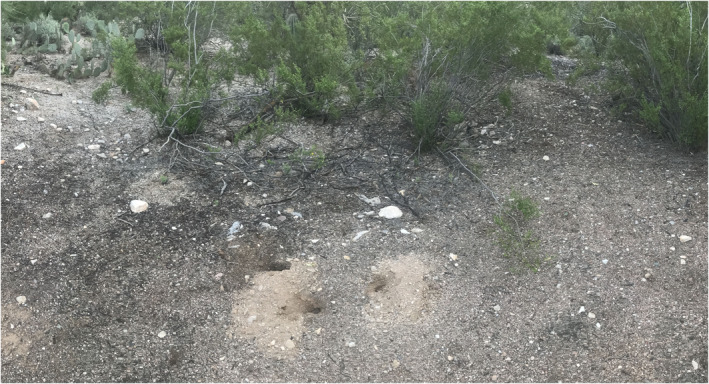
An example small patch of desert landscape in Tucson, Arizona with creosote bush (Larrea tridentata), prickly pear cactus (Opuntia engelmannii; upper left), and animal burrows (center foreground), illustrating their focal nature. This site is untested for Coccidioides; fast cost‐effective methods to do so are still needed. Image credit: the author.
Because there is no evidence that dust storms consistently “cause” coccidioidomycosis, there are important implications for both public health communication and media coverage. Cases of the disease go up, down, and/or stay the same after different dust storms with no consistent relationship. Anecdotally, one might note a case occurring after a dust storm because dust storms are memorable events that are now popularly associated with coccidioidomycosis, but such an observation is subject to confirmation bias with no counterfactual anecdote; coccidioidomycosis is acquired year‐round under all kinds of conditions. Yet, dust storms are unhealthy for other important reasons: they carry inhalable fine particulates that are known air pollutants, and the severely reduced visibility in dust storms is a common cause of motor vehicle accidents. Thus, we need to maintain focus on these public health aspects of dust storms and, while they may sometimes carry arthroconidia, refrain from consistently associating them with coccidioidomycosis.
As part of setting the record straight on dust storms and coccidioidomycosis, researchers and public health professionals also need to shift the mental model away from “more wind and dust storms lead to more coccidioidomycosis” to “more disturbance of focal arthroconidia sites leads to more coccidioidomycosis, no matter the wind and dust conditions” (i.e., images more like Figure 11 than Figure 1). More colloquially, we need to stop saying or implying things like “haboobs cause more Valley fever.”
Finally, because this study is one of very few on dust storms and coccidioidomycosis, there are still many avenues for future work. More widespread air sampling to understand the time and space details of arthroconidia distribution is needed. Those observations need to be linked to daily weather and seasonal climate conditions (and to other environmental factors). Air measurement methods for detecting arthroconidia need to be further advanced. Rapid and cost‐effective soil detection techniques need to be developed so we can once and for all pin down the details of the animal burrow as Coccidioides habitat issue (Taylor & Barker, 2019), enabling us to gain a more precise understanding of where and when the fungus develops in the soil.
Conflict of Interest
The author declares no conflicts of interest relevant to this study.
Acknowledgment
Sincere thanks to Guillermo Adame of the Arizona Department of Health Services and Paul Rzucidlo of the Kern County Public Health Services Department for their valuable assistance in obtaining the coccidioidomycosis data, and to Heidi Brown for valuable comments on a draft of the manuscript.
Comrie, A. C. (2021). No consistent link between dust storms and Valley fever (coccidioidomycosis). GeoHealth, 5, e2021GH000504. 10.1029/2021GH000504
Data Availability Statement
The dust storm and coccidioidomycosis data used in this research are available at https://doi.org/10.5281/zenodo.5201801.
References
- ADHS–Arizona Department of Health Services . (2018). Valley Fever 2017 annual report. Retrieved from https://www.azdhs.gov/preparedness/epidemiology-disease-control/valley-fever/index.php#data-reports-publications [Google Scholar]
- Ajello, L. , Maddy, K. , Crecelius, G. , Hugenholtz, P. G. , & Hall, L. B. (1965). Recovery of Coccidioides immitis from the air. Sabouraudia, 4, 92–95. 10.1080/00362176685190231 [DOI] [PubMed] [Google Scholar]
- Ampel, N. M. (2020). Coccidioidomycosis: Changing concepts and knowledge gaps. Journal of Fungi, 6, 354. 10.3390/jof6040354 [DOI] [PMC free article] [PubMed] [Google Scholar]
- Benedict, K. , McCotter, O. Z. , Brady, S. , Komatsu, k. , Sondermeyer Cooksey, G. L. , Nguyen, A. , et al. (2019). Surveillance for Coccidioidomycosis – United States, 2011–2017. Morbidity and Mortality Weekly Report, 68(7), 1–15. 10.15585/mmwr.ss6807a1 [DOI] [PMC free article] [PubMed] [Google Scholar]
- Brown, H. E. , Comrie, A. C. , Tamerius, J. , Khan, M. , Tabor, J. A. , & Galgiani, J. N. (2014). Climate, wind storms, and the risk of Valley fever (coccidioidomycosis). In Institute of Medicine, The Influence of Global Environmental Change on Infectious Disease Dynamics: Workshop Summary (pp. 266–282). The National Academies Press. 10.17226/18800 [DOI] [PubMed] [Google Scholar]
- CDC–Centers for Disease Control and Prevention . (2020). Valley Fever (Coccidioidomycosis) risk & prevention. Retrieved from https://www.cdc.gov/fungal/diseases/coccidioidomycosis/risk-prevention.html [Google Scholar]
- CDC–Centers for Disease Control and Prevention . (2021). Notifiable infectious disease data tables. Retrieved from https://www.cdc.gov/nndss/data-statistics/infectious-tables/index.html [Google Scholar]
- CDPH–California Department of Public Health . (2017). What you need to know about Valley Fever in California. Retrieved from https://www.cdph.ca.gov/Programs/CID/DCDC/CDPH%20Document%20Library/ValleyFeverBrochure.pdf [Google Scholar]
- Chow, J. C. , Watson, J. G. , Lowenthal, D. H. , Solomon, P. A. , Magliano, K. L. , Ziman, S. D. , & Richards, L. W. (1992). PM10 source apportionment in California's San Joaquin Valley. Atmospheric Environment, 26A(18), 3335–3354. 10.1016/0960-1686(92)90350-T [DOI] [Google Scholar]
- Chow, N. A. , Griffin, D. W. , Barker, B. M. , Loparev, V. N. , & Litvintseva, A. P. (2016). Molecular detection of airborne Coccidioides in Tucson, Arizona. Medical Mycology, 54, 584–592. 10.1093/mmy/myw022 [DOI] [PMC free article] [PubMed] [Google Scholar]
- Cisneros, R. , Brown, P. , Cameron, L. , Gaab, E. , Gonzalez, M. , Ramondt, S. , et al. (2017). Understanding public views about air quality and air pollution sources in the San Joaquin Valley, California. Journal of Environmental and Public Health, 2017, 4535142. 10.1155/2017/4535142 [DOI] [PMC free article] [PubMed] [Google Scholar]
- Colson, A. J. , Vredenburgh, L. , Guevara, R. E. , Rangel, N. P. , Kloock, C. T. , & Lauer, A. (2017). Large‐scale land development, fugitive dust, and increased coccidioidomycosis incidence in the Antelope Valley of California, 1999–2014. Mycopathologia, 182(5–6), 439–458. 10.1007/s11046-016-0105-5 [DOI] [PubMed] [Google Scholar]
- Coopersmith, E. J. , Bell, J. E. , Benedict, K. , Shriber, J. , McCotter, O. , & Cosh, M. H. (2017). Relating coccidioidomycosis (Valley fever) incidence to soil moisture conditions. GeoHealth, 1, 51–63. 10.1002/2016GH000033 [DOI] [PMC free article] [PubMed] [Google Scholar]
- Daniels, J. I. , Wilson, W. J. , DeSantis, T. Z. , Gouveia, F. J. , Anderson, G. L. , Shinn, J. H. , et al. (2002). Development of a quantitative TaqMan™‐PCR assay and feasibility of atmospheric collection for Coccidioides immitis for ecological studies. Final report on LDRD project 01‐ERD‐090. Lawrence Livermore National Laboratory. Retrieved from https://digital.library.unt.edu/ark:/67531/metadc1395747/m2/1/high_res_d/15002759.pdf [Google Scholar]
- Deresinski, S. , & Mirels, L. F. (2019). Coccidioidomycosis: What a long strange trip it's been. Medical Mycology, 57(Supplement 1), S3–S15. 10.1093/mmy/myy123 [DOI] [PMC free article] [PubMed] [Google Scholar]
- Dickson, E. C. (1938). Coccidioidomycosis: The preliminary acute infection with fungus Coccidioides . Journal of the American Medical Association, 111(15), 1362–1365. 10.1001/jama.1938.02790410018005 [DOI] [Google Scholar]
- Eager, J. D. , Herckes, P. , & Hartnett, H. E. (2017). The characterization of haboobs and the deposition of dust in Tempe, AZ from 2005 to 2014. Aeolian Research, 24, 81–91. 10.1016/j.aeolia.2016.11.004 [DOI] [Google Scholar]
- Egeberg, R. O. (1954). Coccidioidomycosis; its clinical and climatological aspects with remarks on treatment. Transactions of the American Clinical & Climatological Association, 65, 116–126. 10.1097/00000441-195403000-00005 [DOI] [PMC free article] [PubMed] [Google Scholar]
- Fisher, F. S. , Bultman, M. W. , Johnson, S. M. , Pappagianis, D. , & Zaborsky, E. (2007). Coccidioides niches and habitat parameters in the southwestern United States: A matter of scale. Annals of the New York Academy of Sciences, 1111(1), 47–72. 10.1196/annals.1406.031 [DOI] [PubMed] [Google Scholar]
- Flynn, N. M. , Hoeprich, P. D. , Kawachi, M. M. , Lee, K. K. , Lawrence, R. M. , Goldstein, E. , et al. (1979). An unusual outbreak of windborne coccidioidomycosis. New England Journal of Medicine, 301(7), 358–361. 10.1056/NEJM197908163010705 [DOI] [PubMed] [Google Scholar]
- Gade, L. , McCotter, O. Z. , Bowers, J. R. , Waddell, V. , Brady, S. , Carvajal, J. A. , et al. (2020). The detection of Coccidioides from ambient air in Phoenix, Arizona: Evidence of uneven distribution and seasonality. Medical Mycology, 58(4), 552–559. 10.1093/mmy/myz093 [DOI] [PubMed] [Google Scholar]
- Gerbis, N. (2021). Valley fever case rates still increasing as are dust storms. Retrieved from https://kjzz.org/content/1699360/valley-fever-case-rates-still-increasing-are-dust-storms [Google Scholar]
- Golan, J. J. , & Pringle, A. (2017). Long‐distance dispersal of fungi. Microbiology Spectrum, 5(4), 1–24. 10.1128/microbiolspec.FUNK-0047-2016 [DOI] [PubMed] [Google Scholar]
- Goodyear, D. (2014). Death dust: The valley fever menace. The New Yorker, January 20. Retrieved from https://www.newyorker.com/magazine/2014/01/20/death-dust [Google Scholar]
- Gorris, M. E. , Cat, L. A. , Zender, C. S. , Treseder, K. K. , & Randerson, J. T. (2018). Coccidioidomycosis dynamics in relation to climate in the southwestern United States. GeoHealth, 2, 6–24. 10.1002/2017GH000095 [DOI] [PMC free article] [PubMed] [Google Scholar]
- Gorris, M. E. , Treseder, K. K. , Zender, C. S. , & Randerson, J. T. (2019). Expansion of coccidioidomycosis endemic regions in the United States in response to climate change. GeoHealth, 3, 308–327. 10.1029/2019GH000209 [DOI] [PMC free article] [PubMed] [Google Scholar]
- Hall, C. A. , McCutcheon, G. , Morton, E. V. , Tindell, R. K. , & Weller, N. (2020). Strategies to curtail dust‐caused illness in Arizona: A policy memorandum to the Arizona Congressional Delegation. Journal of Science Policy & Governance, 16(1). Retrieved from https://www.sciencepolicyjournal.org/article_1038126_jspg_16_01_05.html [Google Scholar]
- Hugenholtz, P. (1957). Climate and coccidioidomycosis. In Proceedings of the Symposium on Coccidioidomycosis (pp. 136–143). U.S Public Health Services. Retrieved from https://www.google.com/books/edition/Proceedings_of_Symposium_on_Coccidioidom/jr4Tx9OZRT8C [Google Scholar]
- Jibson, R. W. (2002). A public health issue related to collateral seismic hazards: The Valley fever outbreak triggered by the 1994 Northridge, California earthquake. Surveys in Geophysics, 23(6), 511–528. 10.1023/A:1021226827679 [DOI] [Google Scholar]
- Khan, M. (2020). Trends in coccidioidomycosis incidence in Arizona, 1998–2017: Surveillance changes, weather, and land use (Doctoral dissertation). Emory University. Retrieved from https://etd.library.emory.edu/concern/etds/44558f540 [Google Scholar]
- Kolivras, K. N. , & Comrie, A. C. (2003). Modeling Valley fever (coccidioidomycosis) incidence on the basis of climate conditions. International Journal of Biometeorology, 47(2), 87–101. 10.1007/s00484-002-0155-x [DOI] [PubMed] [Google Scholar]
- Kolivras, K. N. , & Comrie, A. C. (2004). Climate and infectious disease in the southwestern United States. Progress in Physical Geography, 28(3), 387–398. 10.1191/0309133304pp417ra [DOI] [Google Scholar]
- Lader, G. , Raman, A. , Davis, J. T. , & Waters, K. (2016). Blowing dust and dust storms: One of Arizona's most Underrated weather Hazards. Retrieved from https://www.weather.gov/wrh/wrh_techmemo [Google Scholar]
- Lei, H. , & Wang, J. X. L. (2014). Observed characteristics of dust storm events over the western United States using meteorological, satellite, and air quality measurements. Atmospheric Chemistry and Physics, 14, 7847–7857. 10.5194/acp-14-7847-2014 [DOI] [Google Scholar]
- Maddy, K. T. (1965). Observations on Coccidioides immitis found growing naturally in soil. Arizona Medicine, 22(4), 281–288. Retrieved from https://archive.org/details/arizonamedicinej221unse/page/281/mode/2up [PubMed] [Google Scholar]
- National Weather Service . (2004). California's top 15 weather events of 1900s. Retrieved from https://www.wrh.noaa.gov/pqr/paststorms/california10.php [Google Scholar]
- NCEI–National Centers for Environmental Information . (2021). Storm events database. Retrieved from https://www.ncdc.noaa.gov/stormevents/ [Google Scholar]
- Nguyen, C. , Barker, B. M. , Hoover, S. , Nix, D. E. , Ampel, N. M. , Frelinger, J. A. , et al. (2013). Recent advances in our understanding of the environmental, epidemiological, immunological, and clinical dimensions of coccidioidomycosis. Clinical Microbiology Reviews, 26(3), 505–525. 10.1128/CMR.00005-13 [DOI] [PMC free article] [PubMed] [Google Scholar]
- NOAA ARL‐National Oceanic & Atmospheric Administration: Air Resources Laboratory . (2019). Gaussian plume model. Retrieved from https://www.ready.noaa.gov/READY_gaussian.php [Google Scholar]
- Ocampo‐Chavira, P. , Eaton‐Gonzalez, R. , & Riquelme, M. (2020). Of mice and fungi: Coccidioides spp. distribution models. Journal of Fungi, 6, 320. 10.3390/jof6040320 [DOI] [PMC free article] [PubMed] [Google Scholar]
- Ophüls, W. (1905). Further observations on a pathogenic mould (formerly described as a protozoan: Coccidioides immitis pyogenes). Journal of Experimental Medicine, 6, 443–486. 10.1084/jem.6.4-6.443 [DOI] [PMC free article] [PubMed] [Google Scholar]
- Pappagianis, D. , & Einstein, H. (1978). Tempest from Tehachapi takes toll or Coccidioides conveyed aloft and afar. Western Journal of Medicine, 129(6), 527–530. Retrieved from https://www.ncbi.nlm.nih.gov/pmc/articles/PMC1238466/ [PMC free article] [PubMed] [Google Scholar]
- Park, B. J. , Sigel, K. , Vaz, V. , Komatsu, K. , McRill, C. , Phelan, M. , et al. (2005). An epidemic of coccidioidomycosis in Arizona associated with climatic changes, 1998–2001. The Journal of Infectious Diseases, 191, 1981–1987. 10.1086/430092 [DOI] [PubMed] [Google Scholar]
- Pearson, D. , Ebisu, K. , Wu, X. , & Basu, R. (2019). A review of coccidioidomycosis in California: Exploring the intersection of land use, population movement, and climate change. Epidemiologic Reviews, 41, 145–157. 10.1093/epirev/mxz004 [DOI] [PubMed] [Google Scholar]
- Pu, B. , Ginoux, P. , Kapnick, S. , & Yang, X. (2019). Seasonal prediction potential for springtime dustiness in the United States. Geophysical Research Letters, 46, 9163–9173. 10.1029/2019GL083703 [DOI] [Google Scholar]
- Schneider, E. , Hajjeh, R. A. , Spiegel, R. A. , Jibson, R. W. , Harp, E. L. , Marshall, G. A. , et al. (1997). A coccidioidomycosis outbreak following the Northridge, Calif, earthquake. Journal of the American Medical Association, 277(11), 904–908. 10.1001/jama.1997.03540350054033 [DOI] [PubMed] [Google Scholar]
- Shriber, J. , Conlon, K. C. , Benedict, K. , McCotter, O. , & Bell, J. E. (2017). Assessment of vulnerability to coccidioidomycosis in Arizona and California. International Journal of Environmental Research and Public Health, 14(7), 680. 10.3390/ijerph14070680 [DOI] [PMC free article] [PubMed] [Google Scholar]
- Smith, C. E. (1940). Epidemiology of acute coccidioidomycosis with erythema nodosum (“San Joaquin” or “Valley Fever”). American Journal of Public Health, 30(6), 600–611. 10.2105/AJPH.30.6.600 [DOI] [PMC free article] [PubMed] [Google Scholar]
- Smith, C. E. , Beard, R. R. , Rosenberger, H. G. , & Whiting, E. G. (1946). Effect of season and dust control on coccidioidomycosis. Journal of the American Medical Association, 132(14), 833–838. 10.1001/jama.1946.02870490011003 [DOI] [PubMed] [Google Scholar]
- Sondermeyer Cooksey, G. L. , Wilken, J. A. , McNary, J. , Gilliss, D. , Shusterman, D. , Materna, B. L. , & Vugia, D. J. (2017). Dust exposure and coccidioidomycosis prevention among solar power farm construction workers in California. American Journal of Public Health, 107(8), 1296–1303. 10.2105/AJPH.2017.303820 [DOI] [PMC free article] [PubMed] [Google Scholar]
- Sprigg, W. A. , Nickovic, S. , Galgiani, J. N. , Pejanovic, G. , Petkovic, S. , Vujadinovic, M. , et al. (2014). Regional dust storm modeling for health services: The case of Valley fever. Aeolian Research, 14, 53–73. 10.1016/j.aeolia.2014.03.001 [DOI] [Google Scholar]
- Stacy, P. K. R. , Comrie, A. C. , & Yool, S. R. (2012). Modeling Valley fever incidence in Arizona using a satellite‐derived soil moisture proxy. GIScience and Remote Sensing, 49(2), 299–316. 10.2747/1548-1603.49.2.299 [DOI] [Google Scholar]
- Stewart, R. A. , & Meyer, K. F. (1932). Isolation of Coccidioides immitis from soil. PSEBM, 29, 937–938. 10.3181/00379727-29-6159 [DOI] [Google Scholar]
- Talamantes, J. , Behseta, S. , & Zender, C. S. (2007). Statistical modeling of Valley fever data in Kern County, California. International Journal of Biometeorology, 51, 307–313. 10.1007/s00484-006-0065-4 [DOI] [PubMed] [Google Scholar]
- Tamerius, J. D. , & Comrie, A. C. (2011). Coccidioidomycosis incidence in Arizona predicted by seasonal precipitation. PLoS One, 6(6), e21009. 10.1371/journal.pone.0021009 [DOI] [PMC free article] [PubMed] [Google Scholar]
- Taylor, J. W. , & Barker, B. M. (2019). The endozoan, small‐mammal reservoir hypothesis and the life cycle of Coccidioides species. Medical Mycology, 57, S16–S20. 10.1093/mmy/myy039 [DOI] [PMC free article] [PubMed] [Google Scholar]
- Tong, D. Q. , Wang, J. X. L. , Gill, T. E. , Lei, H. , & Wang, B. (2017). Intensified dust storm activity and Valley fever infection in the southwestern United States. Geophysical Research Letters, 44, 4304–4312. 10.1002/2017GL073524 [DOI] [PMC free article] [PubMed] [Google Scholar]
- Turner, D. B. (1994). Workbook of atmospheric dispersion estimates: An introduction to dispersion modeling (2nd ed.). CRC Press. 10.1201/9780138733704 [DOI] [Google Scholar]
- Weaver, E. A. , & Kolivras, K. N. (2018). Investigating the relationship between climate and Valley fever (coccidioidomycosis). EcoHealth, 15, 840–852. 10.1007/s10393-018-1375-9 [DOI] [PubMed] [Google Scholar]
- Weaver, E. A. , Kolivras, K. N. , Thomas, R. Q. , Thomas, V. A. , & Abbas, K. M. (2020). Environmental factors affecting ecological niche of Coccidioides species and spatial dynamics of Valley fever in the United States. Spatial and Spatio‐temporal Epidemiology, 32, 100317. 10.1016/j.sste.2019.100317 [DOI] [PubMed] [Google Scholar]
- Zender, C. S. , & Talamantes, J. (2006). Climate controls on Valley fever incidence in Kern County, California. International Journal of Biometeorology, 50, 174–182. 10.1007/s00484-005-0007-6 [DOI] [PubMed] [Google Scholar]
Associated Data
This section collects any data citations, data availability statements, or supplementary materials included in this article.
Data Availability Statement
The dust storm and coccidioidomycosis data used in this research are available at https://doi.org/10.5281/zenodo.5201801.


