

Abstract
Purpose
Hyperpolarized 15N‐labeled molecules have been proposed as imaging agents for investigating tissue perfusion and pH. However, the sensitivity of direct 15N detection is limited by the isotope's low gyromagnetic ratio. Sensitivity can be increased by transferring 15N hyperpolarization to spin‐coupled protons provided that there is not significant polarization loss during transfer. However, complete polarization transfer would limit the temporal window for imaging to the order of the proton T1 (2‐3 s). To exploit the long T1 offered by storing polarization in 15N and the higher sensitivity of 1H detection, we have developed a pulse sequence for partial polarization transfer.
Methods
A polarization transfer pulse sequence was modified to allow partial polarization transfer, as is required for dynamic measurements, and that can be implemented with inhomogeneous B1 fields, as is often the case in vivo. The sequence was demonstrated with dynamic spectroscopy and imaging measurements with [15N2]urea.
Results
When compared to direct 15N detection, the sequence increased the signal‐to‐noise ratio (SNR) by a factor of 1.72 ± 0.25, where both experiments depleted ~20% of the hyperpolarization (>10‐fold when 100% of the hyperpolarization is used). Simulations with measured cross relaxation rates showed that this sequence gave up to a 50‐fold increase in urea proton polarization when compared to spontaneous polarization transfer via cross relaxation.
Conclusion
The sequence gave an SNR increase that was close to the theoretical limit and can give a significant SNR benefit when compared to direct 13C detection of hyperpolarized [13C]urea.
Keywords: hyperpolarization, indirect detection, nitrogen‐15, urea
1. INTRODUCTION
Magnetic resonance imaging of hyperpolarized isotopically labeled substrates has enabled measurements of metabolic fluxes, pH, and tissue perfusion in vivo. The most commonly used label has been 13C because of its relatively long polarization lifetime and the availability of 13C‐labeled substrates suitable for investigating metabolism. 1 Hyperpolarized 15N‐labeled substrates have also been investigated, as agents for assessing tissue perfusion (urea 2 and glutamine 3 ) and as pH probes (pyridine derivatives). 4 15N labeled substrates have the advantage of very long hyperpolarization lifetimes, up to 200 s, and more when kept in 2H2O. 2 However, the 2.5‐fold lower gyromagnetic ratio when compared to 13C (10‐fold lower when compared to 1H) results in lower magnetization and precession frequency and therefore lower sensitivity of detection. For imaging there is also the requirement for larger gradients.
Detection sensitivity can be improved, while still benefiting from the long 15N polarization lifetime, using sequences such as insensitive nuclei enhanced by polarization transfer (INEPT) to transfer hyperpolarization from 15N to 1H immediately before signal acquisition. 5 Reverse INEPT‐type sequences have been used previously with hyperpolarized 13C‐labeled substrates to produce hyperpolarized proton spectra 6 , 7 , 8 , 9 and images 10 , 11 and with hyperpolarized 15N labeled substrates to produce spectra. 12 , 13 , 14 In all of these INEPT‐based experiments 100% of the available polarization was used in a single acquisition. To obtain dynamic information the hyperpolarization of the low γ nucleus must be sampled in discrete packets in order to allow repeat measurements, which in the case of direct 15N or 13C detection is achieved using small flip angle (FA) pulses. For example, in the case of dynamic perfusion measurements with hyperpolarized [15N2]urea only a portion of the 15N polarization should be transferred to the urea protons at each measurement. The same is true for measurements of flux in an enzyme‐catalyzed reaction, for example exchange of hyperpolarized 13C label between injected [1‐13C]pyruvate and the endogenous lactate pool.
Several approaches have been taken to achieve partial transfer of polarization. Harris et al 13 used spatially selective coherence transfer to probe different regions of the sample at different times. Barb et al exploited chemical exchange of deuterons in hyperpolarized 15ND2‐amido‐glutamine with solvent protons to acquire a series of proton spectra from the protonated isotopologue. 12 Dzien et al 7 utilized spontaneous 13C → 1H cross‐relaxation to detect, in a series of dynamically acquired proton spectra, the production of acetaldehyde from hyperpolarized [U‐2H3,2‐13C]pyruvic acid, in the reaction catalyzed by pyruvate decarboxylase. We have previously described a spectrally selective reverse INEPT sequence in which 13C hyperpolarization in lactate, which had been produced in a tumor from injected hyperpolarized [1‐13C]pyruvate, was transferred to the methyl protons and imaged. 11 In this case the fully depleted [1‐13C]lactate hyperpolarization was replenished after each transfer by further labeled lactate production from the injected pyruvate. However, to the best of our knowledge, no one has yet demonstrated experimentally partial transfer of hyperpolarization from a low γ to a high γ nucleus, while maintaining the majority of the hyperpolarization in the low γ nucleus. We demonstrate here partial transfer of 15N hyperpolarization in [15N2]urea to urea protons (Figure 1) in consecutive acquisitions and subsequent imaging of these protons, as would be required for dynamic imaging of tissue perfusion. The sensitivity of urea proton detection in this experiment was compared with direct 15N detection and, in simulations using measured cross relaxation rates, with proton detection where polarization is transferred spontaneously from 15N to 1H via the nuclear Overhauser enhancement (NOE).
FIGURE 1.
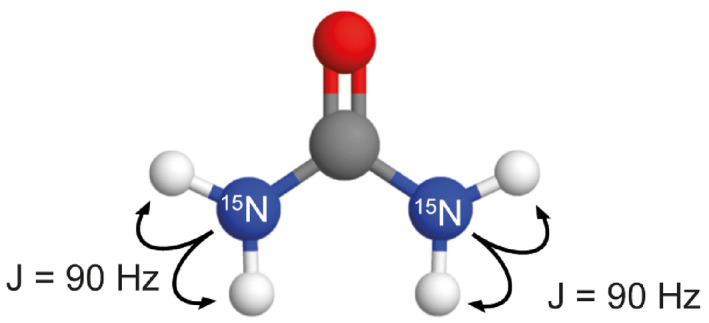
Structure of [15N2]urea. The coupling constant between 15N and the directly bonded protons is 90 Hz. These protons are in exchange with solvent water
2. METHODS
2.1. Solvent exchange of [15N2]urea protons
The exchange rate in a 100 mM [15N2]urea solution was measured at neutral pH using a 14.1 T nuclear magnetic resonance (NMR) spectrometer equipped with a 5 mm BBI probe (Bruker Spectrospin Ltd., Coventry, UK). The water proton resonance was saturated for between 0.1 and 2.6 s and then spectra acquired using a 90° pulse and a bandwidth of 6000 Hz into 8192 complex points. The exchange rate was calculated as described in Ref. 15.
2.2. Relaxation times
1H and 15N relaxation times in [15N2]urea were measured on an Agilent 7 T preclinical scanner (Agilent, Palo Alto, California) using a home‐built single turn dual‐tuned 1H/15N transmit/receive surface coil 16 with an inner diameter of 14 mm. The same coil was used for polarization transfer experiments. The sample contained 3 mL of 1 M [15N2]urea in phosphate‐buffered saline (PBS) and 300 μL 2H2O at 20°C. T 1 relaxation times were measured with an inversion recovery sequence (n = 1, TR 1H = 10 s, TR 15N = 100 s). The time between the 90° and 180° pulses was varied between 0.25 and 8 s for the 1H measurements and between 2.5 and 80 s for the 15N measurements. T 2 relaxation times were measured with a Carr‐Purcell‐Meiboom‐Gill (CPMG) sequence (n = 1, TR 1H = 10 s, TR 15N = 100 s). The minimum echo time for the 1H measurements was 0.0125 s, which was increased by iteratively adding more spin echo sandwiches while leaving the inter echo spacing the same until, over six acquisitions, the maximum echo time of 0.4 s was reached. For 15N T 2 measurements the echo time was varied between 0.0624 and 2 s.
2.3. Dynamic nuclear polarization
Samples were prepared from 45.9 mg [15N2]urea, 2.31 mg OXO63 trityl radical, 62.8 mg 2H2O, and 55.4 mg glycerol. The mixture (37.5 mg) was polarized for at least 3 hours in a HyperSense polarizer (Oxford Instruments, Abingdon, UK) using microwave irradiation at 94.110 GHz. Dissolution was performed in 6 mL 2H2O because this has been shown to prolong the 15N T1 (2). [13C]urea was hyperpolarized as described by von Morze et al. 17 The [13C]urea preparation contained 6.4 M [13C]urea and 23 mM OXO63 in glycerol. The preparation (29.4 mg) was polarized at 94.095 GHz and dissolved in 6 mL PBS.
2.4. Polarization measurements
Spectra were acquired using a 90° pulse and a sweep width of 20 kHz into 16 384 complex points from 4 mL of hyperpolarized urea using a 14.1 T NMR spectrometer and a 10 mm BBO probe (Bruker Spectrospin Ltd.) at room temperature. The signal‐to‐noise ratio (SNR) was compared to that in spectra of the same solution after decay of the hyperpolarization. For these experiments, measurements at thermal equilibrium from [13C]urea were acquired with a pulse repetition time (TR) of 225 s and were the sum of 237 averages. For [15N2]urea the TR was 1000 s and 32 averages were acquired. The thermal polarization:
| (1) |
was calculated to be 4.87 × 10⁻⁶ for 15N and 12.08 × 10⁻⁶ for 13C, assuming a temperature of 300 K, where ℏ is the reduced Planck's constant, ɣ the gyromagnetic ratio, kB Boltzmann's constant, and B 0 = 14.1 T. The hyperpolarization, Phyp , was calculated from the SNRs of the hyperpolarized and thermal measurements using:
| (2) |
The measured polarization was 6.2% for [13C]urea and 2.3% for [15N2]urea. The value for 15N was lower than the 5% reported previously,2 and the value for 13C was between a value of 3% reported in vivo 17 and a value of 10% estimated at the time of injection. 18
2.5. Measurement of coil performance
A cylindrical phantom containing 2 mL of 4 M [15N2]urea was placed through the loop of the dual‐tuned resonator and 1H and 15N spectra acquired with a sweep width of 10 kHz into 2048 complex points with one average using a 2 ms BIR4 90° pulse, with pulse shape parameters as described by Merkle et al. 19 Coil performance at the 1H and 15N frequencies was assessed by comparing the SNRs of the two spectra.
2.6. Pulse sequence
The INEPT pulse sequence, 5 which transfers polarization from S to I spins via J‐coupling, can be written as:
where full transfer of polarization is achieved when τ 1,2 = 1/(4 J). Simultaneous application of 90° pulses to the I and S spins converts an antiphase state of the S spins to an observable antiphase state in the I spins. A later version of this sequence 20 refocuses the I spin magnetization.
In an IS spin system full transfer occurs when all the delays τ 1,2,3,4 are 1/(4 J). Merkle et al 19 later described a sequence that used composite pulses to compensate for B 1 inhomogeneity:
These composite pulses were later replaced with modified BIR4 pulses to produce the BINEPT sequence, which is the basis of the pulse sequence described here.
A BIR4 pulse 21 is composed of three sections: adiabatic half‐passage in reverse, adiabatic inversion, and adiabatic half‐passage. The FA is controlled by two phase jumps Δϕ 1 and Δϕ 2 = −Δϕ 1 before and after the adiabatic inversion segment respectively. The transformation induced by a BIR4 pulse can be described using a composite pulse analogy, where () is analogous to a BIR4 pulse with phase jumps Δϕ 1 = −Δϕ 2 = π+δ/2. Both the BIR4 pulse and this composite pulse execute a rotation of δ rad about the x axis, although a composite pulse requires a considerably more uniform B 1 field to achieve this transformation. With this simplification, the BINEPT sequence can be written as:
where for this example the I spin is proton and the S spin 15N. For δ = π/2 this is identical with the composite pulse sequence and is analogous to the BINEPT sequence using adapted BIR4 pulses in terms of net rotations; however, the paths taken by the magnetization vectors differ. In this simplified sequence, the phase offset δ of the first 180° pulse on the S spin must be 90° and τ 1‐4 must be 1/(4 J) in order to fully transfer polarization from the S to the I spin in a two‐spin system. When τ1 and τ2 are shortened and the phase offset δ adjusted, some of the magnetization can be returned to the z axis while still transferring some of the polarization. For a simple IS spin system the transferred polarization (PI ) is equal to sin(δ)sin(π J τ)P 0 and the polarization returned to the z axis (PS) is equal to −cos(δ)cos(π J τ)P 0, where P 0 is the original polarization, J is the coupling constant between the I and S spins and τ = 2τ1 = 2τ 2 (see product operator analysis in the Supporting Information Text S1). In all cases, τ 3 = τ 4 = 1/(4 J). For an ISN spin system these terms are PI = N sin(δ)sin(π J τ) and PS = −cos(δ)[cos(π J τ)] N . A similar approach has been described previously in the HINDER sequence (hyperpolarized insensitive nucleus delivers enhancement repeatedly), 22 where spin order is divided between I or S spin polarization by changing the phase, δ, of the second 90° pulse on the S spin and shortening the inter pulse delays in the classical INEPT sequence. To summarize, we have combined the BINEPT and HINDER sequences to give an ImpeRfection RobUst Partial Transfer (IRRUPT) sequence, where δ and τ 1 and τ 2 in the BINEPT sequence can be adjusted to achieve partial polarization transfer. An additional 180 degrees was added to δ to return the remaining magnetization to the positive instead of the negative axis (making PI = −cos(δ)[cos(π J τ)] N positive). The delays between the pulses (τ 1‐4) and the additional phase offset δ in the segmented BIR4 pulse on the S spin were chosen as described for the HINDER sequence. 22 For two protons coupled with a 90 Hz coupling constant (J) to one low γ nucleus: τ 1 + τ 2 = 0.442/(2 π J) = 782 µs, τ 3 + τ 4 = 1/(2 J) = 5555 µs, δ = 18.050°. The delays were not corrected for the fact that relatively long adiabatic pulses were used instead of hard pulses. With adiabatic pulses in the simulations these parameters resulted in ~20% of the 15N hyperpolarization being transferred to the coupled protons (J NH = −90 Hz) (Figure 2). Each adiabatic half passage segment in the BIR4 pulse was 500 μs, giving a total pulse duration of 2 ms The last BIR4 pulse in the sequence flips the proton magnetization onto the z axis. Then, either a simple excitation pulse or a slice‐selective 2D‐single‐shot echo‐planar imaging (EPI) sequence was used for proton acquisition. In both cases a 90° pulse was used in order to make maximum use of the transferred polarization.
FIGURE 2.
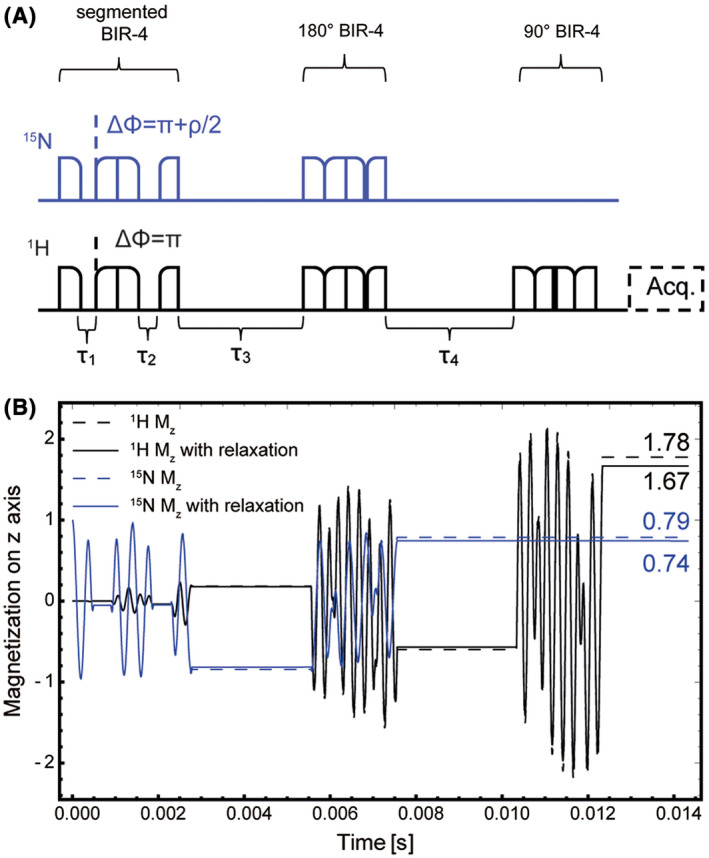
Timing (A) and simulation (B) of the ImpeRfection RobUst Partial Transfer (IRRUPT) polarization transfer pulse sequence, which is based on the B1‐insensitive nuclear enhancement throughpolarization transfer (BINEPT) 19 and hyperpolarized insensitive nucleus delivers enhancement repeatedly (HINDER) 22 sequences, with τ 1 + τ 2 = 0.442/(2 π JNH ) = 782 µs, τ 3 + τ 4 = 1/(2 JNH ) = 5555 µs, δ = 18.050°. The sequence was simulated with a maximum B1 amplitude of 2500 Hz for 15N and 4000 Hz for 1H
2.7. Simulation of the IRRUPT pulse sequence
Evolution of the 15N and 1H magnetizations were simulated using SpinDynamica 23 (www.spindynamica.soton.ac.uk) in Wolfram Mathematica (version 11; Wolfram Research, Inc, Champaign, Illinois). The Hamiltonian describing the [15N2]urea spin system is:
| (3) |
where JNH is the negative heteronuclear coupling constant, 24 is the product operator for the 15N spin, and and the operators for the two equivalent protons. To simulate the effect of off‐resonance excitation, the term
| (4) |
was added to the Hamiltonian. v0,15N and v0,1H are the excitation frequency offsets in Hz. To estimate relaxation losses the PhenomenologicalRelaxationSuperoperator function in SpinDynamica was used with the measured T 1 and T 2 times. An uncorrelated relaxation model was assumed. We define the proton polarization P1H divided by the depleted 15N polarization (1‐P 15N ) at the end of the transfer block as the efficiency of polarization transfer (efficiency = P 1H /(1−P 15N )), which was typically >80% (Figure 3).
FIGURE 3.
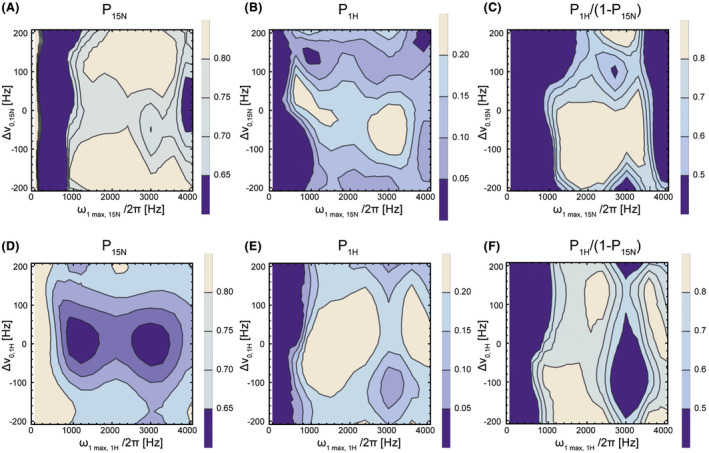
Simulations of the ImpeRfection RobUst Partial Transfer (IRRUPT) pulse sequence. Remaining 15N polarization (P15N) after one transfer as a function of (A) 15N excitation frequency offset and 15N maximum pulse amplitude and (D) 1H excitation frequency offset and 1H maximum pulse amplitude. 1H polarization (P1H) after one transfer as a function of (B) 15N excitation frequency offset and 15N maximum pulse amplitude and (E) 1H excitation frequency offset and 1H maximum pulse amplitude. Polarization transfer efficiency P1H/(1−P15N) as a function of (C) 15N excitation frequency offset and 15N maximum pulse amplitude and (F) 1H excitation frequency offset and 1H maximum pulse amplitude. The asymmetry in the profiles results from the use of adiabatic pulses
2.8. Polarization transfer in phantom experiments
Polarization transfer experiments were performed on the 7 T scanner using the dual‐tuned home‐built surface coil. A spherical phantom filled with 3 mL water was positioned in the magnet isocenter. For hyperpolarized acquisitions, 1.5 mL of water were removed and replaced with 1.5 mL hyperpolarized [15N2]urea solution. Spectra were acquired with a 2 ms 90° BIR4 excitation pulse after the polarization transfer block, with TR = 2s, sweep width = 100 kHz, number of points = 4096. Images were acquired with a 2D EPI sequence after the polarization transfer block. Six water presaturation pulses with crusher gradients were used prior to the polarization transfer block for both imaging and spectroscopy experiments. Images were acquired with FOV = 32 × 32 × 1 mm, TR = 1s, bandwidth = 250 kHz, matrix size = 32 × 32.
2.9. Interleaved direct and indirect detection
The SNR benefits of indirect over direct detection were determined by interleaving the two acquisition strategies. After injection of 1.5 mL hyperpolarized [15N2]urea three direct detection 15N spectra were acquired using 30° pulses followed by three indirect polarization transfer measurements (with no water pre saturation), then three direct detection measurements followed by another three indirect detection measurements. Each spectrum was phase and baseline corrected and then normalized to the standard deviation of the noise in the first 400 points at the downfield end of the spectrum. The indirect detection 1H spectra were further corrected to account for depletion of polarization due to the prior direct 15N detection. This was achieved by multiplying spectra 4, 5, and 6 (indirect detection) by three times the reciprocal of the average signal loss between spectra 1 and 2 and between spectra 2 and 3 (direct detection). Spectra 10, 11, and 12 were corrected in a similar way but using a factor calculated from the signal loss between spectra 7 and 8 and between spectra 8 and 9. The 1H spectra were recorded with a sweep width of 10 kHz into 2048 complex points, an acquisition time of 204.8 ms and a TR of 500 ms The directly detected 15N spectra were acquired with a nominal 30° FA pulse, sweep width 10 kHz, 2048 complex points, TR = 500 ms, which were the same acquisition parameters as used for the indirect measurements. The SNRs were calculated by integrating a 60 point‐wide region containing the peak and dividing it by the standard deviation of the noise in the 400 point‐wide region at the downfield end of the spectrum.
2.10. Simulations of spontaneous polarization transfer from 15N to 1H via cross relaxation
Heteronuclear cross relaxation rates in [15N2]urea were measured by inverting the water and urea 1H resonances in a 500 mM thermally polarized [15N2]urea solution and observing the 15N resonance (Figure 4). Measurements were made at 310 K using a 5 mm Bruker BBI probe at 14.1 T, with 10% 2H2O for a field‐frequency lock. The 1H and 15N magnetizations can be described by the following equations:
| (5) |
| (6) |
FIGURE 4.
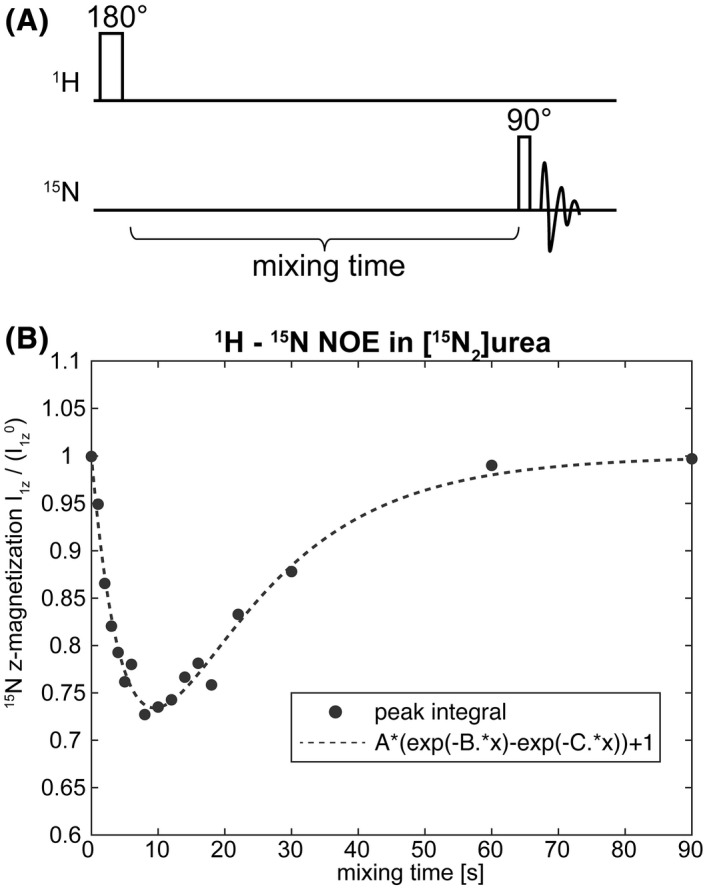
A, Pulse sequence used to measure the 1H−15N cross relaxation rate in a 500 mM [15N2]urea sample. B, Plot of 15N signal versus mixing time. Signal intensity was fitted to an analytical solution of the Solomon equations (Equations 5 and 6). NOE, nuclear Overhauser enhancement
Where I 1 is the 15N and I 2 the 1H magnetizations. Following the 180° 1H pulse at t = 0:
| (7) |
| (8) |
For this boundary condition the system of differential equations (Equations (5), (6)) has a solution of the form , where, from an initial rate approximation, the cross relaxation rate between 1H and 15N (. 25 This describes the combined cross relaxation between water (intermolecular NOE) and urea protons (intramolecular NOE) and the nitrogen‐15 in [15N2]urea and represents an upper limit for the intramolecular relaxation rate. From this an upper limit for the reverse rate (15N to 1H), , was calculated using the relation , where N1/N2 is the concentration ratio of the nuclei. 26 We were interested in only intramolecular cross relaxation, because this would give the greatest enhancement, N1/N2 = 0.5. In the case of intermolecular cross relaxation the 15N hyperpolarization would be diluted among the many participating water protons and give a much smaller 1H enhancement. 26 The measured cross relaxation rates and were then used to calculate the spontaneous transfer of polarization from 15N to urea protons that would occur in hyperpolarized [15N2]urea. The degree of transfer was compared with that produced by repeated application of the IRRUPT sequence, calculated using SpinDynamica.
3. RESULTS
Implementation of polarization transfer sequences using a surface coil requires the use of inversion pulses that compensate for B1 inhomogeneity. Furthermore, for dynamic measurements, polarization should be transferred in discrete packets from the hyperpolarized lower γ nucleus, in this case 15N, to the detected high γ nucleus, in this case 1H. We have modified the previously described BINEPT sequence, 19 which uses BIR4 adiabatic pulses, 21 for partial and sequential transfer of polarization from 15N to 1H (see Methods section for details).
3.1. Simulations of the IRRUPT pulse sequence
The sequence was simulated with the delays and phases used experimentally (τ 1 + τ 2 = 0.442/(2 π JNH ) = 782 µs, τ 3 + τ 4 = 1/(2 JNH ) = 5555 µs, δ = 18.050°), which resulted in 21% of the 15N polarization being transferred to 1H and a 1H z‐magnetization that was 1.78 times greater than the initial 15N z‐magnetization (Figure 2B). Polarization loss due to relaxation is minimal because transfer via the strong coupling (JNH = −90 Hz) is fast (~12 ms) and the simulation (Figure 2B) showed that this can be neglected. Simulations using measured relaxation rates (Table 1), showed that these values were reduced only slightly, from 79% to 74% for the remaining 15N magnetization and from 1.78 to 1.67 for the 1H magnetization. In further simulations the effect of the pulse sequence was simulated for a large range of excitation frequency offsets and pulse amplitudes (Figure 3). Transfer efficiency was preserved for large regions of parameter space, demonstrating the sequence's insensitivity to B1 inhomogeneity.
TABLE 1.
1H and 15N relaxation times in [15N2]urea measured at 7 T. 1 M [15N2]urea in phosphate‐buffered saline containing 10% 2H2O at 20°C
| [15N2]urea | T 1 relaxation time (s) | T 2 relaxation time (s) |
|---|---|---|
| 1H | 2.57 ± 0.08 | 0.060 ± 0.003 |
| 15N | 24.22 ± 1.15 | 1.62 ± 0.94 |
3.2. Effect of solvent exchange on urea proton hyperpolarization
The polarization transferred from 15N to the urea protons will be diluted by exchange with solvent water protons, decreasing the sensitivity of detection. However, this effect is small. The proton exchange rate between urea and water was determined by fitting the peak integrals following saturation I(tsat ) to the equation given by Horska and Spencer 15 :
| (9) |
where c is a dimensionless factor, T 1 is the urea proton relaxation time, tsat are the presaturation times, and k the exchange rate. This gave c = (1.14 ± 0.09), k = (1.56 ± 0.15) s−1, and T 1 = (2.73 ± 0.38) s. The errors are those for the fitting. The measured lifetime for a proton in urea (1/k) was 0.64 ± 0.06 s, which is similar to that measured previously for 1 M urea at pH 7 (0.55 s). 27 The IRRUPT sequence, including the flip‐back pulse, takes only ~12 ms and therefore the effect of solvent exchange on the urea proton hyperpolarization can be ignored.
3.3. Experimental implementation of the pulse sequence
Partial transfer of polarization from 15N to urea protons in [15N2]urea using IRRUPT can be used for dynamic spectral acquisition (Figure 5A) or for imaging (Figure 5B). The 90 Hz splitting in the urea 1H spectra is due to the 1H‐15N coupling. 28 The remaining signal at the end of the dynamic spectral acquisition (Figure 5A) is residual signal from water protons.
FIGURE 5.
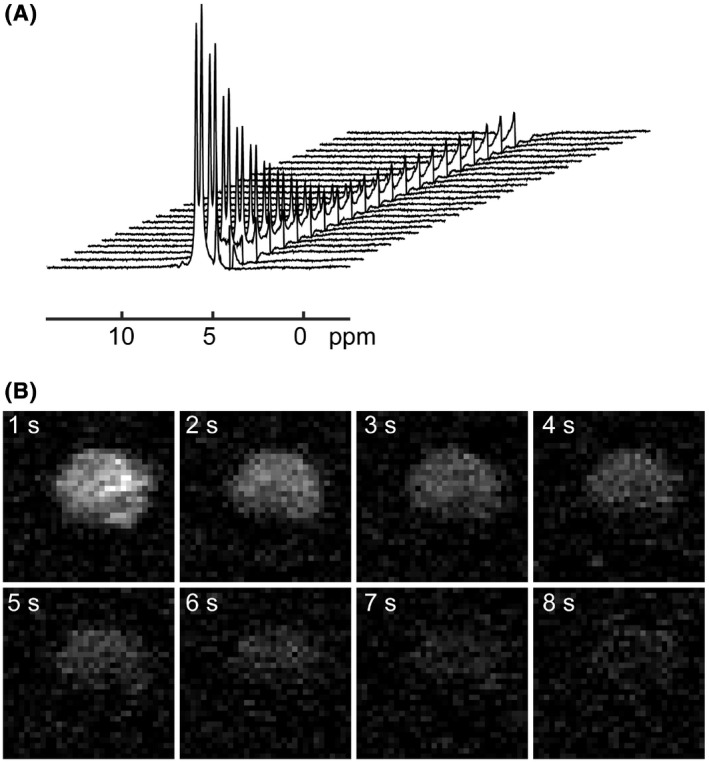
A, Dynamic 1H spectra of hyperpolarized [15N2]urea. Each spectrum was acquired with an ImpeRfection RobUst Partial Transfer (IRRUPT) polarization transfer block followed by a 90° BIR4 excitation pulse. Parameters were TR = 2s, sweep width = 10 000 Hz, number of points = 4096. B, Dynamic 1H images of hyperpolarized [15N2]urea. The images were acquired with a 2D EPI sequence after successive polarization transfer blocks. Imaging parameters were FOV = 32 × 32 × 1 mm, TR = 1s, bandwidth = 250 kHz, matrix size = 32 × 32. The [15N2]urea concentration was 50 mM in both cases
3.4. Comparison of direct and indirect detection of [15N2]urea in interleaved acquisitions
The SNR in the indirect detection spectra recorded immediately after the direct detection spectra was significantly higher (Figure 6A). There was an ~8 s delay in changing from one pulse sequence to the next. After correcting for depletion of polarization in the preceding direct detection experiment there was a 2.09 ± 0.31(SD)‐fold improvement in SNR in the indirect detection experiment (Figure 6B). Each indirect measurement led to 20% depletion of the 15N polarization. Comparing spectrum 1 with 2 and 2 with 3, and similarly spectrum 7 with 8 and 8 with 9 shows that each of the direct acquisitions depleted 13 ± 7 (SD)% of the polarization, which corresponds to a FA of 30° (acos(0.87) = 30°). To compare the SNR of the directly and indirectly detected spectra, we corrected the SNR improvement factor of 2.09 ± 0.31 by sin30°/sin37°, which corrects for the fact that the indirect experiment depleted 20% of the 15N polarization (cos(37°) = 0.8) whereas the direct detection experiment depleted 13% of the polarization. This gives a corrected improvement in the SNR of 1.72 ± 0.25. The improvement in SNR was less than expected, reflecting a poorer than expected performance of the 1H circuit in the dual‐tuned 1H/15N transmit/receive surface coil. The ratio of the SNRs in 1H and 15N spectra acquired using this coil from thermally polarized 4M [15N2]urea was 59.9. When corrected for the number of contributing nuclei per molecule (four protons, two 15N nuclei) and the different thermal polarizations calculated using Equation (1) this gave an effective SNR enhancement (ε) of 6.07 when detecting 1H versus 15N for a given level of polarization. For example, if the SNR of an 15N acquisition is 10, the SNR of a 1H acquisition at the same nucleus concentration and polarization will be 60.7. This value for ε was less than an expected value of 54.92, if coil noise dominates, and a value of 9.86 if sample noise dominates (Equation 10).
FIGURE 6.
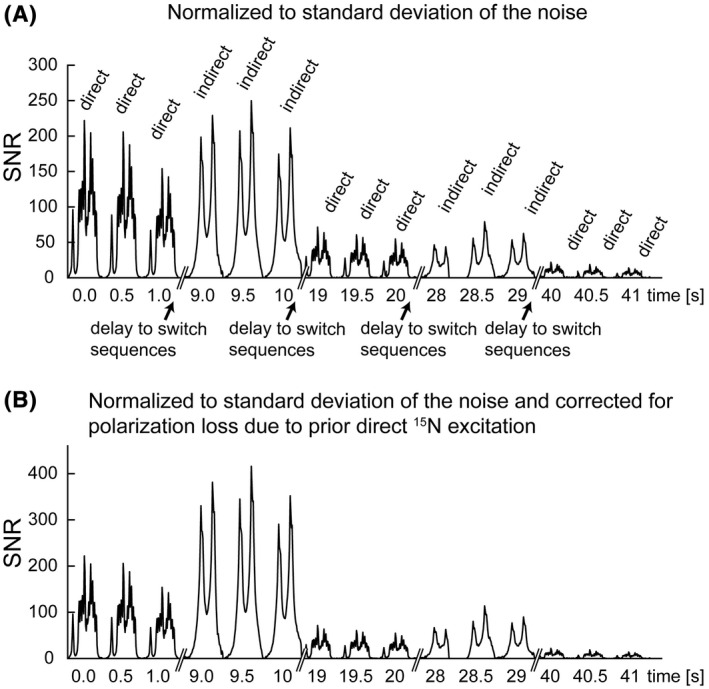
Interleaved direct 15N detection and indirect 1H detection of hyperpolarized [15N2] urea. A, The spectra were scaled so that the noise was the same in all the spectra. B, Indirect detection spectra additionally corrected for depletion of polarization due to the prior direct detection experiment. SNR, signal‐to‐noise ratio
3.5. Spontaneous transfer of polarization between 15N and 1H in hyperpolarized [15N2]urea
Several studies have reported spontaneous transfer of hyperpolarization from a low γ nucleus to protons via cross relaxation. 29 , 30 , 31 , 32 , 33 Using the measured cross relaxation rates (Figure 4B) we simulated transfer of polarization via cross relaxation and compared it with that obtained via J‐coupling using the IRRUPT pulse sequence. Polarization transfer via the spin coupling between 15N and 1H gave up to a 50‐fold higher proton polarization than that obtained via cross relaxation, although inevitably, because it depleted the 15N polarization more rapidly, this was sustained over a shorter period of time (Figure 7).
FIGURE 7.
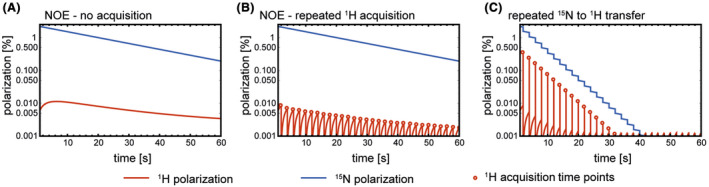
Simulation of polarization transfer due to cross relaxation between 15N and 1H in hyperpolarized [15N2]urea, where 15N hyperpolarization at t = 0 is 2.3%. A, Time dependence of the 15N and 1H polarizations. B, 15N and 1H polarizations following a series of 90° 1H pulses applied at 2 s intervals. C, 15N and 1H polarizations following repeated application of the ImpeRfection RobUst Partial Transfer (IRRUPT) pulse sequence at 2 s intervals. NOE, nuclear Overhauser enhancement
4. DISCUSSION
The signal detected by a receiver coil increases with the square of the detection frequency, ν2. However, coil and sample noise also increase as ν1/4 to ν, depending on the source of the noise. Therefore, the overall increase in the SNR as a function of ν is given by Wang et al 11 and Hoult and Lauterbur 34 :
| (10) |
where a and b are coil geometry parameters and α and β are weightings for the two sources of noise, where α represents coil noise and β sample noise. Equation 10 can be used when comparing the SNR of a direct detection experiment with a 90° pulse with an indirect detection experiment in which all the available polarization is transferred with perfect efficiency to the coupled high γ nucleus. However, for dynamic measurements only small portions of the hyperpolarization should be used at any one time, either by using a small FA pulse in the direct detection experiment or by using partial polarization transfer in the indirect experiment. In this situation we also need to consider the residual polarization left following each excitation because this represents the longitudinal magnetization available for subsequent excitation. 35 The detectable transverse magnetization in a direct detection experiment depends on the FA thus:
| (11) |
Expressing the detectable magnetization in terms of the z‐magnetization used then:
| (12) |
In an indirect detection experiment the detected transverse magnetization in the higher γ nucleus is proportional to the gain from the higher precession frequency (γ 1H/γ 15N) multiplied by the z‐magnetization used in the lower γ nucleus:
| (13) |
Comparing Equations (12) and (13) shows, that if
| (14) |
then transferring polarization to the higher γ nucleus will result in greater transverse magnetization than would be obtained by direct detection of the lower γ nucleus. However, the actual gain in SNR will depend on coil performance at the two different resonance frequencies. For indirect detection versus direct detection in a polarization transfer experiment with perfect transfer efficiency, which is effectively the case here (see Figure 3C,F), then the gain in SNR is given by:
| (15) |
where is the coil performance given by Equation (10). This is illustrated in Figure 8A, where the SNR of direct 15N detection with a 90° pulse is assumed to be 1. The SNR improvement for different detection strategies (15N direct detection, 15N → 1H indirect detection, or 13C direct detection) as a function of the magnetization used per acquisition are indicated. The upper and lower bounds for the improvement in SNR are determined by whether coil or sample noise dominates respectively. Direct experimental measurements of gave a value of 6.07, which was less than the lower bound given by Equation (10), reflecting poorer than expected performance of the 1H circuit in the dual tuned coil. However, with this experimentally determined value for there was good agreement between the theoretical gain in SNR for indirect 15N detection and that measured experimentally (Figure 8B).
FIGURE 8.
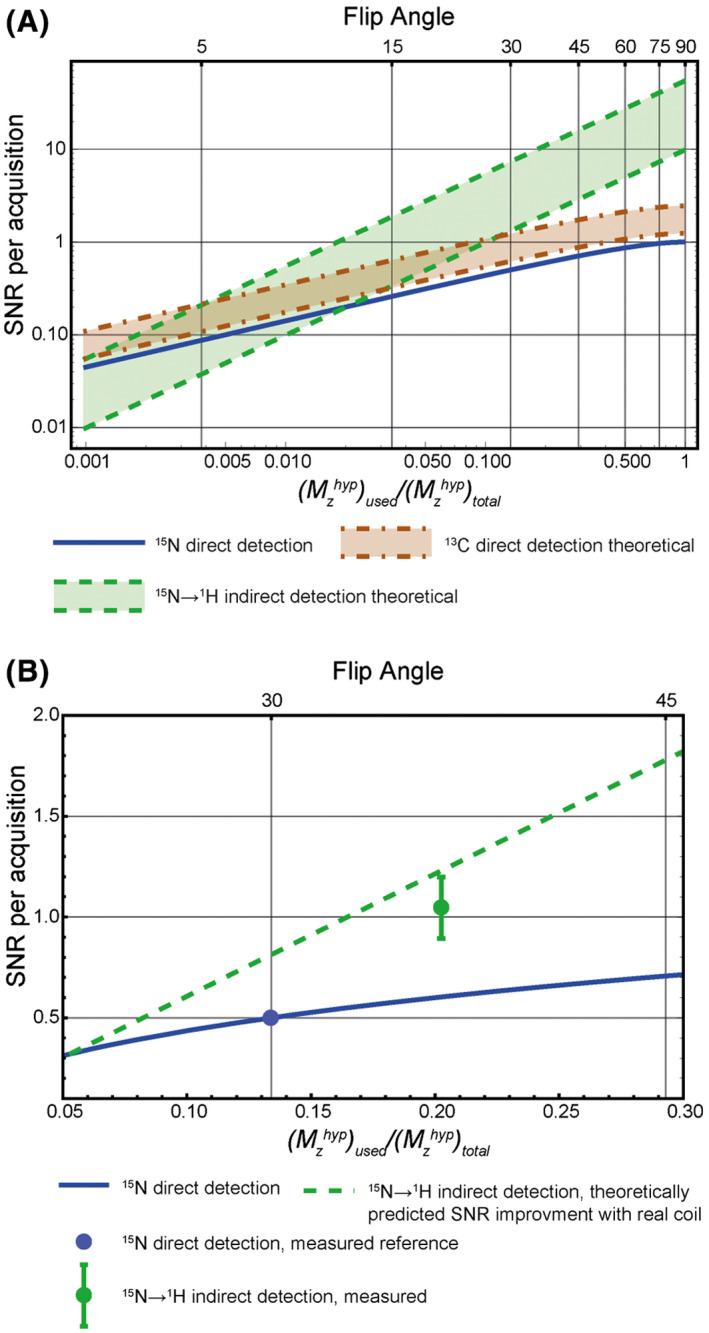
A, Theoretical signal‐to‐noise ratio (SNR) improvements for indirect detection as a function of flip angle and magnetization used, assuming perfect detection coils and equal levels of polarization for 15N and 13C, where the number of 15N spins is double the number of 13C spins, as is the case when comparing [15N2]urea with [1‐13C]urea. The upper and lower bounds for the SNR improvement were calculated for the situation when either coil noise (upper bound) or sample noise (lower bound) solely determined (Equation 10). B, Calculated and measured SNR improvement for indirect detection as a function of flip angle and magnetization used. The dashed green line is the theoretical SNR improvement with the dual tuned coil used here and the experimentally determined value for of 6.07
Indirect detection of hyperpolarized [15N2]urea is an advantage over direct detection of [15N2]urea if more than 2% of the 15N polarization is used in each transfer, and over direct detection of [13C]urea if more than 11% of the 15N polarization is transferred at each step (Figure 8A), assuming that sample noise dominates and is only 9.86. With better coil performance these percentages are decreased such that if coil noise dominates, ie, the gain from detecting 15N polarization via spin‐coupled protons is fully realized, then indirect 15N detection is always an improvement over direct detection and an improvement over direct detection of [13C]urea if only 0.4% of the 15N polarization is transferred to proton. However, in the comparison with detection of [13C]urea there are other factors to consider. Although the [15N2]urea T1 is over 200 s in 2H2O, which allows the hyperpolarized material to be stored prior to injection, the T1 in water measured here was only 24 s and values as low as 9.8–12.9 s have been measured in blood, 2 whereas we have measured a T1 for [13C]urea at 7 T in vivo of ~16 s 36 and values of 43 s (at 11.7 T) 37 and 78 s (at 3 T) 38 have been measured in solution. Therefore, the polarization of [13C]urea will persist for longer in vivo than that for [15N2]urea, allowing dynamic imaging over longer time frames. The other problem with [15N]urea is that the achievable polarization level has so far been lower than for [13C]urea. Here we achieved polarizations of 6.2% for [13C]urea vs 2.3% for [15N2]urea, which are similar to levels reported previously, 2 , 17 , 18 although values of 37% 13C polarization and 7.8% 15N polarization have also been reported. 39 Note that indirect detection of [13C]urea is not feasible because the coupling constant with the protons, which are in exchange with solvent protons where the exchange rate is fast compared to the coupling constant, is weak and not observed. The sequence described here could also be used to detect hyperpolarized 15N via indirectly bonded protons, for example α‐trideuteromethylglutamine via the C2 proton, where in the absence of directly bonded protons the 15N T1 is much longer, although the J‐coupling will be weaker and therefore the efficiency of polarization transfer reduced. This glutamine derivative has been suggested as an alternative to [13C]urea for imaging tissue perfusion. 3 The 15N in this molecule can be polarized to ~10% and in the rat kidney in vivo has a T1 of 146 s as compared to 18 s for [13C]urea.
Although polarization transfer sequences based on J‐coupling have been used previously with hyperpolarized 13C‐labeled substrates to produce hyperpolarized proton spectra 6 , 7 , 8 , 9 and images 10 , 11 and with hyperpolarized 15N labelled substrates to produce spectra, 12 , 13 , 14 this is the first experimental demonstration of partial transfer, which with urea would be required for dynamic imaging of tissue perfusion. Simulations using measured cross relaxation rates showed polarization transfer via spin coupling can give orders of magnitude higher proton polarization than that obtained via cross relaxation 26 , 29 , 31 , 32 , 33 (Figure 7). Moreover, the degree of transfer can be controlled to balance proton signal enhancement with the duration of the 15N hyperpolarization.
To summarize, we have shown that partial polarization transfer from 15N to 1H using a modified BINEPT sequence can be used for dynamic imaging of hyperpolarized [15N2]urea. If more than 10% of the 15N polarization is used in each acquisition then the sequence can give better sensitivity than direct 13C detection of [13C]urea for similar levels of hyperpolarization, and with full transfer of polarization can give an SNR that is 8.0‐22.4‐fold greater, depending on coil performance and whether coil or sample noise dominates. However, although we have used adiabatic pulses, implementation of this sequence in vivo will likely require the much better B1 field of a volume transmit coil, as was required for 1H detection of hyperpolarized [1‐13C]lactate in vivo. 10 , 11
CONFLICT OF INTEREST
KMB holds patents with GE Healthcare on some aspects of DNP technology.
Supporting information
TEXT S1 Calculating the outcome of the ImpeRfection RobUst Partial Transfer (IRRUPT) sequence
ACKNOWLEDGMENTS
This work was funded by a European Union's Horizon 2020 Research and Innovation Program under Marie Sklodowska‐Curie grant agreement no. 642773 (EUROPOL), by Cancer Research UK Programme Grants (17242 and 16465), by the Israel Science Foundation grant no. 1379/18, and by the European Union's Horizon 2020 Research and Innovation Program under FETOPEN grant agreement no. 858149. The authors thank Dr Talia Harris for consultation in the early phase of this study.
Kreis F, Wright AJ, Somai V, Katz‐Brull R, Brindle KM. Increasing the sensitivity of hyperpolarized [15N2]urea detection by serial transfer of polarization to spin‐coupled protons. Magn Reson Med. 2020;84:1844–1856. 10.1002/mrm.28241
REFERENCES
- 1. Hesketh RL, Brindle KM. Magnetic resonance imaging of cancer metabolism with hyperpolarized 13C‐labeled cell metabolites. Curr Opin Chem Biol. 2018;45:187–194. [DOI] [PubMed] [Google Scholar]
- 2. Harris T, Gamliel A, Uppala S, et al. Long‐lived 15N Hyperpolarization and rapid relaxation as a potential basis for repeated first pass perfusion imaging—marked effects of deuteration and temperature. ChemPhysChem. 2018;19:2148–2152. [DOI] [PubMed] [Google Scholar]
- 3. Durst M, Chiavazza E, Haase A, Aime S, Schwaiger M, Schulte RF. a‐trideuteromethyl[15N]glutamine: a long‐lived hyperpolarized perfusion marker. Magn Reson Med. 2016;76:1900–1904. [DOI] [PubMed] [Google Scholar]
- 4. Jiang W, Lumata L, Chen W, et al. Hyperpolarized 15N‐pyridine derivatives as pH‐sensitive MRI agents. Sci Rep. 2015;5:9104. [DOI] [PMC free article] [PubMed] [Google Scholar]
- 5. Morris GA, Freeman R. Enhancement of nuclear magnetic resonance signals by polarization transfer. J Am Chem Soc. 1979;101:760–762. [Google Scholar]
- 6. Chekmenev EY, Norton VA, Weitekamp DP, Bhattacharya P. Hyperpolarized 1H NMR employing low gamma nucleus for spin polarization storage. J Am Chem Soc. 2009;131:3164–3165. [DOI] [PMC free article] [PubMed] [Google Scholar]
- 7. Dzien P, Fages A, Jona G, Brindle KM, Schwaiger M, Frydman L. Following metabolism in living microorganisms by hyperpolarized 1H NMR. J Am Chem Soc. 2016;138:12278–12286. [DOI] [PubMed] [Google Scholar]
- 8. von Morze C, Reed GD, Larson PE, et al. In vivo hyperpolarization transfer in a clinical MRI scanner. Magn Reson Med. 2018;80:480–487. [DOI] [PMC free article] [PubMed] [Google Scholar]
- 9. Mishkovsky M, Cheng T, Comment A, Gruetter R. Localized in vivo hyperpolarization transfer sequences. Magn Reson Med. 2012;68:349–352. [DOI] [PubMed] [Google Scholar]
- 10. Truong ML, Coffey AM, Shchepin RV, Waddell KW, Chekmenev EY. Sub‐second proton imaging of 13C hyperpolarized contrast agents in water. Contrast Media Mol Imaging. 2014;9:333–341. [DOI] [PMC free article] [PubMed] [Google Scholar]
- 11. Wang J, Kreis F, Wright AJ, Hesketh RL, Levitt MH, Brindle KM. Dynamic 1H imaging of hyperpolarized [1‐13C]lactate in vivo using a reverse INEPT experiment. Magn Reson Med. 2018;79:741–747. [DOI] [PMC free article] [PubMed] [Google Scholar]
- 12. Barb AW, Hekmatyar SK, Glushka JN, Prestegard JH. Exchange facilitated indirect detection of hyperpolarized 15ND2‐amido‐glutamine. J Magn Reson. 2011;212:304–310. [DOI] [PMC free article] [PubMed] [Google Scholar]
- 13. Harris T, Giraudeau P, Frydman L. Kinetics from indirectly detected hyperpolarized NMR spectroscopy by using spatially selective coherence transfers. Chem ‐ A Eur J. 2011;17:697–703. [DOI] [PubMed] [Google Scholar]
- 14. Sarkar R, Comment A, Vasos PR, et al. Proton NMR of 15N‐choline metabolites enhanced by dynamic nuclear polarization. J Am Chem Soc. 2009;131:16014–16015. [DOI] [PubMed] [Google Scholar]
- 15. Horska A, Spencer GS. Correctly accounting for radiofrequency spillover in saturation transfer experiments: application to measurement of the creatine kinase reaction rate in human forearm muscle. Magma. 1997;5:159–163. [DOI] [PubMed] [Google Scholar]
- 16. Wetterling F, Hogler M, Molkenthin U, et al. The design of a double‐tuned two‐port surface resonator and its application to in vivo hydrogen‐ and sodium‐MRI. J Magn Reson. 2012;217:10–18. [DOI] [PubMed] [Google Scholar]
- 17. von Morze C, Larson PEZ, Hu S, et al. Imaging of blood flow using hyperpolarized [13C]urea in preclinical cancer models. J Magn Reson Imaging. 2011;33:692–697. [DOI] [PMC free article] [PubMed] [Google Scholar]
- 18. Golman K, Ardenkjær‐Larsen JH, Petersson JS, Månsson S, Leunbach I. Molecular imaging with endogenous substances. Proc Natl Acad Sci. 2003;100:10435–10439. [DOI] [PMC free article] [PubMed] [Google Scholar]
- 19. Merkle H, Wei H, Garwood M, Uǧurbil K. B1‐insensitive heteronuclear adiabatic polarization transfer for signal enhancement. J Magn Reson. 1992;99:480–494. [Google Scholar]
- 20. Burum DP, Ernst RR. Net polarization transfer via a J‐ordered state for signal enhancement of low‐sensitivity nuclei. J Magn Reson. 1980;39:163–168. [Google Scholar]
- 21. Garwood M, Ke Y. Symmetric pulses to induce arbitrary flip angles with compensation for rf inhomogeneity and resonance offsets. J Magn Reson. 1991;94:511–525. [Google Scholar]
- 22. Norton VA, Weitekamp DP. Communication: partial polarization transfer for single‐scan spectroscopy and imaging. J Chem Phys. 2011;135:141107. [DOI] [PubMed] [Google Scholar]
- 23. Bengs C, Levitt MH. SpinDynamica: symbolic and numerical magnetic resonance in a Mathematica environment. Magn Reson Chem. 2018;56:374–414. [DOI] [PMC free article] [PubMed] [Google Scholar]
- 24. Levitt MH. The signs of frequencies and phases in NMR. J Magn Reson. 1997;126:164–182. [DOI] [PubMed] [Google Scholar]
- 25. Keeler J. Understanding NMR spectroscopy (2nd ed .). Chichester, UK: John Wiley & Sons Ltd.; 2010. [Google Scholar]
- 26. Marco‐Rius I, Bohndiek SE, Kettunen MI, et al. Quantitation of a spin polarization‐induced nuclear overhauser effect (SPINOE) between a hyperpolarized 13C‐labeled cell metabolite and water protons. Contrast Media Mol Imaging. 2014;9:182–186. [DOI] [PMC free article] [PubMed] [Google Scholar]
- 27. Vold RL, Daniel ES, Chan SO. Magnetic resonance measurements of proton exchange in aqueous urea. J Am Chem Soc. 1970;92:6771–6776. [Google Scholar]
- 28. Zeng H, Xu J, Yadav NN, et al. 15N Heteronuclear chemical exchange saturation transfer MRI. J Am Chem Soc. 2016;138:11136–11139. [DOI] [PubMed] [Google Scholar]
- 29. Chen C‐H, Wang Y, Hilty C. Intermolecular interactions determined by NOE build‐up in macromolecules from hyperpolarized small molecules. Methods. 2018;138–139:69–75. [DOI] [PubMed] [Google Scholar]
- 30. Donovan KJ, Lupulescu A, Frydman L. Heteronuclear cross‐relaxation effects in the NMR spectroscopy of hyperpolarized targets. ChemPhysChem. 2014;15:436–443. [DOI] [PMC free article] [PubMed] [Google Scholar]
- 31. Frydman L, Blazina D. Ultrafast two‐dimensional nuclear magnetic resonance spectroscopy of hyperpolarized solutions. Nat Phys. 2007;3:415–419. [Google Scholar]
- 32. Merritt ME, Harrison C, Mander W, Malloy CR, Sherry AD. Dipolar cross‐relaxation modulates signal amplitudes in the 1H NMR spectrum of hyperpolarized [13C]formate. J Magn Reson. 2007;189:280–285. [DOI] [PMC free article] [PubMed] [Google Scholar]
- 33. Zeng H, Bowen S, Hilty C. Sequentially acquired two‐dimensional NMR spectra from hyperpolarized sample. J Magn Reson. 2009;199:159–165. [DOI] [PubMed] [Google Scholar]
- 34. Hoult DI, Lauterbur PC. The sensitivity of the zeugmatographic experiment involving human samples. J Magn Reson. 1979;34:425–433. [Google Scholar]
- 35. Haase A, Frahm J, Matthaei D. Hanicke W, Merboldt KD. FLASH imaging. Rapid NMR imaging using low flip‐angle pulses. J Magn Reson. 1986;67:258–266. [DOI] [PubMed] [Google Scholar]
- 36. Patrick PS, Kettunen MI, Tee SS, et al. Detection of transgene expression using hyperpolarized 13C urea and diffusion‐weighted magnetic resonance spectroscopy. Magn Reson Med. 2015;73:1401–1406. [DOI] [PubMed] [Google Scholar]
- 37. Wilson DM, Keshari KR, Larson PE, et al. Multi‐compound polarization by DNP allows simultaneous assessment of multiple enzymatic activities in vivo. J Magn Reson. 2010;205:141–147. [DOI] [PMC free article] [PubMed] [Google Scholar]
- 38. Chiavazza E, Kubala E, Gringeri CV, et al. Earth's magnetic field enabled scalar coupling relaxation of 13C nuclei bound to fast‐relaxing quadrupolar 14N in amide groups. J Magn Reson. 2013;227:35–38. [DOI] [PubMed] [Google Scholar]
- 39. Ardenkjær‐Larsen JH, Fridlund B, Gram A, et al. Increase in signal‐to‐noise ratio of %3e 10,000 times in liquid‐state NMR. Proc Natl Acad Sci. 2003;100:10158. [DOI] [PMC free article] [PubMed] [Google Scholar]
Associated Data
This section collects any data citations, data availability statements, or supplementary materials included in this article.
Supplementary Materials
TEXT S1 Calculating the outcome of the ImpeRfection RobUst Partial Transfer (IRRUPT) sequence