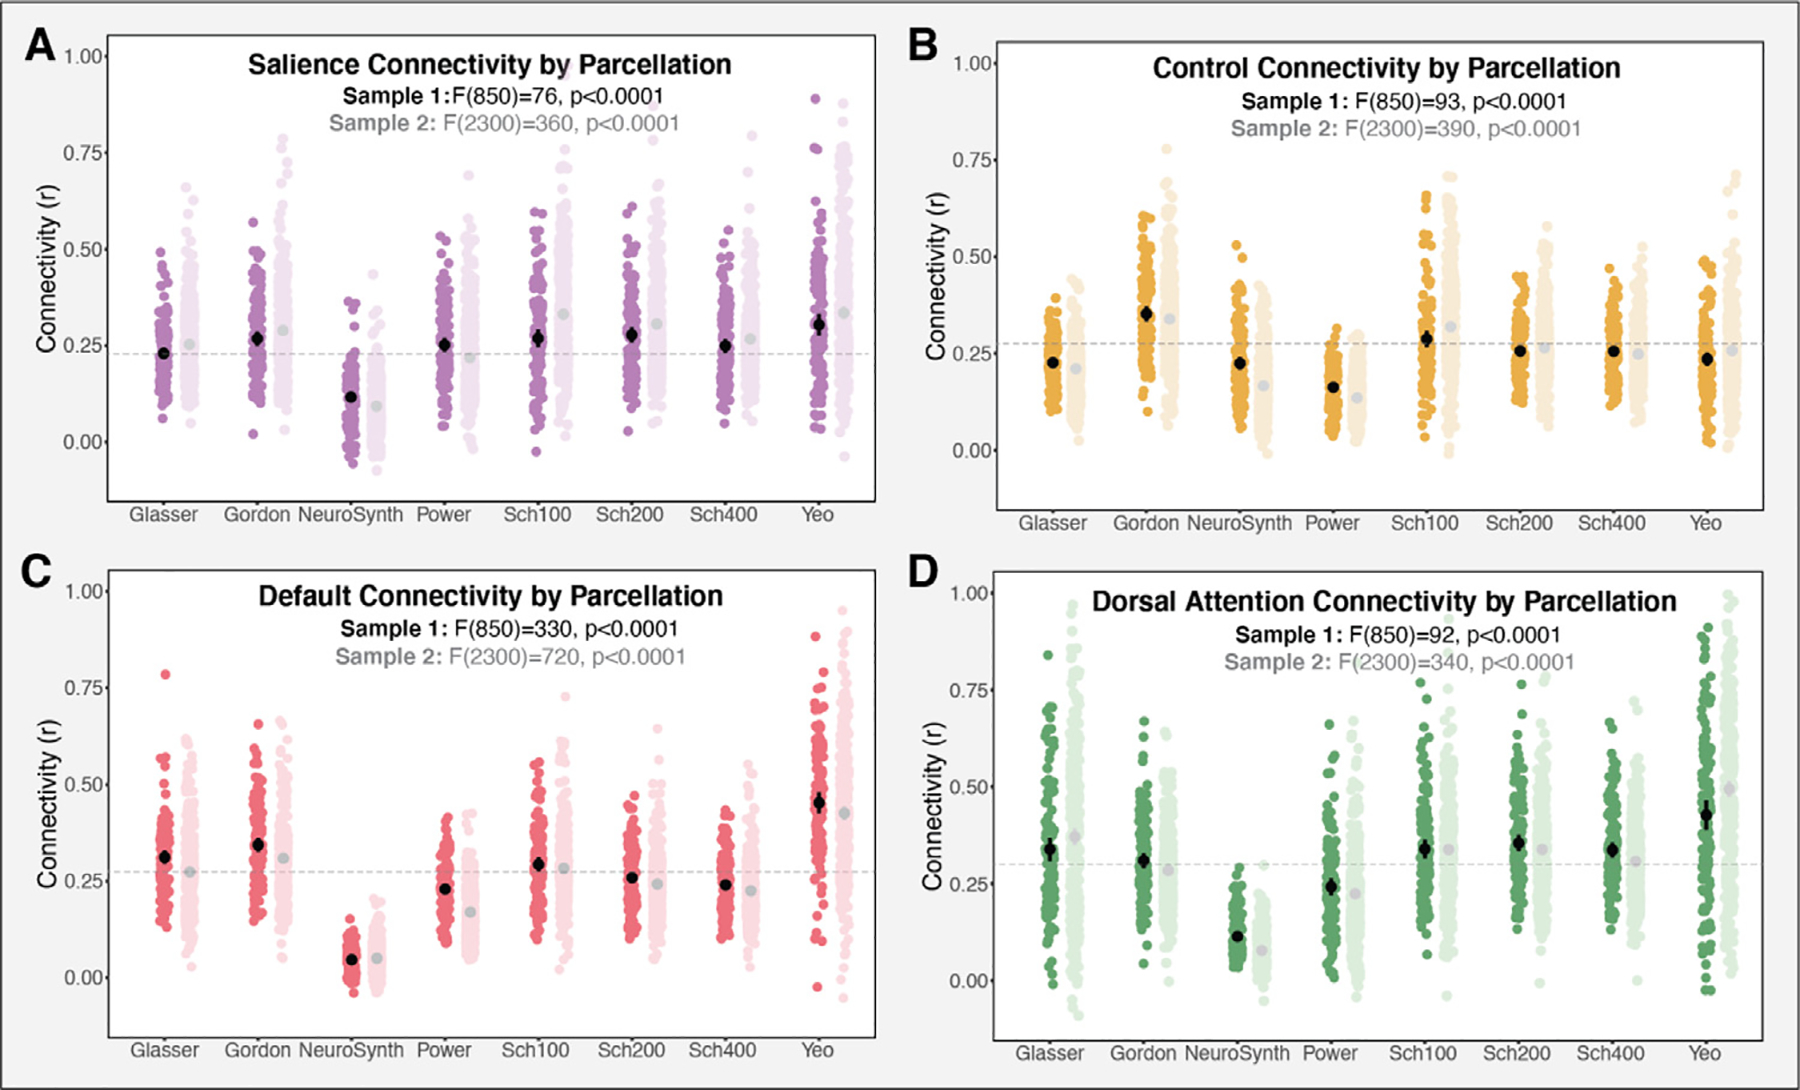
Fig. 6.

Measures of average functional connectivity by parcellation for each of the four networks of interest. Connectivity varied significantly across the parcellations in all the networks assessed, including (A) salience (B) control (C) default and (D) dorsal attention in both Sample 1 (dark color) and Sample 2 (light color). gray dashed line represents the grand mean connectivity (Sample 1) for each of the networks.
