

Abstract
Trends in Gallbladder cancer incidence and mortality in populations across the Americas can provide insight into shifting epidemiologic patterns and the current and potential impact of preventative and curative programs. Estimates of gallbladder and extrahepatic bile duct cancer incidence and mortality for the year 2018 were extracted from IARC’s GLOBOCAN database for 185 countries. Recorded registry-based incidence from 13 countries was extracted from IARC’s Cancer Incidence in Five Continents series and corresponding national deaths from the WHO mortality database. Among females, the highest estimated incidence ASR for gallbladder and extrahepatic bile duct cancer in the Americas were found in Bolivia (21.0 per 100,000), Chile (11.7), and Peru (6.0). In the U.S., the highest incidence rates were observed among Hispanics (1.8). In the Chilean population, gallbladder cancer rates declined in both females and males between 1998 and 2012. Rates dropped slightly in Canada, Costa Rica, U.S. Whites, and Hispanics in Los Angeles. Gallbladder cancer mortality rates also decreased across the studied countries, although rising trends were observed in Colombia and Canada after 2010. Countries within Southern and Central America tended to have a higher proportion of unspecified biliary tract cancers. In public health terms, the decline in gallbladder cancer incidence and mortality rates is encouraging. However, the slight increases in mortality rates during recent years in Colombia and Canada warrant further attention. Higher proportions of unspecified biliary tract cancers (with correspondingly higher mortality rates) suggest more rigorous pathology procedures may be needed after surgery.
Keywords: carcinomas of gallbladder, extrahepatic and biliary duct cancers, ampulla of Vater, incidence, mortality
Introduction
Gallbladder cancer is a relatively rare cancer in most parts of the world and ranks as the 20th most frequent type of cancer worldwide(1). Incidence varies dramatically geographically (2–4), being an important malignant neoplasm in parts of South America and Central and Eastern Asia, as well as among Hispanics and certain indigenous populations in the Americas. In addition to cancer of the gallbladder, biliary tract cancers also include tumours of the extrahepatic bile duct and Ampulla of Vater(5). Collectively, there were an estimated 220,000 new diagnoses and 165,000 deaths from biliary tract cancers worldwide in 2018 (6). Biliary tract cancer, including gallbladder, is usually asymptomatic at the initial stage and often fatal, with a 5-year survival of approximately 18% in the U.S. (US) (7) and 10% in Chile (8).
The underlying causes of the disease remain only partially understood, with gallstone disease a well-established risk factor for gallbladder cancer, alongside cholelithiasis, which also increases the risk of other biliary tract cancers (9,10). Nevertheless, the role of gallstones in the gallbladder cancer pathway is not clear, particularly as a proportion of diagnosed patients do not have a history of gallstones(11), and only a small proportion of individuals with gallstones develop gallbladder cancer (12). Additional hypothesized risk factors for gallbladder cancer include parity, obesity, smoking, and drinking alcohol, as well as Helicobacter pylori (H. pylori) and other Helicobacter species, gallbladder polyps, and primary sclerosis cholangitis(13–18).; however, the extent to which these factors contribute to the development of each of the biliary tract cancer subtypes is still unclear. Common genetic susceptibility alleles have also recently been found to confer a higher risk of gallbladder cancer (19). In terms of trends in rates, it has been proposed that the declining gallbladder cancer incidence and mortality rates in several high income countries over the last two decades is related to the increasing practice of laparoscopic cholecystectomy that removes high-risk patients (with gallstones) from the underlying populations(20).
Given the complex etiology of biliary tract cancers, a description of trends in the Americas can inform public health officials about the shifting epidemiologic patterns in the region and the impact of changing lifestyle and prevention policies on recent trends and the current burden of gallbladder and extrahepatic bile duct cancers. We provide here the most up-to-date description of the epidemiological patterns of these cancers, focused using incidence data from the International Agency for Research on Cancer (IARC) and mortality data provided by the World Health Organization (WHO).
Methods
Data sources and population
Estimated counts of biliary tract cases and deaths including gallbladder and extrahepatic bile (International Classification of Diseases 10th revision, ICD-10 C23–24) for the year 2018 from 185 countries worldwide were extracted from IARC’s GLOBOCAN database, which provides national estimates using a hierarchical set of methods built upon registry data; further information regarding the quality of data and hierarchical set of GLOBOCAN methods is described elsewhere by Ferlay and colleagues(6). Population at risk data were derived from the same source.
In addition, the recorded number of new diagnoses of gallbladder and other biliary tract cancers and the population at the risk for the years 2008 to 2012 were extracted from Cancer Incidence in Five Continents Volume XI, a compendium of high-quality population-based cancer registries (PBCR) at the national or subnational level. Herein, we included a total of 39 high-quality population-based cancer registries in 13 countries in the American continent, including registries from South, Central (including the Caribbean) and North America. For the U.S. we presented data by race/ethnicity for Non-Hispanic Whites, Non-Hispanic Blacks, Hispanic Whites and American Indian/Alaska natives. For the first three groups, data were obtained from The Surveillance, Epidemiology, and End Results (SEER 18 registries), and for the remaining groups from National Program of Cancer Registries - U.S. (NPCR).
We examined time trends for selected registries with long-standing high-quality cancer registry incidence data covering the period 1979–2012. To ensure comparability across time and between populations, the ICD-O-3 morphological groups were converted (ICD-10) groups, and the observed data were presented as gallbladder (ICD-10 C23), extrahepatic duct (C24), ampulla of Vater (C24.1), and other and unspecified (C24.8–9). We also extracted recorded national mortality data from the World Health Organization mortality database for the same 13 countries for which the recorded incidence was obtained. The number of deaths of gallbladder cancer (C23) by sex, age group, year and population were extracted for the period 1996–2016 (21). We presented mortality data for the aggregated period 2008–2012 as well by single year of death.
Statistical analyses
We calculated age-specific rates per 100,000 person-years and age-standardised rates (ASR) using the world standard population(22) at the subnational and national level, where applicable. The ASR for 2018 are presented in global maps, while geographic variations in ASR based on the recorded incidence and mortality are presented as bar charts. Time trends in the ASR are presented as semi-log line charts with the trends smoothed using lowess regression. To quantify recent trends, the estimated average annual percentage (EAPC) over the last ten years was estimated using Poisson log-linear models. All analyses were undertaken using R software (23).
Results
Worldwide estimated incidence and mortality rates, 2018
To compare national rates of biliary tract cancer in the Americas with those in other regions, maps of incidence and mortality ASR by sex are shown in Figure 1. Overall, the cancers exhibit a wide variation in ASR between world regions. The highest burden of biliary tract cancers is found in South and Central Asia as well as South America, representing 2.9% and 1.8% of all new cancer diagnoses (data not shown). According to Figure 1, the top five estimated incidence ASR for females were in Bolivia (21.0), Chile (11.7), Bangladesh (7.3), Nepal and Peru (6.0). Restricting to the Americas, elevated incidence rates were also observed in El Salvador (4.4), Colombia (3.5) and Ecuador (3.4). In males, Bolivia (12.8), Chile (8.4) and Peru (3.4), and Martinique (3.3) had the highest rates. Mortality rates demonstrated a similar pattern, with the highest mortality rates observed in the same countries.
Figure 1.
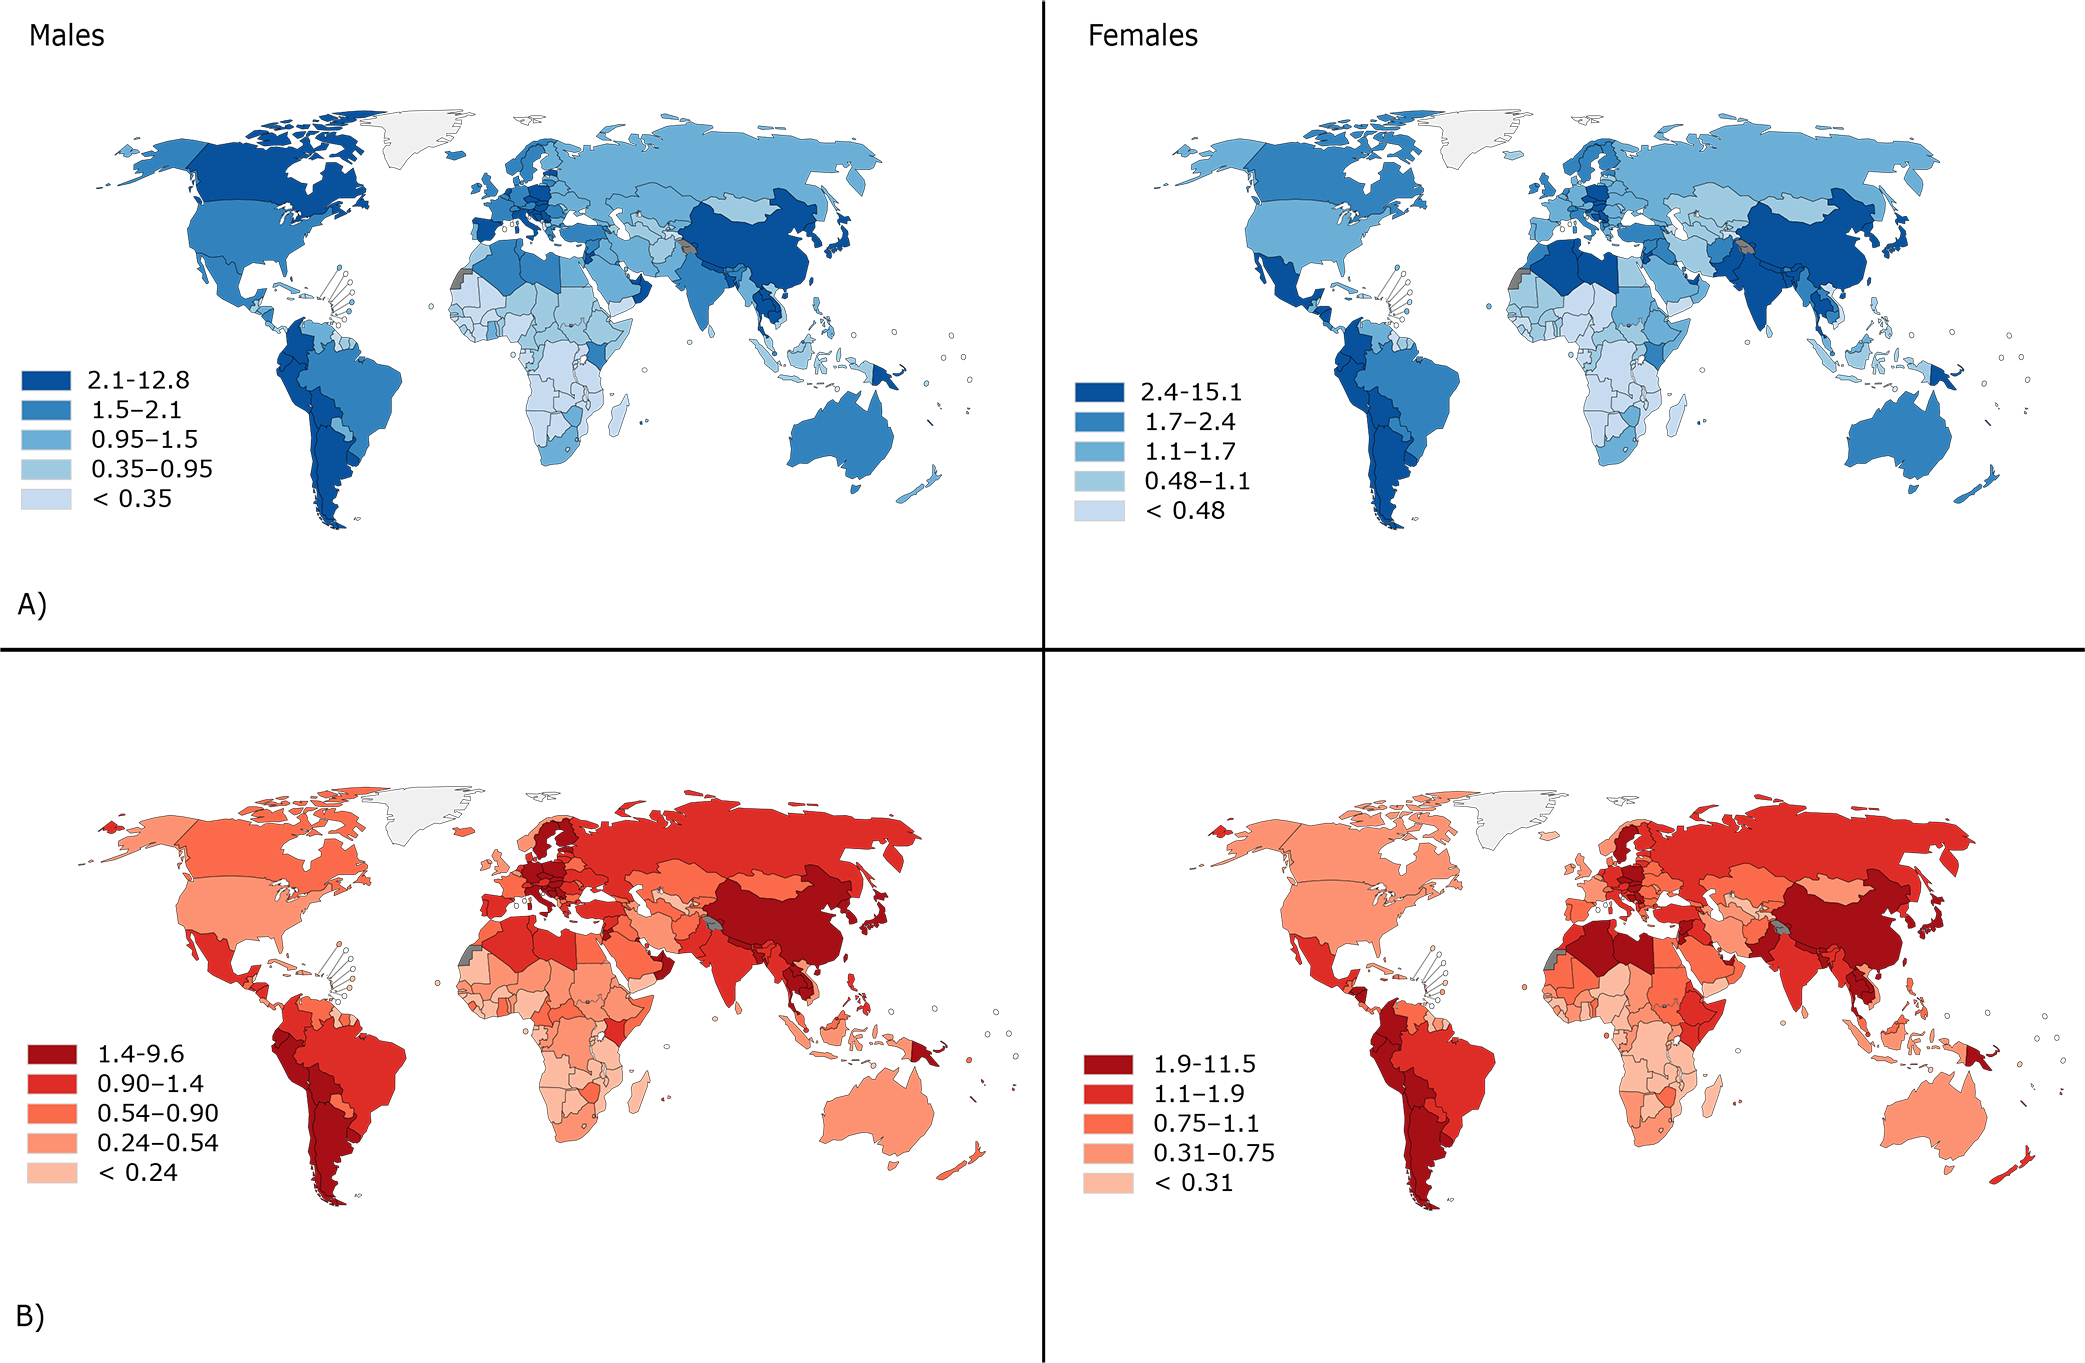
Global map of estimated age-standardized A) incidence and B) mortality rates per 100,000 of biliary tract cancers (C23–24) by sex, all ages, 2018.
Recorded incidence and mortality rates in the Americas, 2008–2012
While gallbladder cancer was more prominent in females compared to males (Figure 2), with female to male (F:M) rate ratios commonly >1, extrahepatic bile duct and ampulla of Vater cancers were more frequent in males than females in most registry populations in the region, particularly in North America (Table 1, Figure 2). The Entre Rios province of Argentina was an exception (F:M ratio = 0.89) (Table 1). South American registries reported the highest incidence of gallbladder cancer (C23), with the highest rates ten-fold greater than those in the U.S. Registries from Chile and Ecuador reported the top five highest incidence rates in females, including registries in Bio Bio province (18.8), Valdivia (16.3) and Concepcion (11.5) in Chile, followed by Quito (3.38) and Loja (3.52) in Ecuador. In North America, the highest gallbladder cancer incidence rate was seen in the U.S. among Hispanic whites in females (1.78 vs. 0.64 in non-Hispanic whites, Table 1, Figure 2). Overall, the incidence rates for extrahepatic bile duct cancer were lower than those of gallbladder cancer, with the highest incidence observed in the Bio Bio province, Chile (1.42), and in Loja, Ecuador (1.49), although the rates were based on few cases. In the U.S., extrahepatic bile duct cancer rates were similar across ethnicities except among Hispanic whites, where rates were elevated (0.73 in females and 0.87 in males) (Table 1, Figure 2). The incidence of cancers of the ampulla of Vater follows that of extrahepatic bile ducts with similar rates and patterns in Central and South America, and much lower rates compared to extrahepatic bile ducts in North America. The highest mortality rates were observed in Chile in females and males (8.44 and 3.62, respectively), followed by Uruguay (1.82 and 0.80, respectively).
Figure 2.
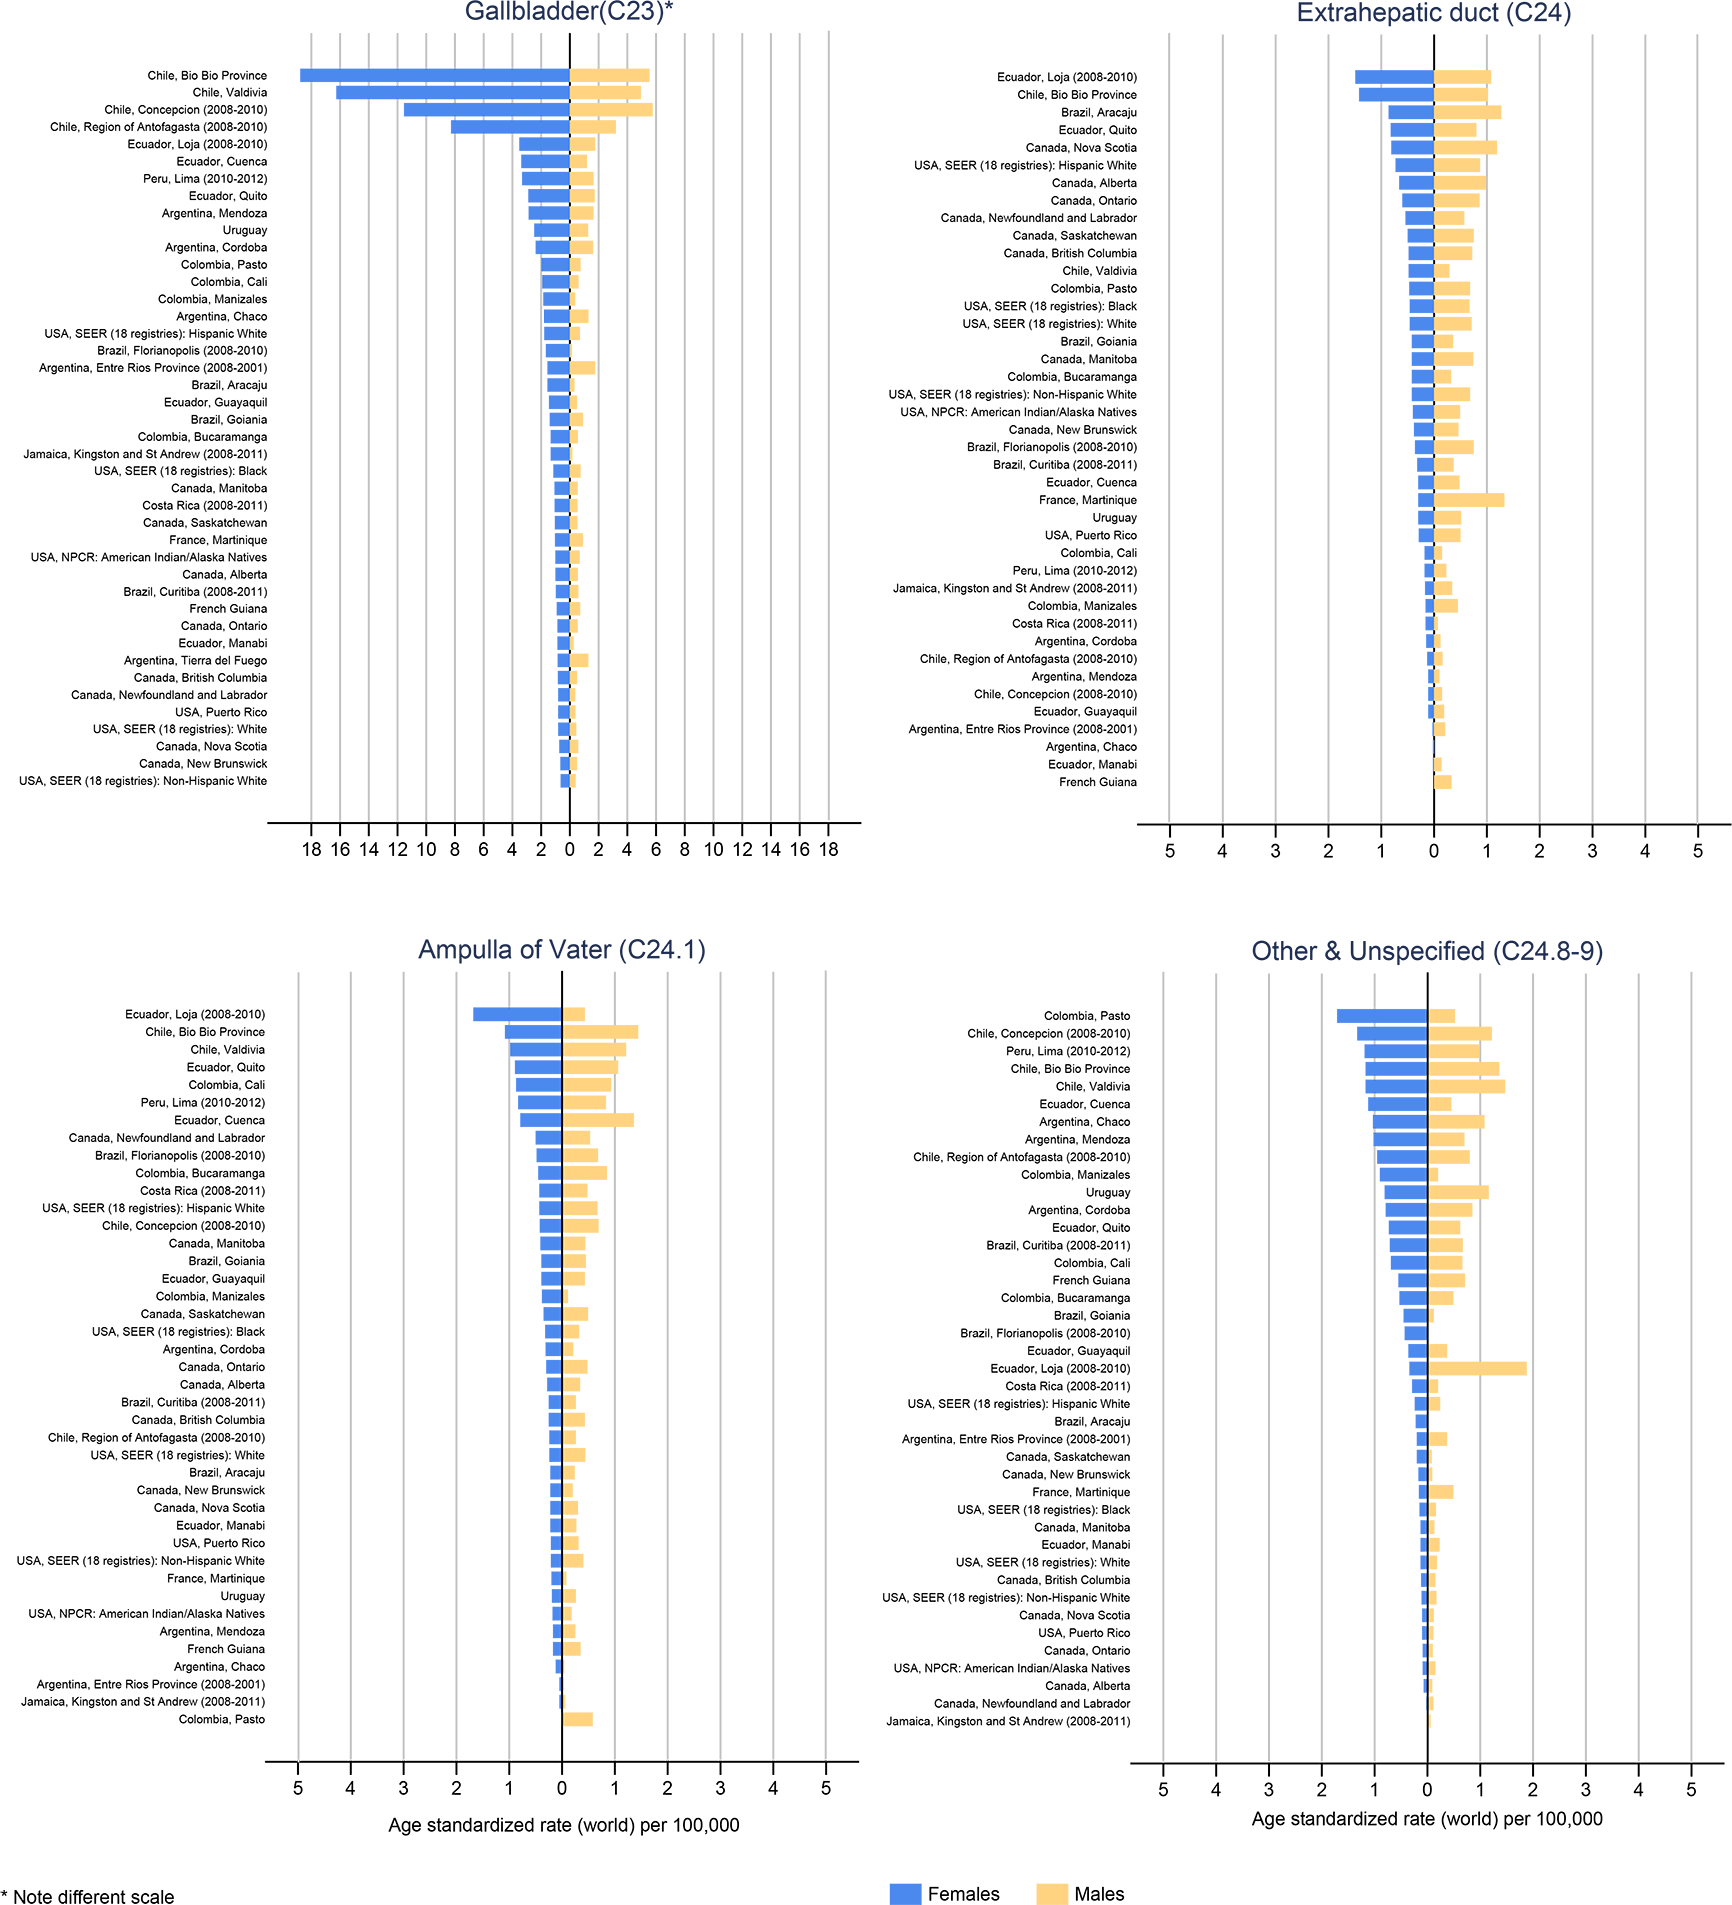
Age-standardized incidence rates of gallbladder, extrahepatic duct, ampulla of Vater, and other and unspecified morphology biliary tract cancers in the Americas, in females (blue bars) and males (blue bars), circa 2008–2012.
Table 1.
Recorded number of new biliary tract cancer diagnoses and deaths in the Americas, age-standardized incidence and mortality rates (ASR) by population, in females and males, circa 2008–2012.
| Gallbladder(C23) | Extrahepatic duct (C24) | Ampulla of Vater (C24.1) | Other and Unspecified (C24.8–9) | Mortality (C23)e | ||||||||||||||||||
|---|---|---|---|---|---|---|---|---|---|---|---|---|---|---|---|---|---|---|---|---|---|---|
| Female |
Male |
|
Female |
Male |
Female |
Male |
Female |
Male |
Female |
Male |
||||||||||||
| Cases | ASR | Cases | ASR | F:Mb | Cases | ASR | Cases | ASR | Cases | ASR | Cases | ASR | Cases | ASR | Cases | ASR | Deaths | ASR | Deaths | ASR | ||
|
| ||||||||||||||||||||||
| South America | Argentina | 1644 | 1.1 | 798 | 0.68 | |||||||||||||||||
| Entre Rios Province (2008–2011) | 50 | 1.56 | 42 | 1.76 | 0.89 | a | 0.03 | 5 | 0.21 | a | 0.05 | a | 0.03 | 8 | 0.20 | 9 | 0.37 | |||||
| Cordoba | 117 | 2.38 | 58 | 1.61 | 1.48 | 6 | 0.15 | a | 0.12 | 15 | 0.31 | 8 | 0.21 | 49 | 0.79 | 33 | 0.85 | |||||
| Mendoza | 165 | 2.87 | 83 | 1.64 | 1.75 | 8 | 0.11 | 5 | 0.10 | 9 | 0.17 | 11 | 0.25 | 66 | 1.02 | 35 | 0.70 | |||||
| Chaco | 47 | 1.80 | 30 | 1.29 | 1.40 | a | 0.02 | - | - | a | 0.12 | a | 0.04 | 30 | 1.03 | 25 | 1.08 | |||||
| Brazil | 3821 | 0.69 | 1208 | 0.28 | ||||||||||||||||||
| Goiania | 50 | 1.40 | 25 | 0.91 | 1.54 | 13 | 0.42 | 9 | 0.36 | 14 | 0.39 | 12 | 0.45 | 16 | 0.45 | a | 0.12 | |||||
| Florianopolis (2008–2010) | 13 | 1.67 | a | 0.14 | 11.93 | a | 0.36 | a | 0.75 | a | 0.48 | a | 0.68 | a | 0.43 | - | - | |||||
| Aracaju | 25 | 1.56 | a | 0.32 | 4.88 | 14 | 0.86 | 13 | 1.27 | a | 0.22 | a | 0.24 | a | 0.22 | - | - | |||||
| Curitiba (2008–2011) | 43 | 0.97 | 18 | 0.59 | 1.64 | 13 | 0.32 | 11 | 0.37 | 12 | 0.25 | 8 | 0.26 | 37 | 0.71 | 21 | 0.67 | |||||
| Chile | 5070 | 8.44 | 1765 | 3.62 | ||||||||||||||||||
| Valdivia | 222 | 16.26 | 59 | 4.94 | 3.29 | 5 | 0.48 | a | 0.29 | 15 | 0.98 | 14 | 1.21 | 16 | 1.17 | 19 | 1.47 | |||||
| Bio Bio Province | 248 | 18.77 | 68 | 5.54 | 3.39 | 18 | 1.42 | 12 | 1.02 | 15 | 1.08 | 17 | 1.44 | 17 | 1.17 | 18 | 1.36 | |||||
| Region of Antofagasta (2008–2010) | 73 | 8.27 | 24 | 3.20 | 2.58 | a | 0.13 | a | 0.16 | a | 0.24 | a | 0.26 | 10 | 0.95 | 6 | 0.80 | |||||
| Concepcion (2008–2010) | 238 | 11.54 | 91 | 5.76 | 2.0 | a | 0.11 | a | 0.15 | 9 | 0.42 | 11 | 0.69 | 29 | 1.33 | 19 | 1.22 | |||||
| Colombia | 1346 | 1.16 | 316 | 0.34 | ||||||||||||||||||
| Cali | 137 | 1.92 | 30 | 0.60 | 3.20 | 12 | 0.18 | 8 | 0.15 | 60 | 0.87 | 48 | 0.93 | 51 | 0.69 | 33 | 0.66 | |||||
| Bucaramanga | 42 | 1.33 | 13 | 0.55 | 2.42 | 14 | 0.42 | 8 | 0.32 | 14 | 0.45 | 20 | 0.85 | 18 | 0.53 | 11 | 0.49 | |||||
| Manizales | 25 | 1.85 | a | 0.36 | 5.14 | a | 0.16 | a | 0.45 | 5 | 0.38 | a | 0.11 | 13 | 0.90 | a | 0.20 | |||||
| Pasto | 23 | 1.98 | 6 | 0.74 | 2.68 | 7 | 0.47 | 6 | 0.68 | - | - | 5 | 0.58 | 19 | 1.71 | 5 | 0.52 | |||||
| Peru | 1183 | 1.69 | 467 | 0.76 | ||||||||||||||||||
| Lima (2010–2012) | 494 | 3.32 | 199 | 1.64 | 2.02 | 29 | 0.18 | 28 | 0.23 | 121 | 0.83 | 103 | 0.83 | 192 | 1.19 | 122 | 0.99 | |||||
| Uruguay | 239 | 1.82 | 78 | 0.80 | ||||||||||||||||||
| Uruguay national | 399 | 2.48 | 151 | 1.27 | 1.95 | 51 | 0.30 | 64 | 0.51 | 33 | 0.19 | 32 | 0.26 | 160 | 0.81 | 151 | 1.16 | |||||
| Ecuador | 487 | 1.36 | 193 | 0.59 | ||||||||||||||||||
| Quito | 120 | 2.89 | 57 | 1.72 | 1.68 | 37 | 0.82 | 27 | 0.80 | 37 | 0.89 | 37 | 1.06 | 37 | 0.73 | 22 | 0.62 | |||||
| Cuenca | 48 | 3.38 | 12 | 1.19 | 2.84 | a | 0.30 | a | 0.48 | 11 | 0.79 | 16 | 1.36 | 15 | 1.12 | 6 | 0.45 | |||||
| Guayaquil | 80 | 1.45 | 22 | 0.49 | 2.96 | 6 | 0.11 | 10 | 0.19 | 22 | 0.39 | 21 | 0.43 | 21 | 0.36 | 20 | 0.37 | |||||
| Loja (2008–2010) | 12 | 3.52 | 5 | 1.76 | 2.0 | a | 1.49 | a | 1.08 | 5 | 1.68 | a | 0.43 | a | 0.34 | 6 | 1.88 | |||||
| Manabi | 28 | 0.86 | 8 | 0.26 | 3.31 | a | 0.02 | a | 0.14 | 7 | 0.22 | 8 | 0.27 | 5 | 0.13 | 7 | 0.23 | |||||
|
| ||||||||||||||||||||||
| Central America | Costa Rica | 86 | 0.66 | 21 | 0.17 | |||||||||||||||||
| Costa Rica national (2008–2011) | 100 | 1.06 | 45 | 0.53 | 2.0 | 16 | 0.16 | 6 | 0.07 | 37 | 0.43 | 40 | 0.48 | 27 | 0.29 | 17 | 0.20 | |||||
| France | ||||||||||||||||||||||
| Martinique | 23 | 1.03 | 16 | 0.90 | 1.14 | 7 | 0.30 | 20 | 1.33 | 5 | 0.20 | a | 0.08 | a | 0.16 | 8 | 0.49 | |||||
| Jamaica | 67 | 1.09 | 14 | 0.20 | ||||||||||||||||||
| Jamaica, Kingston and St Andrew (2008–2011) | 19 | 1.33 | a | 0.17 | 7.82 | a | 0.17 | a | 0.34 | a | 0.05 | a | 0.06 | - | - | a | 0.06 | |||||
| Puerto Rico | 30 | 0.16 | 19 | 0.13 | ||||||||||||||||||
| Puerto Rico national | 151 | 0.81 | 57 | 0.38 | 2.13 | 64 | 0.29 | 81 | 0.50 | 42 | 0.21 | 49 | 0.31 | 22 | 0.10 | 17 | 0.11 | |||||
|
| ||||||||||||||||||||||
| North America | Canada | 870 | 0.43 | 411 | 0.25 | |||||||||||||||||
| Alberta | 152 | 1.00 | 80 | 0.55 | 1.82 | 107 | 0.66 | 132 | 0.98 | 39 | 0.28 | 47 | 0.34 | 11 | 0.07 | 13 | 0.09 | |||||
| British Columbia | 207 | 0.83 | 112 | 0.50 | 1.66 | 114 | 0.48 | 161 | 0.72 | 59 | 0.25 | 95 | 0.43 | 37 | 0.12 | 33 | 0.15 | |||||
| Manitoba | 69 | 1.07 | 28 | 0.54 | 1.98 | 30 | 0.42 | 43 | 0.74 | 23 | 0.41 | 21 | 0.44 | 6 | 0.13 | 6 | 0.13 | |||||
| New Brunswick | 36 | 0.66 | 17 | 0.49 | 1.35 | 16 | 0.38 | 19 | 0.46 | 8 | 0.22 | 7 | 0.20 | 9 | 0.17 | a | 0.09 | |||||
| Nova Scotia | 45 | 0.74 | 28 | 0.58 | 1.28 | 43 | 0.81 | 54 | 1.19 | 11 | 0.22 | 12 | 0.30 | 8 | 0.10 | 6 | 0.12 | |||||
| Newfoundland and Labrador | 28 | 0.81 | 10 | 0.37 | 2.19 | 16 | 0.54 | 14 | 0.57 | 14 | 0.50 | 13 | 0.53 | a | 0.02 | a | 0.11 | |||||
| Ontario | 590 | 0.86 | 314 | 0.54 | 1.59 | 410 | 0.60 | 486 | 0.86 | 196 | 0.30 | 270 | 0.48 | 70 | 0.09 | 63 | 0.10 | |||||
| Saskatchewan | 60 | 1.04 | 23 | 0.52 | 2.0 | 29 | 0.50 | 37 | 0.75 | 17 | 0.35 | 23 | 0.49 | 8 | 0.20 | a | 0.08 | |||||
| United States of America c | 6952 | 0.43 | 3375 | 0.26 | ||||||||||||||||||
| White | 2657 | 0.81 | 1187 | 0.44 | 1.84 | 1585 | 0.46 | 1912 | 0.71 | 818 | 0.24 | 1159 | 0.44 | 428 | 0.13 | 500 | 0.18 | |||||
| Black | 434 | 1.15 | 203 | 0.74 | 1.55 | 186 | 0.46 | 189 | 0.67 | 121 | 0.32 | 92 | 0.32 | 60 | 0.15 | 46 | 0.16 | |||||
| Hispanic White | 758 | 1.78 | 239 | 0.70 | 2.54 | 305 | 0.73 | 299 | 0.87 | 175 | 0.43 | 235 | 0.67 | 103 | 0.24 | 86 | 0.24 | |||||
| Non-Hispanic White | 1899 | 0.64 | 948 | 0.40 | 1.60 | 1280 | 0.42 | 1613 | 0.68 | 643 | 0.21 | 924 | 0.40 | 325 | 0.11 | 414 | 0.17 | |||||
| American Indian/Alaska Natives d | 104 | 1.01 | 57 | 0.68 | 1.49 | 40 | 0.40 | 40 | 0.49 | 19 | 0.18 | 17 | 0.18 | 9 | 0.09 | 13 | 0.15 | |||||
less than five new diagnosis
Female to male ASR rate ratio
SEER 18 registries
NPCR registries
Mortality rate at national level
Proportion of new diagnoses by subtype in the Americas, 2008–2012
Overall, Southern and Central American registries tend to have a higher proportion of unspecified biliary tract cancers in females (12.3% – 20.6% vs .6.8% in North America). Limiting analyses to populations with <15% unspecified biliary tract cancers (26 registries); gallbladder was the most frequent cancer among females, ranging from 42.1% of biliary tract cancers in Nova Scotia, Canada, to 86.0% in Valdivia, Chile (Figure 3). The sub-regions of Chile exhibited the highest proportion of gallbladder, and the smallest proportion of extrahepatic bile duct cancers. Compared to other populations on the American continent, females in Canadian registry populations had a notably higher proportion of extrahepatic bile duct cancer, ranging from 27.3% in British Columbia to 40.2% in Nova Scotia. Relatively high proportions of ampulla of Vater cancers were noted in Canada (23.7% in Newfoundland and Labrador), as well as in Colombia, (23.1%), Ecuador, (22.7%) and Costa Rica (20.6%).
Figure 3.
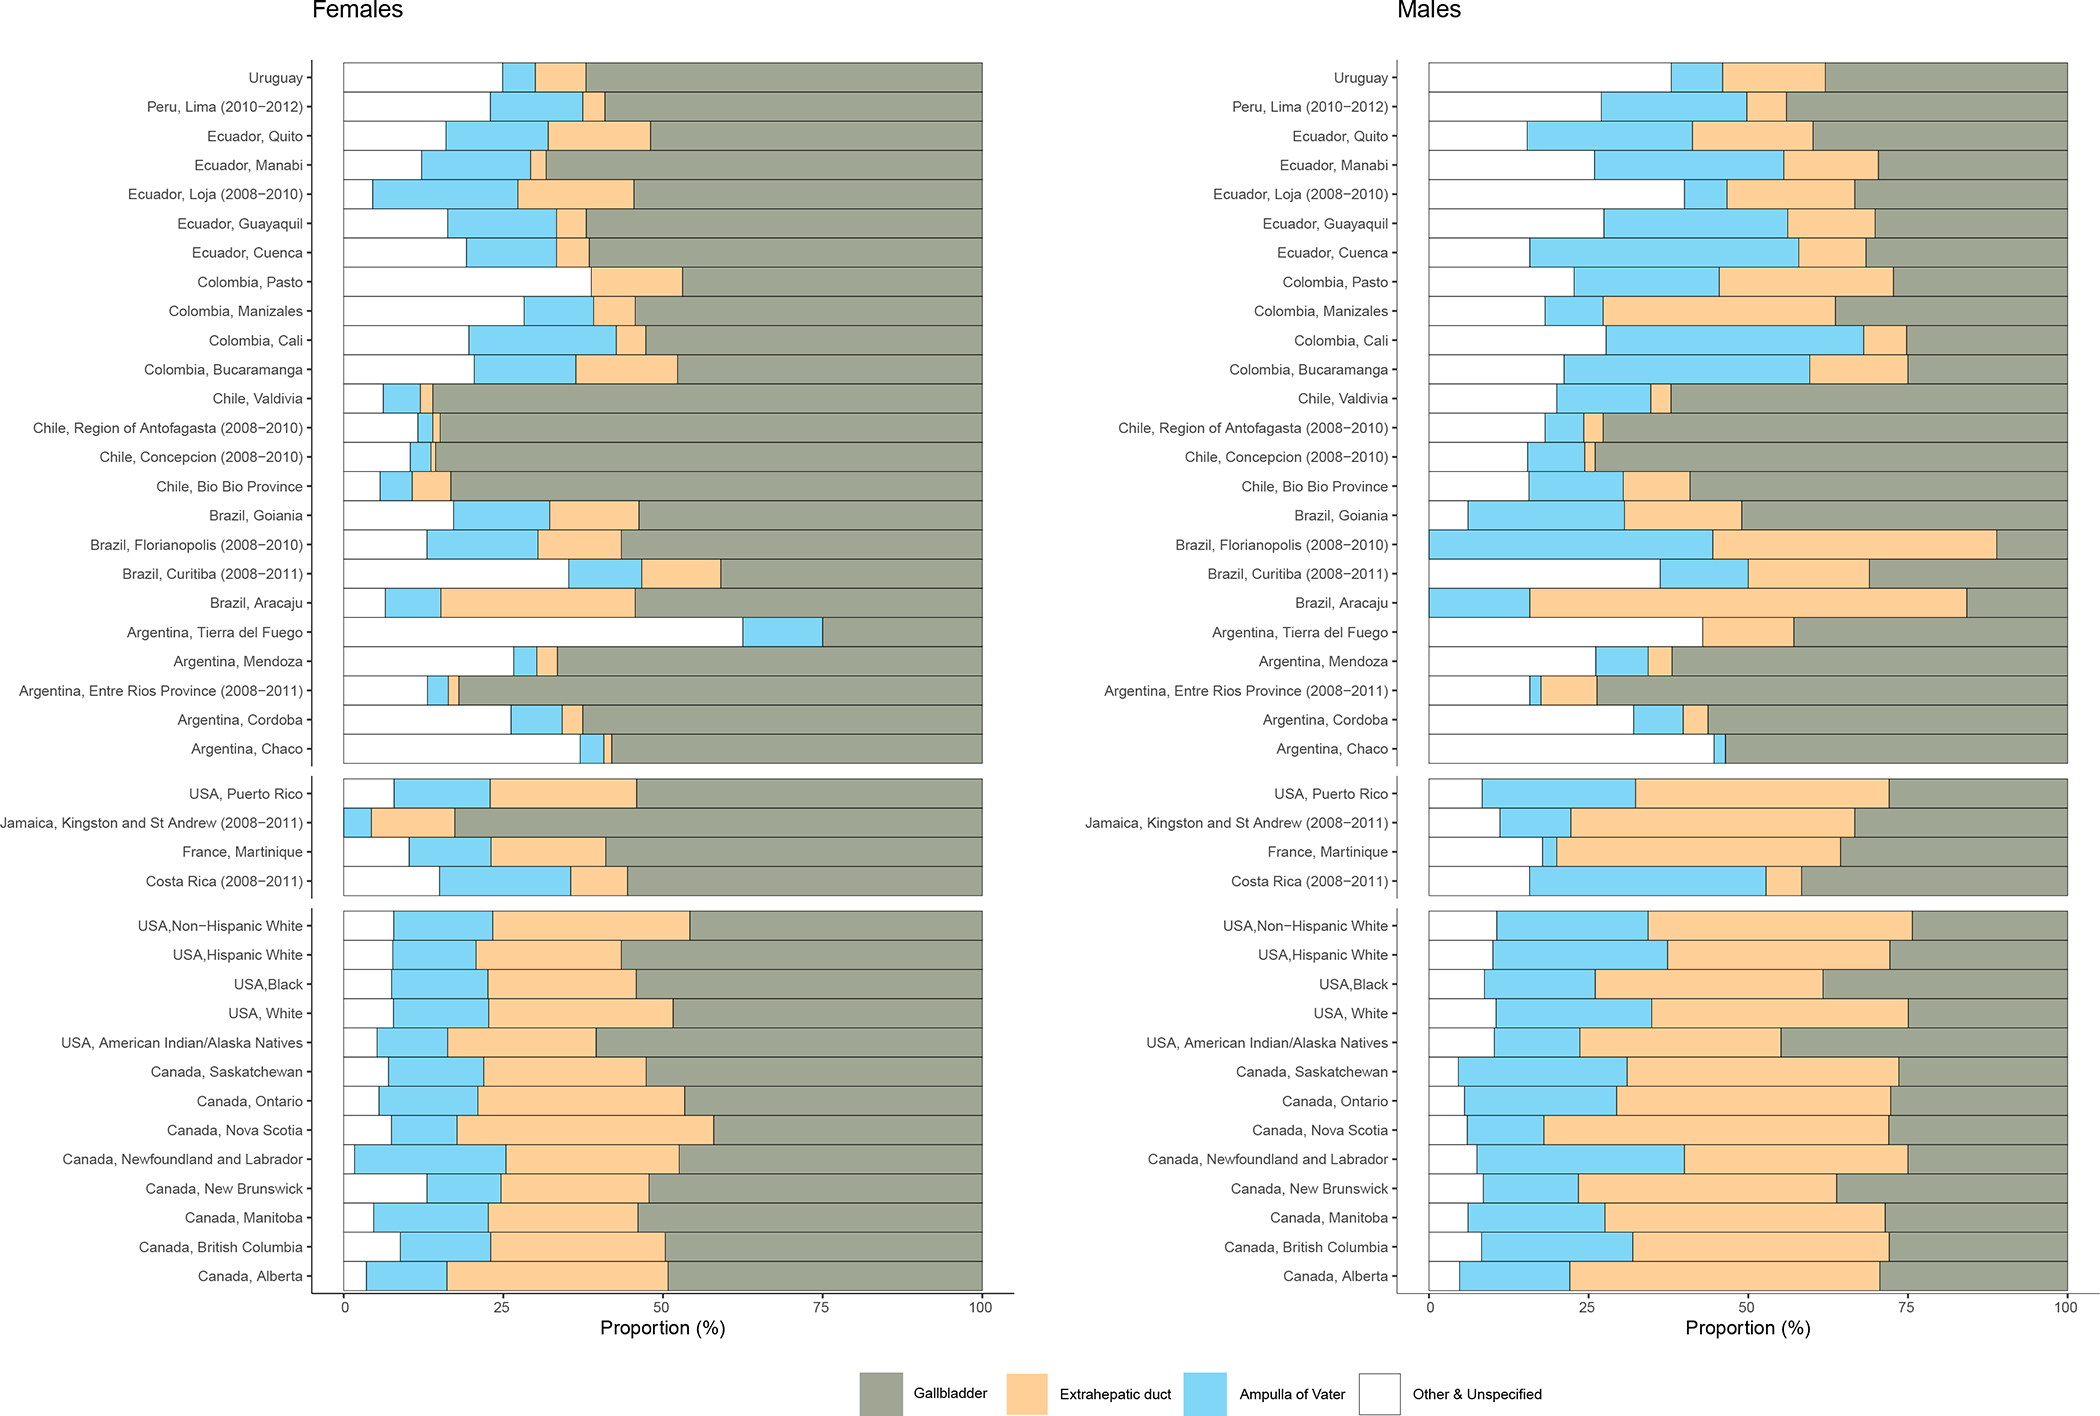
Proportion of gallbladder, extrahepatic duct, ampulla of Vater, and other and unspecified biliary tract cancers, in females and males by populations in the Americas, circa 2008–2012.
Time trends in gallbladder cancer incidence and mortality in the Americas, 1979–2016
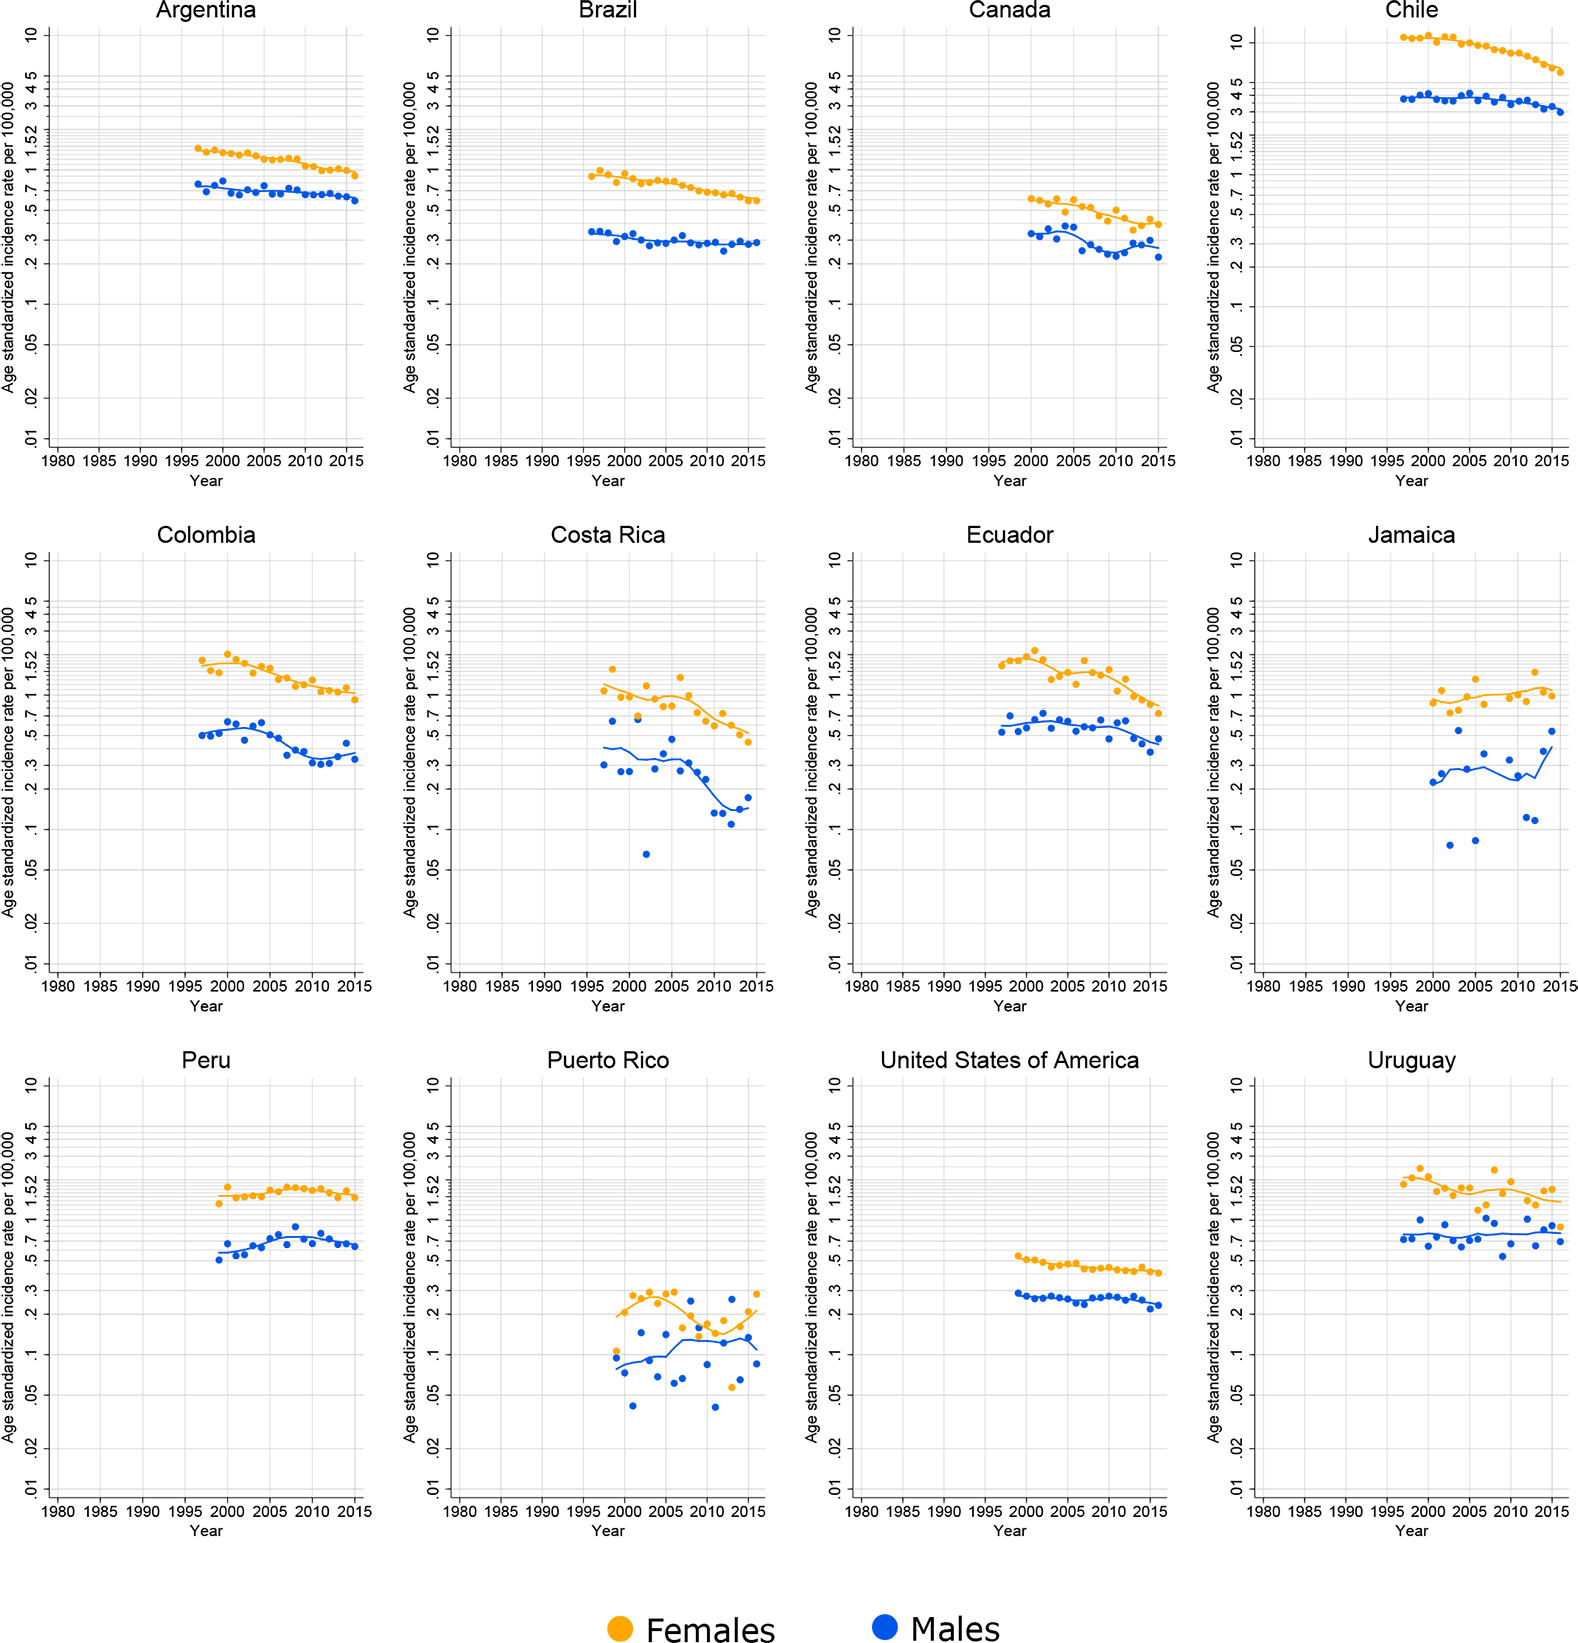
Gallbladder cancer incidence rates for all ages have steadily declined in males and females in the majority of registry populations in the Americas (Figure 4). In females in Brazil (Goiania), Colombia (Cali) and Ecuador (Quito), incidence rates were stable until around the year 2005, but rapidly declined thereafter. In Chile (Valdivia), rates decreased prior to 2005, both in females (EAPC: −4.7, 95%CI: −2.6 - −6.8) and in males (−6.1, 95%CI: −2.2;−9.8). Registries in Canada, Costa Rica, and the U.S. exhibited slight decreases starting in the early-1990s.
Figure 4.
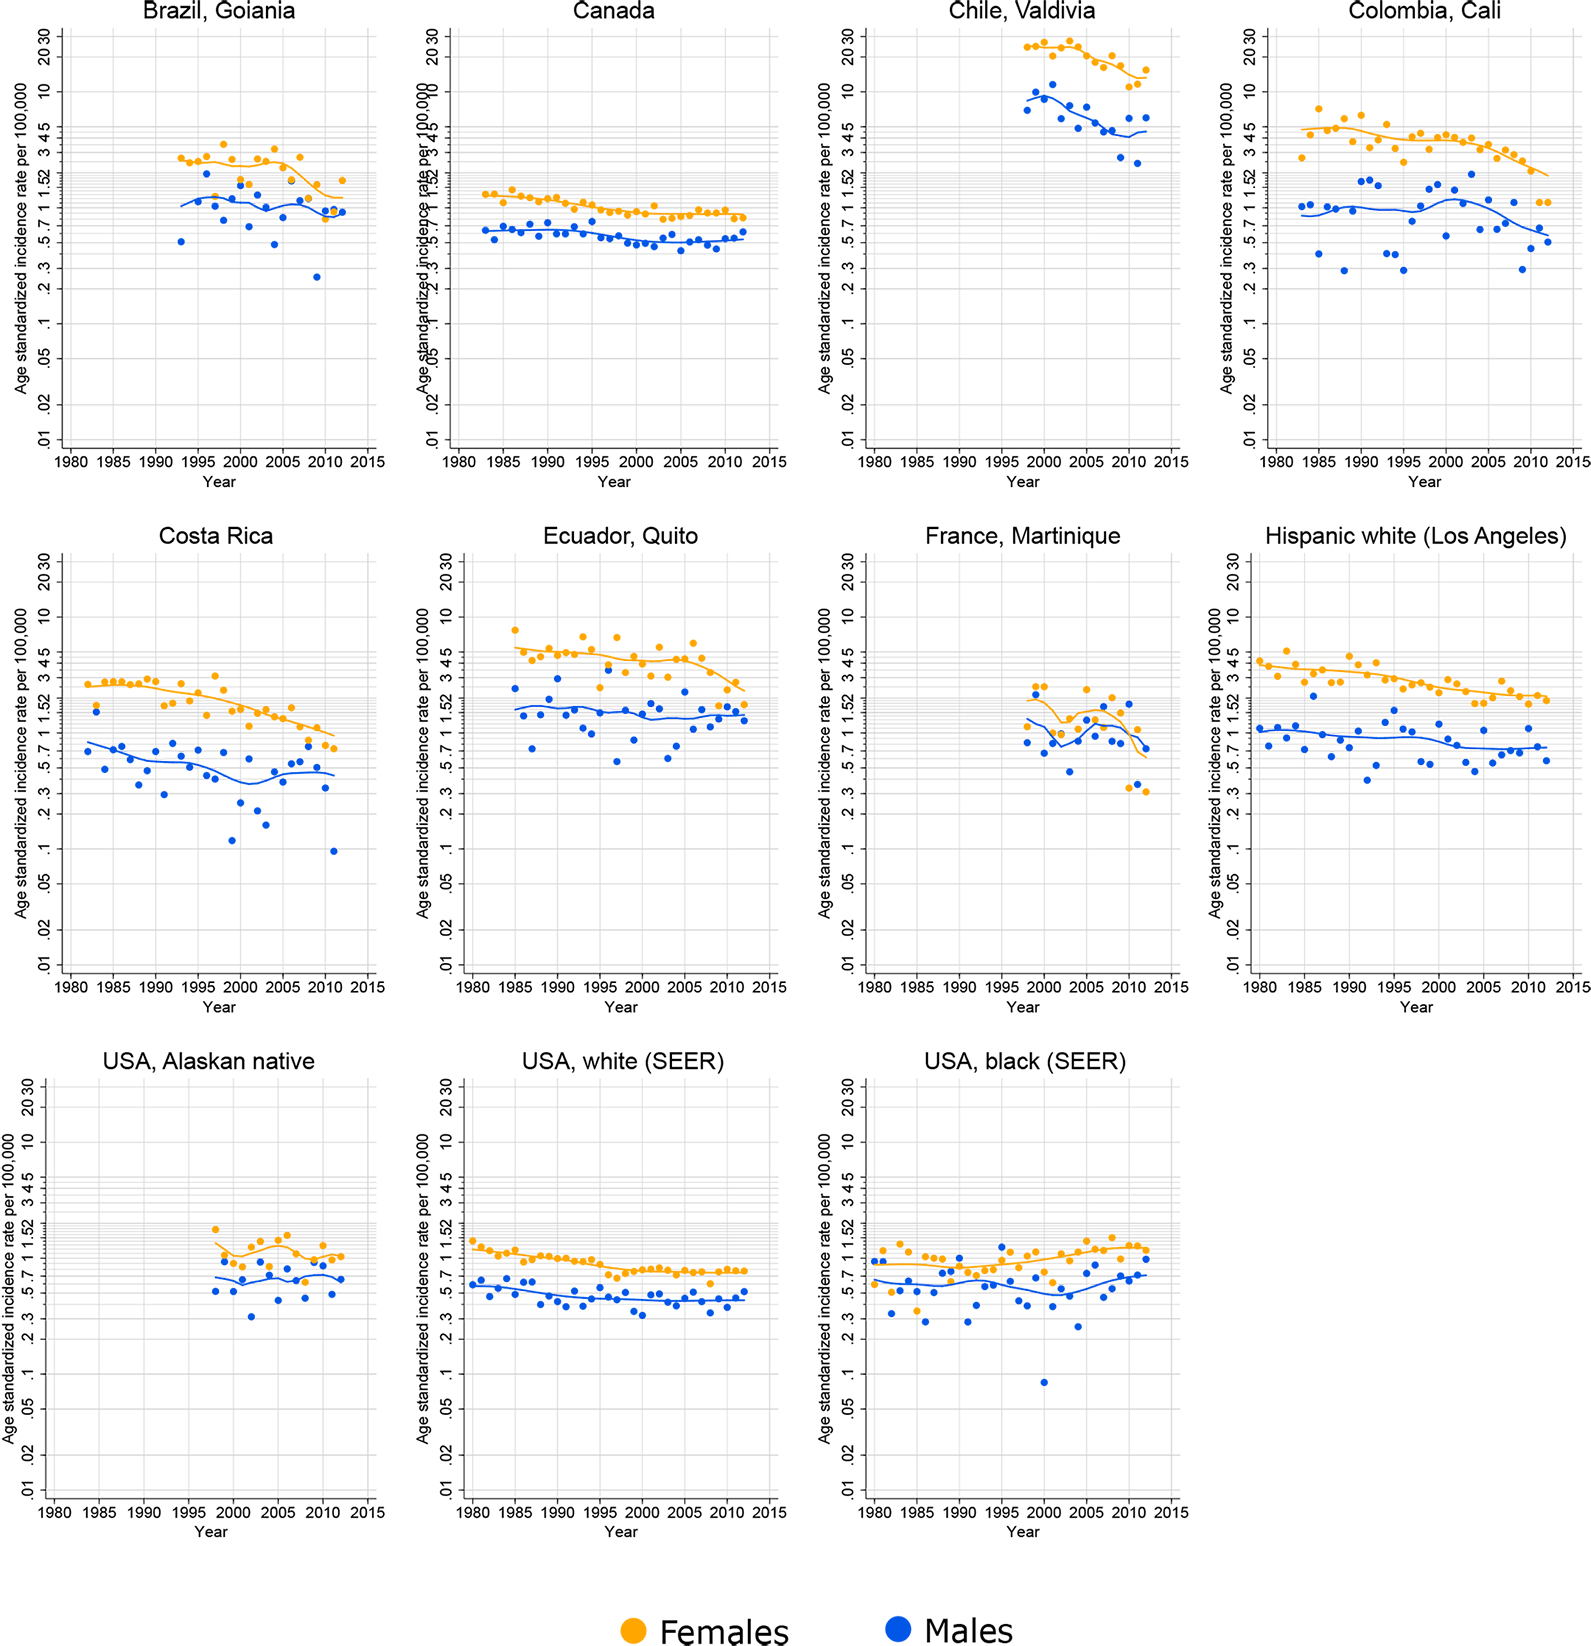
Time trends in age-standardized incidence rates of gallbladder cancer (C23) in selected populations in the Americas, females and males, all ages, 1980–2012. Source: Cancer Incidence in Five Continents.
A decline in national gallbladder cancer mortality rates was observed in all countries in both sexes, with the declines more striking in females (Figure 5). In both Colombia and Canada, a decreasing mortality trend in both sexes was seen until around 2010, followed by a rise in rates thereafter, at least in males.
Figure 5.
Time trends in age-standardized mortality rates of gallbladder cancer (C23) in selected countries in the Americas, females and males, all ages, 1980–2012.
Discussion
We report here up-to-date international patterns and trends in the incidence and mortality burden and rates of gallbladder and extrahepatic bile duct cancers, with a specific focus on the prominent national and subnational variations in the Americas. From a global perspective, incidence rates are markedly higher in South and Central Asia and in South America (particularly in Bolivia). In the Americas overall, gallbladder cancer was more commonly diagnosed in females, while extrahepatic bile duct and ampulla of Vater cancers were slightly more frequent in males. The observed incidence rates of gallbladder cancer were consistently higher among Chilean and Peruvian populations in the region, particularly in females. Gallbladder cancer incidence has been in decline over the last 15 years in both sexes, with gallbladder cancer mortality trends broadly in the same direction in most countries.
The potential role of heredity is supported by the historically higher risk of gallbladder cancer among Latino, Native American and Indian populations (24,25). In our study, the incidence rates in Hispanic whites were more than two times higher than in the Non-Hispanic white population in the U.S., in line with those reported by Siegel at al. (26). Higher incidence rates have also been reported among native American Indians in New Mexico between 1988 and 1992 (27). Bermejo and colleagues (28) showed that Native American Mapuche ancestry was associated with increased risk of death due to gallbladder cancer. In addition, Mhatre at al. (29) reported higher incidence in populations in the northwest region of India compared to the southern regions of the country. These authors also conducted a case-control study showing that the risk of gallbladder cancer for those born in the highest-risk Indian regions remained elevated even when the participants migrated to lower-risk regions, supporting a role of heredity in gallbladder carcinogenesis (29).
We have shown that the observed incidence rates of biliary tract cancers and each of the sub-groups of gallbladder, extrahepatic biliary duct and ampulla of Vater cancer follow a similar geographical pattern. The highest incidence rates were found in the Chilean and Peruvian populations, while the lowest were seen across North America. Gallstones cause chronic inflammation through trauma and infections in the epithelial tissue of gallbladder (27), and variations in gallstone disease prevalence may partially explain the differences in incidence rates between these regions. It has also been showed that larger gallstones and longer duration of the disease increase the risk of gallbladder cancer (30). In the U.S., Nogueira and colleagues (31) showed that gallstones and cholecystectomy increased the risk of biliary tract cancer, probably through both bile exposure/reflux and inflammation. The overall prevalence of gallstone disease in the U.S. population has been estimated to be around 17% (32), whilst the overall prevalence found in the Peruvian coastal native population was 14.3% (33). Not surprisingly, the prevalence of gallstones in the Chilean population has been estimated to be about 27%, and even higher in the Mapuche population (35%) (34,35). In contrast, a Brazilian study based on autopsies found only 6.9% of deaths had evidence of gallstone disease (36).The high incidence rates of gallbladder cancer in Chile have been related to the high prevalence of cholelithiasis, poverty and less access to early diagnosis in low socioeconomic population (37). The spread and application of laparoscopic cholecystectomy in the U.S. may have contributed to a reduction in cases of gallbladder cancer, whereas, in Chile, it has been suggested that insufficient access to cholecystectomies might have led to higher risk of gallbladder cancer (35).
Gallbladder and extrahepatic bile duct cancers are complex diseases. Their aetiology is likely multifactorial yet remains poorly understood. Gallstones are by far the most important risk factor (38,39). However, the link between gallstones and extrahepatic bile duct and Ampulla of Vater cancer is not clear. Female sex, parity, oestrogen replacement therapy and oral contraceptive use have been associated with increased risk of gallstones (40,41), which may partly explain the higher incidence rates of gallbladder cancer among females. Obesity has been associated with increased risk of gallbladder cancer, and to a lesser extent of extrahepatic bile duct cancer (42). Obesity could potentially act indirectly by increasing the risk of gallstones or through inflammatory mediation (42). Chronic infections caused by Salmonella Typhi and high levels of aflatoxin seem to be important risk factors in the Chilean population (43–45). Additionally, Latin American countries such as Chile and Bolivia, where typhoid fever has historically been endemic, also have the highest rates of gallbladder cancer around the world (46). Another possible contributor to explain the variation in gallbladder cancer rates, particularly in high income settings, is the use of statins, which has been suggested to decrease the risk of cholesterol gallstones(47). Primary prevention of gallbladder cancer is still a challenge, in part because causality is not well established for many potential risk factors. Gallstones are clear indicators of increased risk, however. Factors that reduce the risk of gallstones could also reduce the risk of gallbladder cancer. Obesity is a good target in this regard as it is strongly associated with both gallstones and gallbladder cancer(48,49).The trends in the incidence and mortality rates suggest that there is hope for the future control of gallbladder cancer. Most of the populations studied observed declining incidence rates, particularly among females. While incidence rates have slightly decreased since the 1980s in a few populations, incidence rates started to more rapidly decrease around 2005 in the majority reported in this study. While the underlying factors for this widespread trend are not well understood, one possible link is concomitant increase in health care coverage for diagnostic imaging, including ultrasonography, as well as increases in laparoscopic cholecystectomy for gallstones (40). Similarly, declining mortality rates in several countries may be partially attributed to such changes in medical practice and an increase of low-risk laparoscopic cholecystectomy (20). Increasing levels of laparoscopic cholecystectomy could artefactually increase incidence rates because of an increased diagnosis of underlying prevalent cases, which might explain the slight increases in mortality rates at the beginning of the 2000s found in Canada (males), Ecuador (females) and in Colombia and Peru in both sexes. The declines in the incidence rates observed in the Valdivia population of Chile may be partly explained by a cancer control program initiated in 2006 that provides abdominal echotomographic for symptomatic and asymptomatic cholelithiasis in the population aged 35–49 years (35). However, the declines in the incidence and mortality of gallbladder cancer began prior to 2005, suggesting a role for other risk factors.
In most countries, mortality rates from biliary tract cancers have dropped over the last decade. This decline is probably linked to a fall in incidence rates, rather than improvements in earlier diagnosis or treatment. Survival from gallbladder and extrahepatic biliary carcinomas is poor even in high-income settings as these cancers are often asymptomatic at initial stages. Biopsy is extremely uncommon in the diagnosis of gallbladder cancer, other than for metastatic cases for which cholecystectomy can no longer be performed (50). Earlier diagnosis can increase the chance of cure and decrease the risk of death; however, less than half of gallbladder cancers are identified before surgery, making early diagnosis challenging (51,52). The slight increase in the mortality rates after 2010 in a few countries including Canada and Colombia in males warrants further attention. Increases in gallbladder cancer mortality rates in some countries have also been reported by Torre and colleagues (20). While the causes are unclear, variations in mortality might partly be due to artefact, namely poor quality and low coverage of the national vital registration system in some countries in South America. For example, in Bolivia 45% of all deaths were attributed to signs and symptoms not classified elsewhere, and in Peru underreporting is a major concern, estimated at 47.2%, for instance (53,54).
The higher proportion of other and unspecified tumours (C24–8-9) in some populations is worthy of note. Other than differences in aetiology, diagnostic and registry coding and classification practice may partially explain some of the geographic and temporal variability reported in this study. Most “unspecified” cases are extensive or metastatic tumours, locally spread tumours in which the precise origin cannot be determined confidently, or those with inadequate clinical work up or improper documentation in the paperwork. The College of American Pathologists (CAP) (55) requires pathologists to specify the location of the tumour and select a specific staging / “synoptic” protocol. The protocol for each organ is different, which is why documentation of the primary site (location of the tumour) is required. We might speculate that these practices are followed more rigorously in the U.S. and Canada, which is why the proportion of unspecified is lower in these countries. The distinction between intrahepatic (C22.1 – which is categorised together with liver cancer C22) and extrahepatic can also be difficult to make, especially when the cancer is in the hilum of the liver. These challenges may also affect the extent to which the category “not otherwise specified” is used.
The interpretation of the rates and trends for biliary tract cancers requires considerable caution, given that biliary tract cancers include a broad and complex set of tumours. Although gallbladder and extrahepatic biliary duct cancer are well described with specific classification and codes by the WHO Classification of Tumours of the Digestive System 4th edition (56), international comparisons may be biased by differential clinical and coding practices in the registries’ populations. Some extrahepatic biliary ducts tumours can be misclassified as intrahepatic biliary tumours, but they should be classified as extrahepatic bile duct cancers(57). It is also important to note that incidence data are derived from subnational cancer registries in some countries, and they may not completely represent the national scale and profile. Nevertheless, the registries compiled in CI5 went through rigorous quality checks and review, and the recorded data presented here can be considered sufficiently comparable, complete and accurate to explore and interpret rate variations, as has been done in this study.
In summary, we have described the burden of gallbladder, extrahepatic bile duct carcinoma and ampulla of Vater across the American continent. Gallbladder carcinoma is still an important health problem in several South American populations, particularly in Chile, Ecuador and Peru. Changes in clinical practice following surgery (i.e., pathology protocols) might explain the lower proportions of unspecified tumours in North America. The declines in gallbladder cancer incidence and mortality rates warrant some optimism; however, the slight increases in mortality rates during recent years in Colombia and Canada require attention. In any case, further studies are needed to unravel other major causes and identify effective prevention strategies for this enigmatic disease with a poor average prognosis.
Novelty and impact:
Gallbladder carcinoma is still an important health problem in several South American populations. Mortality rates from biliary tract cancers have dropped over the last decade, probably linked to a fall in incidence rates, rather than improvements in earlier diagnosis or treatment. Changes in clinical practice following surgery might explain the lower proportions of unspecified tumours in North America. The slight increases in mortality rates during recent years in Colombia and Canada warrant further attention.
Acknowledgements
We would like to thank the Directors and staff of the population-based cancer registries worldwide who compiled and submitted their data for IARC’s Cancer Incidence in Five Continents and GLOBOCAN projects used in this paper.
List of abbreviations
- ASR
Age-standardised incidence rates
- CI5
Cancer Incidence in Five Continents
- EAPC
Estimated Average Annual Percentage
- PBCR
Population-Based Cancer Registries
- NPCR
National Program of Cancer Registries
- ICD-O
The International Classification of Diseases for Oncology
- ICD
International Statistical Classification of Diseases and Related Health Problems
Footnotes
Conflict of interest
None
Disclaimer
Where authors are identified as personnel of the International Agency for Research on Cancer / World Health Organization, the authors alone are responsible for the views expressed in this article and they do not necessarily represent the decisions, policy or views of the International Agency for Research on Cancer / World Health Organization.
References
- 1.Ferlay J, Ervik M, Lam F, Colombet M, Mery L, Piñeros M, Znaor A, Soerjomataram I, Bray F (2018). Global Cancer Observatory: Cancer Today. Lyon, France: International Agency for Research on Cancer. [Internet]. Available from: https://gco.iarc.fr/today [Google Scholar]
- 2.Van Dyke AL, Shiels MS, Jones GS, Pfeiffer RM, Petrick JL, Beebe-Dimmer JL, et al. Biliary tract cancer incidence and trends in the United States by demographic group, 1999–2013. Cancer. 2019. May;125(9):1489–98. [DOI] [PMC free article] [PubMed] [Google Scholar]
- 3.Randi G, Franceschi S, La Vecchia C. Gallbladder cancer worldwide: Geographical distribution and risk factors. Int J Cancer. 2006. April 1;118(7):1591–602. [DOI] [PubMed] [Google Scholar]
- 4.Lorenzo Bermejo J, Boekstegers F, González Silos R, Marcelain K, Baez Benavides P, Barahona Ponce C, et al. Subtypes of Native American ancestry and leading causes of death: Mapuche ancestry-specific associations with gallbladder cancer risk in Chile. Tishkoff SA, editor. PLOS Genet. 2017. May 25;13(5):e1006756. [DOI] [PMC free article] [PubMed] [Google Scholar]
- 5.Bosman FT, World Health Organization, International Agency for Research on Cancer, editors. WHO classification of tumours of the digestive system. 4th ed. Lyon: International Agency for Research on Cancer; 2010. 417 p. (World Health Organization classification of tumours). [Google Scholar]
- 6.Ferlay J, Colombet M, Soerjomataram I, Mathers C, Parkin DM, Piñeros M, et al. Estimating the global cancer incidence and mortality in 2018: GLOBOCAN sources and methods. Int J Cancer [Internet]. 2018 Dec 6 [cited 2019 Apr 26]; Available from: 10.1002/ijc.31937 [DOI] [PubMed] [Google Scholar]
- 7.American Cancer Society (ACS). Survival Rates for Gallbladder Cancer. Available from: https://www.cancer.org/cancer/gallbladder-cancer/detection-diagnosis-staging/survival-rates.html
- 8.Bertran E, Heise K, Andia ME, Ferreccio C. Gallbladder cancer: incidence and survival in a high-risk area of Chile. Int J Cancer. 2010. November 15;127(10):2446–54. [DOI] [PubMed] [Google Scholar]
- 9.Hsing AW, Gao Y-T, Han T-Q, Rashid A, Sakoda LC, Wang B-S, et al. Gallstones and the risk of biliary tract cancer: a population-based study in China. Br J Cancer. 2007. December 3;97(11):1577–82. [DOI] [PMC free article] [PubMed] [Google Scholar]
- 10.Nogueira L, Freedman ND, Engels EA, Warren JL, Castro F, Koshiol J. Gallstones, Cholecystectomy, and Risk of Digestive System Cancers. Am J Epidemiol. 2014. March 15;179(6):731–9. [DOI] [PMC free article] [PubMed] [Google Scholar]
- 11.Shrikhande SV, Barreto SG, Singh S, Udwadia TE, Agarwal AK. Cholelithiasis in gallbladder cancer: Coincidence, cofactor, or cause! Eur J Surg Oncol EJSO. 2010. June;36(6):514–9. [DOI] [PubMed] [Google Scholar]
- 12.Maringhini A, Moreau JA, Melton LJ, Hench VS, Zinsmeister AR, DiMagno EP. Gallstones, gallbladder cancer, and other gastrointestinal malignancies. An epidemiologic study in Rochester, Minnesota. Ann Intern Med. 1987. July;107(1):30–5. [DOI] [PubMed] [Google Scholar]
- 13.Larsson SC, Wolk A. Obesity and the risk of gallbladder cancer: a meta-analysis. Br J Cancer. 2007. May 7;96(9):1457–61. [DOI] [PMC free article] [PubMed] [Google Scholar]
- 14.Yagyu K, Kikuchi S, Obata Y, Lin Y, Ishibashi T, Kurosawa M, et al. Cigarette smoking, alcohol drinking and the risk of gallbladder cancer death: A prospective cohort study in Japan. Int J Cancer. 2008. February 15;122(4):924–9. [DOI] [PubMed] [Google Scholar]
- 15.Jackson SS, Van Dyke AL, Zhu B, Pfeiffer RM, Petrick JL, Adami H-O, et al. Anthropometric Risk Factors for Cancers of the Biliary Tract in the Biliary Tract Cancers Pooling Project. Cancer Res. 2019. May 21;canres.0459.2019. [DOI] [PMC free article] [PubMed] [Google Scholar]
- 16.Andrén-Sandberg A Diagnosis and management of gallbladder polyps. North Am J Med Sci. 2012. May;4(5):203–11. [DOI] [PMC free article] [PubMed] [Google Scholar]
- 17.Razumilava N, Gores GJ, Lindor KD. Cancer surveillance in patients with primary sclerosing cholangitis. Hepatol Baltim Md. 2011. November;54(5):1842–52. [DOI] [PMC free article] [PubMed] [Google Scholar]
- 18.Hassan EH, Gerges SS, El-Atrebi KA, El-Bassyouni HT. The role of H. pylori infection in gall bladder cancer: clinicopathological study. Tumour Biol J Int Soc Oncodevelopmental Biol Med. 2015. September;36(9):7093–8. [DOI] [PubMed] [Google Scholar]
- 19.Mhatre S, Wang Z, Nagrani R, Badwe R, Chiplunkar S, Mittal B, et al. Common genetic variation and risk of gallbladder cancer in India: a case-control genome-wide association study. Lancet Oncol. 2017. April;18(4):535–44. [DOI] [PubMed] [Google Scholar]
- 20.Torre LA, Siegel RL, Islami F, Bray F, Jemal A. Worldwide Burden of and Trends in Mortality From Gallbladder and Other Biliary Tract Cancers. Clin Gastroenterol Hepatol. 2018. March;16(3):427–37. [DOI] [PubMed] [Google Scholar]
- 21.WHO Mortality Database raw data files ICD-10 [database on the Internet]. World Health Organization. 2016. [cited July 25, 2016]. Available from [Internet]. Available from: https://www.who.int/healthinfo/statistics/mortality_rawdata/en/
- 22.SEGI M, FUJISAKU S, KURIHARA M, NARAI Y, SASAJIMA K The age-adjusted death rates for malignant neoplasms in some selected sites in 23 countries in 1954–1955 and their geographical correlation. Tohoku J Exp Med. 1960. August 25;72:91–103. [DOI] [PubMed] [Google Scholar]
- 23.R Development Core Team. R Development Core Team. R: A language and environment for statistical computing [computer programme]. Vienna, Austria: R Foundation for Statistical Computing; 2014. [Google Scholar]
- 24.Lemrow SM, Perdue DG, Stewart SL, Richardson LC, Jim MA, French HT, et al. Gallbladder cancer incidence among American Indians and Alaska Natives, US, 1999–2004. Cancer. 2008. September 1;113(5 Suppl):1266–73. [DOI] [PubMed] [Google Scholar]
- 25.Miller KD, Goding Sauer A, Ortiz AP, Fedewa SA, Pinheiro PS, Tortolero-Luna G, et al. Cancer Statistics for Hispanics/Latinos, 2018. CA Cancer J Clin. 2018. November;68(6):425–45. [DOI] [PubMed] [Google Scholar]
- 26.Siegel RL, Miller KD, Jemal A. Cancer statistics, 2019: Cancer Statistics, 2019. CA Cancer J Clin. 2019. January;69(1):7–34. [DOI] [PubMed] [Google Scholar]
- 27.Lazcano-Ponce EC, Miquel JF, Muñoz N, Herrero R, Ferrecio C, Wistuba II, et al. Epidemiology and molecular pathology of gallbladder cancer. CA Cancer J Clin. 2001. December;51(6):349–64. [DOI] [PubMed] [Google Scholar]
- 28.Lorenzo Bermejo J, Boekstegers F, González Silos R, Marcelain K, Baez Benavides P, Barahona Ponce C, et al. Subtypes of Native American ancestry and leading causes of death: Mapuche ancestry-specific associations with gallbladder cancer risk in Chile. PLoS Genet. 2017. May;13(5):e1006756. [DOI] [PMC free article] [PubMed] [Google Scholar]
- 29.Mhatre SS, Nagrani RT, Budukh A, Chiplunkar S, Badwe R, Patil P, et al. Place of birth and risk of gallbladder cancer in India. Indian J Cancer. 2016. June;53(2):304–8. [DOI] [PubMed] [Google Scholar]
- 30.Hsing AW, Gao Y-T, Han T-Q, Rashid A, Sakoda LC, Wang B-S, et al. Gallstones and the risk of biliary tract cancer: a population-based study in China. Br J Cancer. 2007. December 3;97(11):1577–82. [DOI] [PMC free article] [PubMed] [Google Scholar]
- 31.Nogueira L, Freedman ND, Engels EA, Warren JL, Castro F, Koshiol J. Gallstones, cholecystectomy, and risk of digestive system cancers. Am J Epidemiol. 2014. March 15;179(6):731–9. [DOI] [PMC free article] [PubMed] [Google Scholar]
- 32.Everhart JE, Khare M, Hill M, Maurer KR. Prevalence and ethnic differences in gallbladder disease in the United States. Gastroenterology. 1999. September;117(3):632–9. [DOI] [PubMed] [Google Scholar]
- 33.Moro PL, Checkley W, Gilman RH, Cabrera L, Lescano AG, Bonilla JJ, et al. Gallstone disease in Peruvian coastal natives and highland migrants. Gut. 2000. April;46(4):569–73. [DOI] [PMC free article] [PubMed] [Google Scholar]
- 34.Miquel JF, Covarrubias C, Villaroel L, Mingrone G, Greco AV, Puglielli L, et al. Genetic epidemiology of cholesterol cholelithiasis among Chilean Hispanics, Amerindians, and Maoris. Gastroenterology. 1998. October;115(4):937–46. [DOI] [PubMed] [Google Scholar]
- 35.Latorre SG, Ivanovic-Zuvic SD, Corsi SÓ, Valdivia CG, Margozzini MP, Olea OR, et al. [Coverage of the gallbladder cancer prevention strategy in Chile: results from the 2009–2010 National Health Survey]. Rev Med Chil. 2015. February;143(2):158–67. [DOI] [PubMed] [Google Scholar]
- 36.Asperti AM, Reis P, Diniz MA, Pinto MD, da Silva EC, da Silva DFD, et al. The Lowest Prevalence of Cholelithiasis in the Americas - An Autopsy-based Study. Clin Sao Paulo Braz. 2016. July;71(7):365–9. [DOI] [PMC free article] [PubMed] [Google Scholar]
- 37.Andia KM, Gederlini GA, Ferreccio RC. Cáncer de vesícula biliar: Tendencia y distribución del riesgo en Chile. Rev Médica Chile [Internet]. 2006. May [cited 2019 Jun 3];134(5). Available from: http://www.scielo.cl/scielo.php?script=sci_arttext&pid=S0034-98872006000500004&lng=en&nrm=iso&tlng=en [DOI] [PubMed] [Google Scholar]
- 38.Ryu S, Chang Y, Yun KE, Jung H-S, Shin JH, Shin H. Gallstones and the Risk of Gallbladder Cancer Mortality: A Cohort Study. Am J Gastroenterol. 2016. October;111(10):1476–87. [DOI] [PubMed] [Google Scholar]
- 39.Chow WH, Johansen C, Gridley G, Mellemkjaer L, Olsen JH, Fraumeni JF. Gallstones, cholecystectomy and risk of cancers of the liver, biliary tract and pancreas. Br J Cancer. 1999. February;79(3–4):640–4. [DOI] [PMC free article] [PubMed] [Google Scholar]
- 40.Portincasa P, Moschetta A, Palasciano G. Cholesterol gallstone disease. The Lancet. 2006. July;368(9531):230–9. [DOI] [PubMed] [Google Scholar]
- 41.Andreotti G, Hou L, Gao Y-T, Brinton LA, Rashid A, Chen J, et al. Reproductive factors and risks of biliary tract cancers and stones: a population-based study in Shanghai, China. Br J Cancer. 2010. March;102(7):1185–9. [DOI] [PMC free article] [PubMed] [Google Scholar]
- 42.Jackson SS, Van Dyke AL, Zhu B, Pfeiffer RM, Petrick JL, Adami H-O, et al. Anthropometric Risk Factors for Cancers of the Biliary Tract in the Biliary Tract Cancers Pooling Project. Cancer Res. 2019. May 21;canres.0459.2019. [DOI] [PMC free article] [PubMed] [Google Scholar]
- 43.Koshiol J, Castro F, Kemp TJ, Gao Y-T, Roa JC, Wang B, et al. Association of inflammatory and other immune markers with gallbladder cancer: Results from two independent case-control studies. Cytokine. 2016;83:217–25. [DOI] [PMC free article] [PubMed] [Google Scholar]
- 44.Gonzalez-Escobedo G, Marshall JM, Gunn JS. Chronic and acute infection of the gall bladder by Salmonella Typhi: understanding the carrier state. Nat Rev Microbiol. 2011. January;9(1):9–14. [DOI] [PMC free article] [PubMed] [Google Scholar]
- 45.Nogueira L, Foerster C, Groopman J, Egner P, Koshiol J, Ferreccio C, et al. Association of aflatoxin with gallbladder cancer in Chile. JAMA. 2015. May 26;313(20):2075–7. [DOI] [PMC free article] [PubMed] [Google Scholar]
- 46.Rawla P, Sunkara T, Thandra KC, Barsouk A. Epidemiology of gallbladder cancer. Clin Exp Hepatol. 2019;5(2):93–102. [DOI] [PMC free article] [PubMed] [Google Scholar]
- 47.Kan H-P, Guo W, Tan Y-F, Zhou J, Liu C, Huang Y-Q. Statin use and risk of gallstone disease: A meta-analysis: Statin use and risk of gallstone disease. Hepatol Res. 2015. September;45(9):942–8. [DOI] [PubMed] [Google Scholar]
- 48.Maclure KM, Hayes KC, Colditz GA, Stampfer MJ, Speizer FE, Willett WC. Weight, Diet, and the Risk of Symptomatic Gallstones in Middle-Aged Women. N Engl J Med. 1989. August 31;321(9):563–9. [DOI] [PubMed] [Google Scholar]
- 49.Campbell PT, Newton CC, Kitahara CM, Patel AV, Hartge P, Koshiol J, et al. Body Size Indicators and Risk of Gallbladder Cancer: Pooled Analysis of Individual-Level Data from 19 Prospective Cohort Studies. Cancer Epidemiol Biomarkers Prev. 2017. April;26(4):597–606. [DOI] [PMC free article] [PubMed] [Google Scholar]
- 50.Valle JW, Borbath I, Khan SA, Huguet F, Gruenberger T, Arnold D. Biliary cancer: ESMO Clinical Practice Guidelines for diagnosis, treatment and follow-up†. Ann Oncol. 2016. September;27(suppl_5):v28–37. [DOI] [PubMed] [Google Scholar]
- 51.Zhu AX, Hong TS, Hezel AF, Kooby DA. Current Management of Gallbladder Carcinoma. The Oncologist. 2010. February 1;15(2):168–81. [DOI] [PMC free article] [PubMed] [Google Scholar]
- 52.Löhe F, Meimarakis G, Schauer C, Angele M, Jauch KW, Schauer RJ. The time of diagnosis impacts surgical management but not the outcome of patients with gallbladder carcinoma. Eur J Med Res. 2009. August 12;14(8):345–51. [DOI] [PMC free article] [PubMed] [Google Scholar]
- 53.Pan American Health Organization Health in the Americas. Bolivia. [Internet]. 2019. Available from: https://www.paho.org/salud-en-las-americas-2017/?page_id=95
- 54.Pan American Health Organization Health in the Americas. Peru. [Internet]. [cited 2019 Jun 14]. Available from: https://www.paho.org/salud-en-las-americas-2017/?page_id=149
- 55.College of American Pathologist. Protocol for the Examination of Specimens From Patients With Carcinoma of the Gallbladder [Internet]. [cited 2019 Jul 25]. Available from: https://www.cap.org/protocols-and-guidelines/cancer-reporting-tools/cancer-protocol-templates
- 56.Bosman FT, World Health Organization, International Agency for Research on Cancer, editors. WHO classification of tumours of the digestive system. 4th ed. Lyon: International Agency for Research on Cancer; 2010. 417 p. (World Health Organization classification of tumours). [Google Scholar]
- 57.Welzel TM, McGlynn KA, Hsing AW, O’Brien TR, Pfeiffer RM. Impact of Classification of Hilar Cholangiocarcinomas (Klatskin Tumors) on the Incidence of Intra- and Extrahepatic Cholangiocarcinoma in the United States. JNCI J Natl Cancer Inst. 2006. June 21;98(12):873–5. [DOI] [PubMed] [Google Scholar]