

Abstract
Purpose:
The primary purpose of this study was to examine complex nonverbal response inhibition and stopping impulsivity in children who do (CWS) and do not stutter (CWNS).
Method:
A total of 30 CWS and 30 CWNS between the ages of 3;1 and 6;0 (years; months) performed the Peg-Tapping Task (PTT; Diamond & Taylor, 1996; Luria, 1966), in which children were required to tap a dowel once when an examiner taps twice and vice versa. The main dependent variables were the number of practice trials, response accuracy, response latency for accurate responses, and the number of extra taps (i.e., tapping more than two times).
Results:
The CWS were less accurate and slower on the PTT than the CWNS, with no differences in the number of practice trials. Furthermore, the CWS, especially boys, produced more extra taps than the CWNS.
Conclusions:
Findings revealed that preschool CWS have weaknesses in complex response inhibition and stopping impulsivity in the nonverbal domain compared to CWNS. Taken together, these findings along with those of previous studies indicate that CWS may have weaknesses in inhibition and impulsivity in the nonverbal domain as well as the verbal domain, suggesting a domain-general weakness.
Keywords: Stuttering, cognition, inhibition, impulsivity, children
1. Introduction
Throughout development, young children are expected to exert control over their behavior (e.g., how loudly they speak in different contexts), thoughts (e.g., the belief that a monster lives under the bed), and emotions (e.g., the urge to throw a tantrum; Duckworth, Gendler, & Gross, 2014; Strayhorn, 2002). According to Garon, Bryson, and Smith (2008), the earliest demonstration of self-control in infants is when they respond to a caregiver’s request to stop an activity. Typically, eight-month-old infants demonstrate the ability to suppress their own behavior about 40% of the time, with this skill reaching between 78–90% by 33-months of age (Kochanska, 2002; Kochanska, Tjebkes, & Forman, 1998). The ability to exert self-control requires inhibition (also known as response inhibition or inhibitory control), which generally refers to the capacity to refrain from producing a specific response while in pursuit of a particular goal (Diamond, 2013; Friedman & Miyake, 2004). Difficulties with inhibition can result in impulsivity, which is a tendency to produce a response based on instinct (Bari & Robbins, 2013; Dalley, Everitt, & Robbins, 2011). Impulsivity is one of the primary features of Attention Deficit Hyperactivity Disorder (ADHD; Foley, McClowry & Castellanos, 2008; Patros et al., 2016). Furthermore, children with developmental disorders, such as Developmental Language Disorder, have been shown to not only have weaknesses in inhibition (disinhibition), but also exhibit an impulsive response pattern (i.e., false alarm; e.g., Lum, Ullman, & Conti-Ramsden, 2015; Marton, 2008; Marton, Campanelli, Scheuer, Yoon, & Eichorn, 2012).
Like children with developmental language disorder, there is some evidence from the childhood stuttering literature to suggest that children who stutter (CWS) may have weaknesses in response inhibition (e.g., Anderson & Wagovich, 2017; Piispala et al., 2017) and impulsivity (e.g., Donaher & Richels, 2012; Eggers, De Nil, & Van den Bergh, 2013). However, findings from this literature have been contradictory, with some studies failing to find differences between CWS and children who do not stutter (CWNS; e.g., Eggers, De Nil, & Van den Bergh, 2018; Piispala, Kallio, Bloigu, & Jansson-Verkasalo, 2016), suggesting the need for further exploration of these processes in childhood stuttering. The present study was, therefore, designed to examine both response inhibition and impulsivity in preschool CWS and CWNS. To provide a framework, we begin with a discussion of the relation between response inhibition and impulsivity, and how these skills develop in typically developing children. Since there also appears to be differences in inhibition and impulsivity based on biological sex, we briefly discuss this literature as well. Finally, we explore the literature on the inhibition and impulsivity skills of CWS prior to presenting the rationale and research questions for the present study.
1.1. Response Inhibition and Impulsivity
Response inhibition, a component of executive function, develops during early childhood (Diamond, 2013; Kochanska, Murray, Jacques, Koenig, & Vandegeest, 1996). Response inhibition can be categorized as verbal or nonverbal (Carlson & Moses, 2001) and simple or complex (Friedman & Miyake, 2004), with the latter being based on the extent to which working memory is involved (Best & Miller, 2010; Garon et al., 2008). Simple response inhibition, which involves refraining from providing a specific response to a set of stimuli, can be assessed using tasks such as the go/no-go (De Sonneville, 2009) and stop-signal task (Logan & Cowan, 1984), whereas complex response inhibition, which involves suppressing a response while also producing a conflicting response, is often examined using the day-night task (Gerstadt, Hong, & Diamond, 1994) and it’s variants (e.g., the grass-snow task; Carlson & Moses, 2001).
Impulsivity, on the other hand, is an umbrella term used to characterize a wide range of behaviors, some of which may be helpful (e.g., rushing in to defend a sibling from a bully) and others that may not be so helpful (e.g., frequently interrupting conversational partners; Bari & Robbins, 2013; Dalley et al., 2011; Dickman, 1990; Evenden, 1999). Given its complex nature, researchers have developed various taxonomies to characterize different types of impulsivity. For example, Robinson et al. (2009) categorized impulsivity into waiting (producing an anticipatory response) and stopping (difficulties ending an ongoing response) impulsivity, whereas other researchers (e.g., Robbins & Dalley, 2017) also include risky choices (choosing a smaller reward now instead of a larger reward later). Typically, impulsivity is measured by examining the type of errors participants produce on inhibition tasks. To illustrate, premature responses (i.e., producing a response in anticipation of the presentation of a stimulus) and commission errors (i.e., responding to the no-go stimuli) on the go/no-go task are an index of waiting impulsivity (Bezdjian, Baker, Lozano, & Raine, 2009). On the other hand, commission errors on the stop-signal task (i.e., responding to the stimulus after the stop signal is presented) taps into stopping impulsivity (Logan, Van Zandt, Verbruggen, & Wagenmakers, 2014; Robbins & Dalley, 2017).
Whereas some researchers consider impulsivity to be synonymous with weaknesses in inhibition (i.e., impulsivity is a consequence of disinhibition, such that someone who has poor inhibition will also be impulsive; Diamond & Ling, 2016; Fahie & Symons, 2003), others have suggested that disinhibition and impulsivity are conceptually distinct, but their behavioral manifestations overlap (Nigg, 2017). According to this view, disinhibition is associated with an act that requires restraint (e.g., not refraining from taking another cookie despite being told that you can’t have anymore); impulsivity is related to the urge to continue performing a behavior without conscious awareness (e.g., dipping your hand into an empty bag of potato chips while watching television; Hofmann, Friese, & Strack, 2009).
Some studies have reported low to moderate associations between measures of inhibition and impulsivity in typically developing children (Ahadi, Rothbart, & Ye, 1993; Floyd & Kirby, 2001) and children with ADHD (Kerns, McInerney, & Wilde, 2001). In a longitudinal study, Aksan and Kochanska (2004) examined the relationship between simple response inhibition and waiting impulsivity in young children at 22, 33, and 45 months of age using various behavioral tasks. They found no significant correlations between inhibition and impulsivity at 22 (r = −.14) and 33 (r = −.12) months, but inhibition was moderately correlated (r = −.45) with impulsivity at 45 months of age. These findings indicate that inhibition and impulsivity may become more integrated over time, with stronger inhibition skills being associated with lower impulsivity. They further suggested that while there may be some underlying factor that is knitting these two constructs together—at least at 45 months of age—they are not equivalent, given that the correlations are not perfect. In other words, inhibition and impulsivity are related, but separable.
1.2. Response Inhibition and Impulsivity in Typically Developing Children
Inhibition skills emerge in infancy, but develop rapidly during the preschool years (Carlson, 2005). It is, therefore, not surprising that younger children tend to be less accurate than older children on response inhibition tasks (e.g., Carlson, 2005; Carlson & Moses, 2001; Kochanska et al., 1996). For example, Wolfe and Bell (2007) examined complex response inhibition using the day-night task (Gerstadt et al., 1994) in three groups of children by age: 3½, 4, and 4½ years. They found that accuracy systematically increased from the youngest to the oldest age group (62%, 74%, and 78%, respectively), confirming that inhibition improves as children get older. In another study, Wiebe, Sheffield and Espy (2012) examined 376 typically developing children between three and five years of age using the Fish-Shark go/no-go task. As expected, accuracy improved with age. However, younger children who were more accurate also performed more slowly (i.e., they exhibited a speed-accuracy trade-off), but this tendency diminished in the older children. Interestingly, the girls were more accurate when responding to the no-go trials (where they had to refrain from pressing a button when they saw a shark), whereas the boys were faster on their responses to the go trials (where they had to press a button when they saw a fish). The authors interpreted the results to suggest sex differences in inhibition and impulsivity.
Other studies have also reported differences between girls and boys in inhibition and impulsivity. In particular, toddler, preschool, and school-aged girls reportedly have stronger inhibition skills and tend to be less impulsive than same aged boys (Berlin, Bohlin, & Rydell, 2003; Carlson & Moses, 2001; Carlson & Wang, 2007; Else-Quest, Hyde, Goldsmith, & Van Hulle, 2006; Forzano, Michels, Carapella, Conway, & Chelonis, 2011; Klenberg, Korkman, & Lahti-Nuuttila, 2001; Kochanska, Coy, & Murray, 2001; Kochanska, Murray, & Harlan, 2000; Kochanska et al., 1996; Logue & Chavarro, 1992; Olino, Durbin, Klein, Hayden, & Dyson, 2013; Olson, Schilling, & Bates, 1999; Størksen, Ellingsen, Wanless, & McClelland, 2015; Wiebe, Espy, & Charak, 2008). A few studies, however, have failed to find sex differences in inhibition and impulsivity in young children (Carlson, Moses, & Breton, 2002; Clark, Sheffield, Wiebe, & Espy, 2013; Davidson, Amso, Anderson, & Diamond, 2006; Wiebe et al., 2011). The notion that boys may be more disinhibited and impulsive is of interest, given that boys are also more likely to stutter than girls at a ratio of 3 to 4 boys for every one girl among school-aged children (Bloodstein & Bernstein Ratner, 2008).
1.3. Response Inhibition and Impulsivity in Children who Stutter
Researchers have used several different behavioral tasks—namely the go/no-go and stop-signal task—to examine response inhibition and impulsivity in CWS, but with mixed results. Some studies have revealed that CWS, when compared to CWNS, may have weaknesses in response inhibition (Anderson & Wagovich, 2017; Eggers, et al., 2013; Piispala, et al., 2017), whereas others have reported that CWS and CWNS exhibit comparable inhibition skills (Eggers et al., 2018; Piispala et al., 2016). For example, Eggers et al. (2013) examined response inhibition in preschool and school-age CWS (n = 30) and CWNS (n = 30) using the go/no-go task of the Amsterdam Neuropsychological Tasks (De Sonneville, 2009). The go/no-go task requires participants to press a button when a symbol of a green walking man (go stimuli) is presented on the computer screen and to refrain from responding when a symbol of a red standing man (no-go stimuli) is presented. With this simple response inhibition task, the inhibition demands appear early—immediately after the no-go stimuli (i.e., the red standing man) appears. The results revealed that the CWS produced more premature responses (i.e., the child responds between 0 and 200 msec after the stimulus appears) and false alarms (i.e., the child responds to the no-go stimuli within 200 and 2300 ms after the stimulus appears) than the CWNS. These findings were interpreted to suggest that the CWS had a “less controlled response style,” indicative of greater impulsivity (Eggers et al., 2013).
Subsequently, Eggers et al. (2018) examined response inhibition in school-age CWS (n = 18) and CWNS (n = 18). In this study, the researchers used the stop-signal task (Verbruggen, Logan, & Stevens, 2008), in which children push a button (right or left) to select one of two visually presented stimuli (square or circle). When the square was presented, the children pressed the right button and when the circle was presented, they pressed the left button. On 25% of the trials, however, after the visual stimuli appeared, participants heard a tone (i.e., the stop signal), which indicated that they should refrain from responding. In this simple response inhibition task, the inhibition demand occurs after the child has already initiated a response. The researchers found no significant differences between the CWS and the CWNS in response accuracy or speed, suggesting that the two groups were comparable in their ability to suppress responses to externally presented cues.
Although the stop-signal task is more difficult than the go/no-go task (Verbruggen & Logan, 2008; Wessel, 2018), CWS exhibited more difficulty with the go/no-go task relative to their typically fluent peers (Eggers et al., 2013), but not the stop-signal task (Eggers et al., 2018). One potential explanation for the difference in findings across the two studies is that the CWS in Eggers et al. (2013) were younger than those in Eggers et al. (2018). Differences might be more likely to appear in younger children than older children because their inhibition skills are less mature and lags in the acquisition of these skills would be more prominent earlier in development than later. However, Eggers et al. (2018) also noted that the tasks used in these studies differed in that (a) the inhibition demands occurred at different stages of the response—before the response was initiated (i.e., at the early-activational level) in the go/no-go task and after the response was already initiated in the stop-signal task, and (b) the cues prompting the decision to respond were based on different aspects of the task—upon the appearance of the visual stimuli (i.e., green walking man vs. red standing man) in the go/no-go task, which is part of the task itself, and the auditory signal in the stop-signal task, which is not part of the task.
On the other hand, Anderson and Wagovich (2017) examined the inhibition skills of preschool-age CWS (n = 41) and CWNS (n = 41) using the grass-snow (adapted from Carlson and Moses, 2001) and baa-meow tasks, which measure explicit and implicit verbal complex response inhibition, respectively. Both tasks required the participants to produce a conflicting response upon hearing an auditory stimulus. For the grass-snow task, children pressed the grass button whenever they heard the word snow and the snow button when they heard the word grass (i.e., they did the opposite of what they heard). The baa-meow task was similar, except that the auditory stimuli were animal sounds (baa and meow), and the buttons pictured a sheep and cat. Thus, with these complex response inhibition tasks, the children were not only required to suppress the dominant response (i.e., not pressing the cat button when they heard meow), but also produce a subdominant response (i.e., pressing the sheep button when they heard meow). The authors found that the CWS not only performed less accurately than the CWNS on the baa-meow task, but they also performed more slowly on both tasks. According to Anderson and Wagovich, these findings suggest that CWS may have some difficulty with inhibition. They further speculated that weaknesses in inhibition could have an impact on speech fluency by way of the monitoring system. In this way, they posit that such weaknesses in inhibition could make it more challenging for children to suppress incorrect speech plans prior to production, resulting in an increase in errors (due to a failure in the attempt to inhibit an incorrect speech plan that had gone undetected by the monitor) or longer processing times (incorrect speech plans detected by the monitor would take longer to suppress, but it would eventually be accomplished). The authors presuppose that only in this latter case, in which the child is attempting to suppress the incorrect speech plan (resulting in longer processing times), would disfluencies be expected to increase, perhaps as a way of “buying time” to select the correct plan and/or to maintain the conversational floor.
The grass-snow and baa-meow tasks differ from the go/no-go and stop-signal tasks in, at least, four ways. First, the former set of tasks (i.e., grass-snow and baa-meow) involve explicit and implicit verbal stimuli whereas the latter set (i.e., go/no-go and stop-signal) contain nonverbal stimuli. Second, with the go/no-go and stop-signal tasks, children must rely on an external visual or verbal cue to decide whether to inhibit their response, whereas external cues are not used in the grass-snow and baa-meow tasks (Petersen, Hoyniak, McQuillan, Bates, & Staples, 2016). Third, children must produce a conflicting response on the grass-snow and baa-meow tasks (i.e., it involves complex response inhibition), but not on the go/no-go and stop-signal tasks (i.e., it involves simple response inhibition). Finally, inhibition demands occur on all trials of the grass-snow and baa-meow tasks, but only on a select number of trials on the go/no-go tasks (i.e., only on the no-go trials) and the stop-signal task. However, the inhibition demand occurs before the response is initiated in the grass-snow, baa-meow, and go/no-go tasks, but after the response has already been initiated in the stop-signal task.
Impulsivity has not been directly studied in CWS and CWNS. Several investigators, however, have examined impulsivity in the context of memory, inhibition, and attention. Of these studies, two reported that CWS produced more false alarms than CWNS during memory (Anderson, Wagovich, & Brown, 2019) and inhibition (Eggers et al., 2013) tasks, suggesting difficulty with waiting impulsivity. The other study examined visual attention (Blood, Blood, Maloney, Weaver, & Shaffer, 2007) using the Continuous Performance Test-II (CPT-II; Conners, 2002) in 19 CWS and 19 CWNS. The children were presented with a series of letters on the computer screen and were required to press a button only when they saw the “X.” Children’s responses were categorized into seven subscales, one of which was risk-taking, and an overall attention score. The results showed that both groups were comparable in overall attention and all subscales, except for the risk-taking subscale in which CWS scored lower. Moreover, none of the CWNS scored below the normative means on the seven subscales. The same was true of the CWS, except for the risk-taking subscale in which 11 (58%) of the children scored one or more standard deviations below the mean. The researchers interpreted these results to suggest that, when compared to the CWNS, the CWS were more likely to take risks (i.e., to be more impulsive) when responding to stimuli. Some studies have also suggested that CWS may be more prone to developing ADHD, which is often associated with impulsivity (e.g., Donaher & Richels, 2012; Druker, Hennessey, Mazzucchelli, & Beilby, 2019; cf. Healey & Reid, 2003).
On the other hand, there is some suggestion that, when compared to CWNS, preschool CWS may be slower to adapt to novel circumstances, which may make them more cautious in unfamiliar situations (e.g., Anderson, Pellowski, Conture, & Kelly, 2003; cf. Jones, Choi, Conture, & Walden, 2014). Eichorn, Marton, and Pirutinsky (2018) also found evidence to suggest that preschool CWS may be more cautious than CWNS when completing a cognitive flexibility task due to potential concern over making errors. At first glance, these studies would seem to suggest that CWS may be less likely to take risks (i.e., be less impulsive) than their typically fluent peers. However, these findings are speculative in that they were based on the authors interpretation of their data and impulsivity was not measured directly.
In sum, there is some evidence to suggest that CWS may be more likely to have difficulty with inhibition, but given the inconsistent findings, it is by no means conclusive. On the other hand, of the empirical studies that have indirectly examined impulsivity in CWS, all have reported that CWS are more prone to have difficulty with waiting and risk-taking impulsivity than CWNS. Clearly, more research is needed to better understand the role of inhibition and impulsivity in childhood stuttering.
1.4. Purpose of the Study
The primary purpose of the present study was to examine complex nonverbal response inhibition and stopping impulsivity in preschool CWS and CWNS using the Peg Tapping Task (PTT; Diamond & Taylor, 1996; Luria, 1966). We also explored potential sex differences in inhibition and impulsivity across, within, and between the two groups of children, given that boys are more likely to be disinhibited and impulsive than girls (e.g., Carlson & Wang, 2007; Else-Quest et al., 2006). Given that working memory may contribute to performance on inhibition tasks (Diamond & Taylor, 1996; Garon et al., 2008; Rhoades, Greenberg, & Domitrovich, 2009) and CWS have been shown in previous studies to have difficulty with at least one component of working memory—namely, short-term memory (e.g., Anderson et al., 2019)—we further examined whether memory demands could have influenced the children’s performance on the PTT (Anderson & Wagovich, 2017).
The PTT was modified for children between the ages of 3½ and 7 years (Diamond & Taylor, 1996). The task requires children to tap a dowel once when an examiner taps twice and vice versa. According to Diamond and Taylor, one of the most common errors young children produce on the task are extra taps (i.e., tapping more than two times), which they viewed as unusable data. However, if inhibition and impulsivity are distinct but related constructs, then extra taps would be indicative of stopping impulsivity, since the child is, by definition, having difficulty ending the ongoing response. The PTT has good test–retest reliability, with a correlation coefficient of .80 (Lipsey et al., 2017). Similar tasks (e.g., pencil tapping task, finger-fist task, etc.) have also been used with young children, further attesting to the developmental appropriateness of the task for the children in the present study (e.g., Blair, 2003; Fahie & Symons, 2003; Howard & Okely, 2015; Rhoades et al., 2009; Willoughby, Kupersmidt, & Voegler-Lee, 2012).
The PTT differs from other inhibition tasks that have been used in the childhood stuttering literature, primarily the go/no-go and stop-signal tasks in, at least, four ways. First, the PTT measures complex response inhibition, whereas most other studies have used tasks that measure simple response inhibition (Eggers et al., 2013; Piispala et al., 2016; Piispala et al., 2017). Second, the PTT is similar to the tasks (grass-snow and baa-meow tasks) used in Anderson and Wagovich (2017) in that both assess complex response inhibition, but they differ in that the former (i.e., PTT) is nonverbal, whereas the latter (i.e., grass-snow and baa-meow tasks) are verbal. Third, the PTT differs from the other tasks used in the developmental stuttering literature (i.e., grass-snow, baa-meow, go/no-go, and stop-signal tasks) in that the inhibition demands of the task are ongoing. As will be recalled, the inhibition demands are at their highest in the early stage of the grass-snow, baa-meow, and go/no-go tasks (i.e., when they see or hear the stimuli), and after the child has already initiated the response in the stop-signal task (i.e., after they see the stimulus and when they hear the auditory signal). In the PTT, the inhibition demands are evoked when the child is informed of the inhibition requirement (i.e., when they see what the examiner does), and these demands remain until the child finishes his/her response (i.e., up through their last tap). Finally, unlike the go/no-go task which uses false alarms as an index of waiting impulsivity, additional taps in the PTT were used as a measure of stopping impulsivity.
Thus, this study contributes to the existing literature on inhibition in CWS in that it is the first, to our knowledge, to examine complex response inhibition in the nonverbal domain when inhibition demands are relatively high and stopping impulsivity. If differences emerge between the CWS and CWNS, then this would suggest, when combined with findings from other studies (e.g., Anderson & Wagovich, 2017), that CWS have domain-general (i.e., affecting both the verbal and nonverbal domains) rather than domain-specific (i.e., affecting only one domain) weaknesses in complex response inhibition. On a theoretical basis, if CWS have some difficulty with inhibition then it may explain why they also have weaknesses in a multitude of domains (i.e., motor, sensory, auditory processing, linguistic), as inhibition is a foundational skill that is shared across these specific domains (e.g., Anderson & Ofoe, 2019; Kronenberger & Pisoni, 2018). That is, since inhibition and other domain-general cognitive processes (e.g., working memory, attention, etc.) are bidirectionally connected to and needed for the proper functioning of domain-specific processes, if a child has difficulty with one domain (e.g., motor), then it could not only affect underlying cognitive processes (e.g., inhibition), but also “spread” to other domain-specific processes (e.g., linguistic). Furthermore, by examining the effect of biological sex on inhibition and impulsivity, this study may further our understanding of the similarities and/or differences between boys and girls who stutter in inhibition and impulsivity.
The following research questions were addressed in the present study:
Do the CWS and CWNS differ in their performance on the PTT (number of practice trials needed, accuracy, and response latency)?
Do the CWS and CWNS differ in the number of extra taps produced on the PTT?
Are there sex differences in the children’s performance on the PTT?
Based on findings from previous research, we hypothesized that (a) the CWS, as a group, would require more practice trials, be less accurate, and respond more slowly on the PTT than the CWNS; (b) the CWS will produce more extra taps on the PTT than the CWNS; and (c) the boys will require more practice trials and be less accurate, slower, and produce more extra taps on the PTT than the girls.
2. Method
2.1. Participants
A total of 60 children (30 CWS and 30 CWNS) between the ages of 3;1 and 6;0 (years;months) participated in this study. Children were recruited using a variety of sources, including flyers and referrals from other parents in and around Bloomington, Indiana. All children were native speakers of American English with no known neurological, intellectual, behavioral, vision, hearing, or speech-language difficulties (except for stuttering in the CWS group), based on parent report and/or examiner observation or testing.
2.1.1. Group Classification
Children were classified as CWS if they: (a) produced at least three stuttering-like disfluencies (SLD; e.g., single-syllable word repetitions, part-word repetitions, sound prolongation, and/or blocks; Yairi & Seery, 2015) on words produced during a 300-word speech sample obtained during a parent-child interaction (see “Parent-child conversational interaction” below); and (b) were assigned a severity rating score of 11 or higher (a score of 11 indicates “mild” for preschoolers) on the Stuttering Severity Instrument-4 (SSI-4; Riley, 2009). Children were classified as CWNS if they produced less than three SLD, on average, per 300 words during the conversational interaction.
During the parent-child interaction, the CWS produced a mean SLD of 7.34 (range = 3.67–16.30) and the CWNS produced a mean SLD of 0.97 (range = 0–2.67). A Mann-Whitney U test indicated a significant between-group difference in the mean SLD, z = - 6.68, p < .001 (CWS: Mdn = 7.00, M rank = 45.50; CWNS: Mdn = 1.00, M rank = 15.50), a testament to the appropriate classification of the children. Based on the SSI-4, 18 CWS were rated as mild, 11 as moderate, and one as severe. The average parent-reported time since stuttering onset for the CWS was 15.58 months (range = 1–46 months).1
2.1.1.1. Matching Criteria and ADHD Screen.
The CWS were matched to the CWNS based on chronological age, socioeconomic status (SES), and biological sex. The chronological ages of the CWS and CWNS were within 4 months of each other. The CWS had a mean age of 51.77 months (SD = 10.00) and the CWNS had a mean age of 51.13 months (SD = 9.84), a nonsignificant difference, t(58) = 0.25, p = .81. The children were also paired, as close as possible, by their parent’s SES, which was determined using the Hollingshead’s Four-Factor Index of Social Position (Hollingshead, 1975, 2011). The Hollingshead’s Index is based on the highest educational level and current occupation of both parents (or one parent in a single parent household). The CWS had a mean social position score of 49.55 (Class II, upper-middle; SD = 13.92), and the CWNS had a mean social position score of 49.55 (Class II, upper-middle; SD = 14.67). A Mann-Whitney U test revealed no significant differences between the CWS (Mdn = 51.50, M rank = 30.48) and CWNS (Mdn = 53.00, M rank = 30.52) in social position, z = - .01, p = .99.
To ensure that none of the children had suspected ADHD, the parents of the CWS and CWNS completed the Attention Deficit Hyperactivity Disorder Rating Scale IV-Preschool Version (ADHD-IV-P; McGoey, DuPaul, Haley, & Shelton, 2007). The ADHD-IV-P is an 18-item norm-referenced tool for screening symptoms of hyperactivity-impulsivity and inattention associated with ADHD in preschool children. Parents rate each item of the ADHD-IV-P using a four-point scale from “rarely or never” true to “very often” true, based on their child’s behavior over the preceding six months. Total scores that are higher than 24 for girls and 32 for boys (a threshold of 93rd percentile) indicate an increased risk for developing ADHD. None of the CWS or CWNS scored above these thresholds, suggesting that they have little risk of developing ADHD. The mean total scores for CWS and CWNS were 11.48 (SD = 7.92) and 11.33 (SD = 5.86), respectively. An independent samples t-test showed no significant between-group difference in the total scores, t(57) = .083, p = .93, suggesting that both groups of preschoolers were comparable in their risk for developing ADHD.
The two groups of children were matched exactly by biological sex. The 20 boys and 10 girls in each group were comparable in chronological age (Boys: M = 52.25, SD = 10.0; Girls: M = 49.85, SD = 9.55), t(58) = 0.89, p = .38, SES (Boys: Mdn = 55.50, M rank = 32.86; Girls: Mdn = 45.50, M rank = 25.78), z = - 1.48, p = .14, performance on the speech and language tests, F (4, 54) = .46, p = .77, and the total ADHD-IV-P score (Boys: M = 11.97, SD = 7.43; Girls: M = 10.30, SD = 5.71), t(57) = .88, p = .38. There were also no significant differences in age, SES, speech-language test performance, and the total ADHD-IV-P score between the CWS and CWNS boys (p = .71, .86, .89, and .48, respectively) and the CWS and CWNS girls (p = .91, .85, .19, and .29, respectively).
2.2. Procedures
The children completed the following tasks during a one-hour session: (a) parent-child interaction, (b) standardized speech and language tests, (c) hearing screening, and (d) nonverbal complex response inhibition task. The Indiana University Institutional Review Board approved the study protocol.
2.2.1. Parent-child Conversational Interaction
Parents interacted with their children for the purposes of speech disfluency analysis and group (CWS or CWNS) classification. The interaction was play-based, lasting between 15–20 minutes. During the interaction, a 300-word sample of the child’s speech was coded for the frequency and types of disfluencies.
2.2.2. Standardized Speech-Language Tests.
Two vocabulary tests—the Peabody Picture Vocabulary Test-4, (PPVT‐4; Dunn & Dunn, 2007), a measure of receptive vocabulary, and the Expressive Vocabulary Test-2 (EVT‐2; Williams, 2007), which measures expressive vocabulary—were administered to each child. In addition, each child completed the “Sounds‐in‐Words” subtest of the Goldman-Fristoe Test of Articulation-2 (GFTA‐2; Goldman & Fristoe, 2000), which measures articulation, and the Test of Early Language Development-3 (TELD‐3; Hresko, Reid, & Hammill, 1999), a measure of expressive and receptive language. All children received a standard score of 85 (16th percentile) or higher on each test, suggesting the absence of concomitant speech and language disorder(s). A multivariate analysis of variance (MANOVA) revealed no significant between-group differences on any of the tests, suggesting that both groups had similar speech and language abilities (see Table 1 for descriptive statistics).
Table A1.
Mean (and standard deviation of the mean) and Test Statistics for the Standardized Speech and Language Tests for Children Who Do (CWS) and Do Not (CWNS) Stutter.
| CWS |
CWNS |
||
|---|---|---|---|
| Tests | Mean (SD) | Mean (SD) | Test Statistics |
| PPVT-4 | 115.45 (13.88) | 118.03 (12.31) | F = 0.57, p = .45 |
| EVT-2 | 115.52 (13.76) | 121.33 (14.27) | F = 2.54, p = .12 |
| GFTA-2 | 108.17 (9.00) | 110.03 (8.56) | F = 0.66, p = .42 |
| TELD-3 | 121.31 (13.88) | 122.97 (12.81) | F = 0.23, p = .64 |
Note. Peabody Picture Vocabulary Test-4 (PPVT-4; Dunn & Dunn, 2007); Expressive Vocabulary Test-2 (EVT-2; Williams, 2007); Goldman-Fristoe Test of Articulation-2 (GFTA-2; Goldman & Fristoe, 2000); Test of Early Language Development-3 (TELD-3; Hresko, Reid, & Hammill, 1999).
2.2.3. Hearing Screening.
The children’s hearing was screened using a Maico® MA25 portable audiometer. Of the 60 children, 59 passed the hearing screen in both ears at 20dB HL for 1000, 2000, and 4000Hz (American Speech-Language-Hearing Association, 1997; Harlor & Bower, 2009), suggesting hearing ability within functional limits. One CWNS refused to complete the hearing screening. This child’s parent, however, did not report any concerns about the child’s hearing and the child had no difficulty understanding instructions. Therefore, this child was included in the study.
2.2.4. Nonverbal Complex Response Inhibition Task.
The Peg-Tapping Task (PTT; Diamond & Taylor, 1996) was used to examine nonverbal complex response inhibition and impulsivity. To complete the PTT, children provided manual responses using a wooden dowel based on two rules that they had to temporarily hold in mind. The first rule specified that when the examiner tapped the dowel once, the child tapped twice. The second rule required the child to tap the dowel once when the examiner tapped twice. Thus, the child had to suppress the dominant response (i.e., imitating the examiner) and instead produce a subdominant response (i.e., the appropriate response based on the rules of the task).
The examiner and the child sat facing each other at a small table, approximately 30 inches apart. The PTT was administered in three phases, as per the procedures of Diamond and Taylor (1996): a demonstration, practice, and main trial. During the demonstration phase, the examiner tapped an 8.85-inch long by 0.98-inch wide wooden dowel on the table once, handed it to the child, and then the child tapped the table one time. Only one dowel was used to prevent the child from concurrently tapping while the examiner was also tapping. After that, the examiner tapped twice and then gave the wooden dowel back to the child to also tap two times. The purpose of the demonstration phase was to ensure that the child could tap the dowel and to establish a dominant response pattern. Next, the practice phase assessed whether the child understood the rules of the task and, therefore, produced sub-dominant responses. During this phase, the examiner instructed the child as follows: “We are going to play a silly game, when I tap one time, I want you to tap two times, and when I tap two times, I want you to tap one time.” The examiner then proceeded to tap the dowel once and gave the dowel to the child to tap twice and vice versa. The examiner praised the child, if he or she tapped correctly, and reminded the child of the rule, if he or she tapped incorrectly. In this latter case, the child was asked to repeat the practice trial again. A child was required to pass two practice trials (one for each rule) consecutively before proceeding to the main trial. If a child got one or both practice trials incorrect, they were presented with additional opportunities for practice until they responded correctly to each rule. The number of practice trials that each child completed were recorded. There was, however, no pre-specified limit to the number of trials required on the task. Finally, during the main phase, the examiner presented the child with 16 fixed randomized trials. Half of the trials involved the examiner tapping two times and for the other half, the examiner tapped once. The child returned the dowel to the examiner, after completing the tapping response for each trial. The entire task was video recorded for scoring and reliability purposes. These video recordings were subsequently uploaded into the Computerized Language Analysis program (MacWhinney, 2000).
2.2.4.1. Scoring.
To measures complex response inhibition, each child’s response was scored as either correct or incorrect and correct responses were subsequently assessed for response latency. In addition, the number of practice trials completed, and the number of extra taps produced, a measure of stopping impulsivity, were recorded. For each trial, a correct tap was given one point and an incorrect tap zero points (e.g., if the examiner tapped once and the child tapped twice, the response was scored as correct; if the child only tapped once, however, then it would have been scored as incorrect). If a child tapped more than two times, the response was scored as incorrect and the number of extra taps was recorded. For example, if the examiner tapped the dowel on the table once, but instead of tapping twice, the child tapped five times, then it was recorded as three extra taps. Response latency, which was measured using the video feature in the Computerized Language Analysis program, for correct responses was calculated from the time the child had control of the dowel to the onset of the child’s first tap which was determined both visually and auditorily.
2.2.4.2. Reliability.
The first author recoded the children’s responses for accuracy, extra taps, and response latency approximately six months after testing was completed to establish intra-rater reliability. A trained research assistant, who was blinded to the purpose of the study, also coded the above variables to determine inter-rater reliability. Twelve children (6 CWS and 6 CWNS), constituting 20% of the total sample, were randomly selected for these analyses, and reliability was measured using the Intra Class Correlation method (ICC; McGraw & Wong, 1996, Eye & Mun, 2005). The intra- and inter-class correlations were 1.0 for response accuracy and 0.99 for extra taps, suggesting excellent agreement. Intra- and inter-rater reliability for response latency was 0.88 (95% CI of 0.85 to 0.91) and 0.87 (95% CI of 0.83 to 0.90), respectively, which represents good-excellent agreement.
2.3. Data Screening and Analyses
Statistical analyses were performed using IBM SPSS Statistics for Windows, Version 26 (Armonk, NY: IBM Corp). Data screening procedures such as skewness, kurtosis, normality, visual inspection of the P-P plots, and outlier assessments preceded the statistical analyses. Results from the data screening for the demographic data showed that chronological age, the ADHD-IV-P total score, and the standardized speech-language tests were normally distributed; other variables (stuttering-like disfluencies and Hollingshead’s Four-Factor Index of Social Position) were not normally distributed. Thus, a combination of parametric (Independent Samples t-Test, MANOVA) and non-parametric (Mann-Whitney U) tests were used to analyze the normally and non-normally distributed measures, respectively.
Three of the four main dependent PTT variables (number of practice trials, response accuracy, and number of extra taps) failed to meet the normality requirement for parametric testing, but no outliers were present. The number of practice trials and extra taps represent count data. Thus, these data were analyzed using a generalized linear model (GLM) with a Poisson probability distribution, as this model can accommodate non-negative count values with no specified upper limit and is appropriate for non-normally distributed data (Zeger, Liang, & Albert, 1988). Response accuracy was also analyzed using a GLM, but with a gamma probability distribution, as this model is appropriate for continuous, non-normally distributed data. PTT response latency was normally distributed for CWNS, but not for CWS. Thus, this data was analyzed using both parametric (analysis of variance [ANOVA]) and nonparametric (Mann-Whitney U test) tests, but since the outcome was the same, only the results of the ANOVA are reported.
To assess whether working memory could have potentially impacted children’s performance on the PTT, we conducted two sets of analyses using nonparametric statistics, as the data were not normally distributed. First, children’s response accuracy on the first and last four trials of the PTT were examined using the Wilcoxon Signed Ranks Tests. We assumed, as did Anderson and Wagovich (2017), that if children had difficulty maintaining the rules in memory over time, they would perform more accurately on the first four trials compared to the last four trials. Second, the relationship between the number of practice trials and response accuracy was explored using Spearman’s rank partial correlations. This relationship was examined under the assumption that if children had difficulty remembering the rules of the task, they would not only perform more poorly (i.e., less accurately), but also require more practice trials (i.e., there would be a negative correlation between the number of practice trials and accuracy on the task; Anderson & Wagovich, 2017; Carlson & Moses, 2001; Montgomery & Koeltzow, 2010).
Chronological age was added as a covariate to all models, except for response latency, as it was moderately correlated with the number of practice trials (r = −.30), response accuracy (r = .37), and the number of extra taps (r = −.32), but not response latency (r = −.05) for both groups of children.2 For the CWS group, chronological age was moderately to highly correlated with the number of practice trials (r = −.38), response accuracy (r = .46), and the number of extra taps (r = −.49), but not response latency (r = .23. There were no significant correlations between chronological age and any of the dependent variables for the CWNS. To assess the strength of difference between and within the groups, the effect size indicator, beta coefficient (β) or partial eta square (ηp2), was reported. A partial eta square of .01 signifies a “small” effect whereas .06 represents a “medium” effect and .14 a “large” effect (Cohen, 1988). Furthermore, significant interactions (e.g., between group and sex) were followed up with a series of pairwise comparisons.
3. Results
The main objective of this study was to examine nonverbal complex inhibition and impulsivity in preschool CWS and CWNS using the PTT (Diamond & Taylor, 1996), with the number of practice trials, response accuracy, number of extra taps, and response latency as dependent variables. Furthermore, we explored potential sex differences within and between the two groups, as well as the effect of working memory.
3.1. Number of PTT Practice Trials
Practice trials for all participants were analyzed using a GLM with a Poisson distribution, with group as a factor and chronological age in months as a covariate. The omnibus test was not significant, χ2 (4) = 7.18, p = .13, suggesting that the model did not account for an appreciable amount of variance in the number of practice trials. Although the CWS (adjusted M = 2.67, SE = .32) required more practice trials on a descriptive basis than the CWNS (adjusted M = 2.25, SE = .29), the main effect of group was not significant, χ2 (1) = 2.96, p = .09, β = −.35, suggesting that both groups of children required a similar number of practice trials. The main effect of sex (girls: adjusted M = 2.49, SE = .35; boys: adjusted M = 2.41, SE = .25) was also not statistically significant, χ2 (1) = 0.31, p = .86, β = −.15, and there was no significant group by sex interaction, χ2 (1) = 1.12, p = .29 (see Table 2). However, the covariate, chronological age, was significant, χ2 (1) = 4.29, p = .04, β = −.02, indicating that age accounted for a significant amount of the variance, with the younger children requiring more practice trials than the older children.
Table A2.
Adjusted Mean (and standard error of the mean) of PTT Variables for Boys and Girls Who Do (CWS) and Do Not (CWNS) Stutter.
| CWS |
CWNS |
|||
|---|---|---|---|---|
| Boys |
Girls |
Boys |
Girls |
|
| PTT Variables | M (SE) | M (SE) | M (SE) | M (SE) |
| Practice Trials | 2.88 (.38) | 2.47 (.49) | 2.02 (.32) | 2.51 (.50) |
| Response Accuracy | 8.29 (.75) | 12.65 (1.61) | 12.23 (1.10) | 12.78 (1.62) |
| Extra Taps | 7.16 (.61) | 1.49 (.36) | 1.86 (.30) | 1.21 (.33) |
| Response Latency | 1076.13 (61.99) | 1062.64 (77.29) | 895.84 (54.65) | 852.74 (81.96) |
3.2. PTT Response Accuracy
A GLM with a gamma distribution was used to analyze the response accuracy of the 30 CWS and 30 CWNS, with group and sex as factors, and chronological age in months as a covariate. The omnibus test was significant, χ2 (4) = 16.86, p = .002, suggesting that the model accounted for a significant amount of the variance in the number of accurate responses. The main effect of group was significant, χ2 (1) = 9.23, p = .002, β = .39 (see Figure A1); the CWS (adjusted M = 10.24, SE = .80) were less accurate than the CWNS (adjusted M = 12.50, SE = .97). The main effect of sex (girls: adjusted M = 12.71, SE = 1.14; boys: adjusted M = 10.07, SE = .64) was also significant, χ2 (1) = 7.28, p = .007, β =.42 (see Figure A2), as was the main effect of the covariate, chronological age, χ2 (1) = 9.08, p = .003, β =.02, suggesting that boys performed less accurately on the task than girls and older children were more accurate than younger children. However, the interaction between group and sex was not statistically significant, χ2 (1) = 2.95, p = .09.
Figure A1.
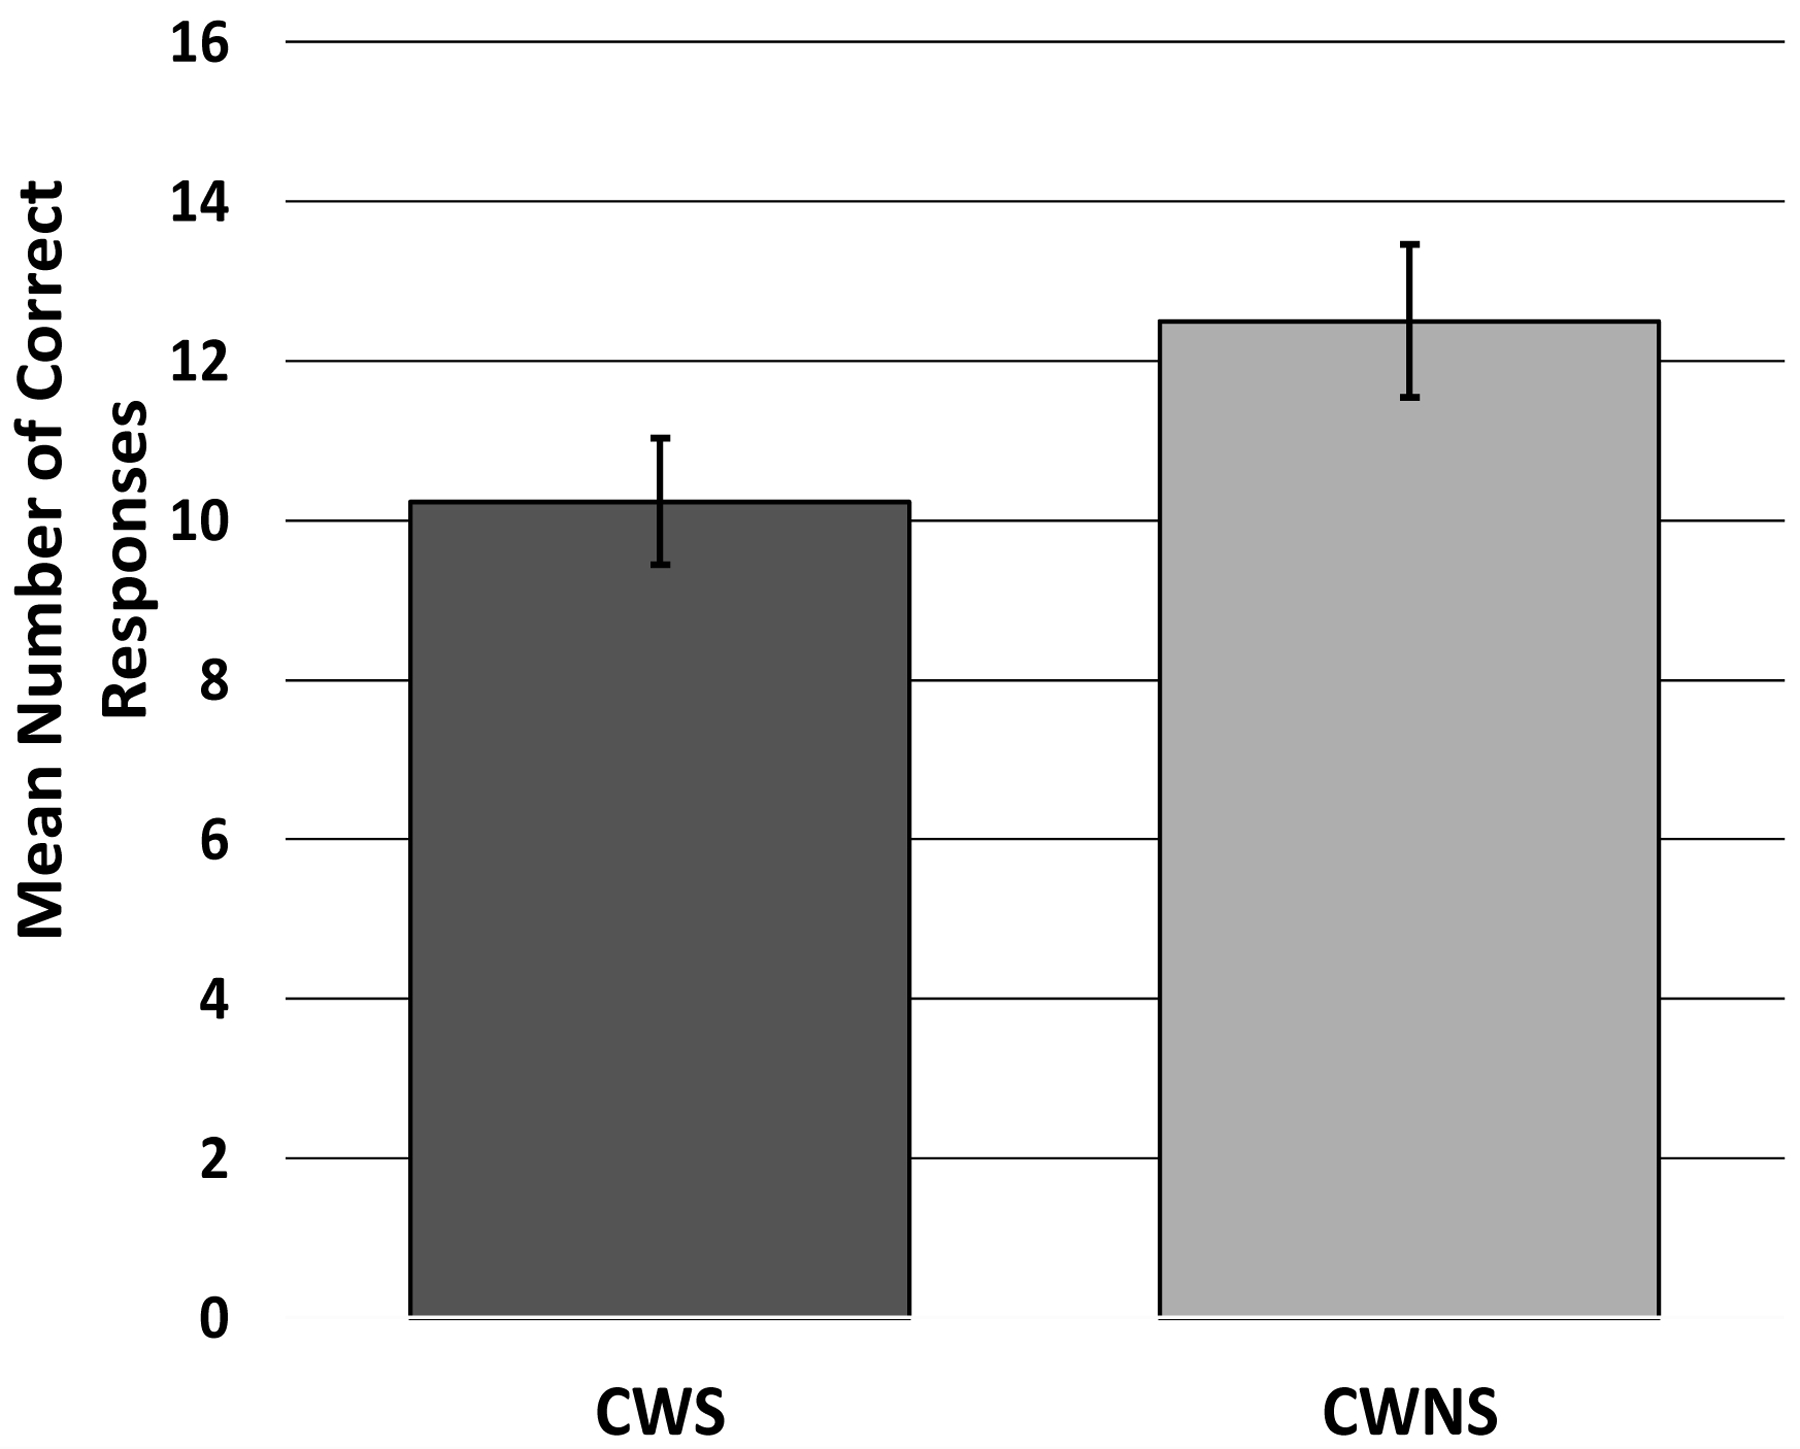
Adjusted Mean (and standard error of the mean) Number of Correct Responses for CWS and CWNS on the Peg-Tapping Task (PTT).
Figure A2.
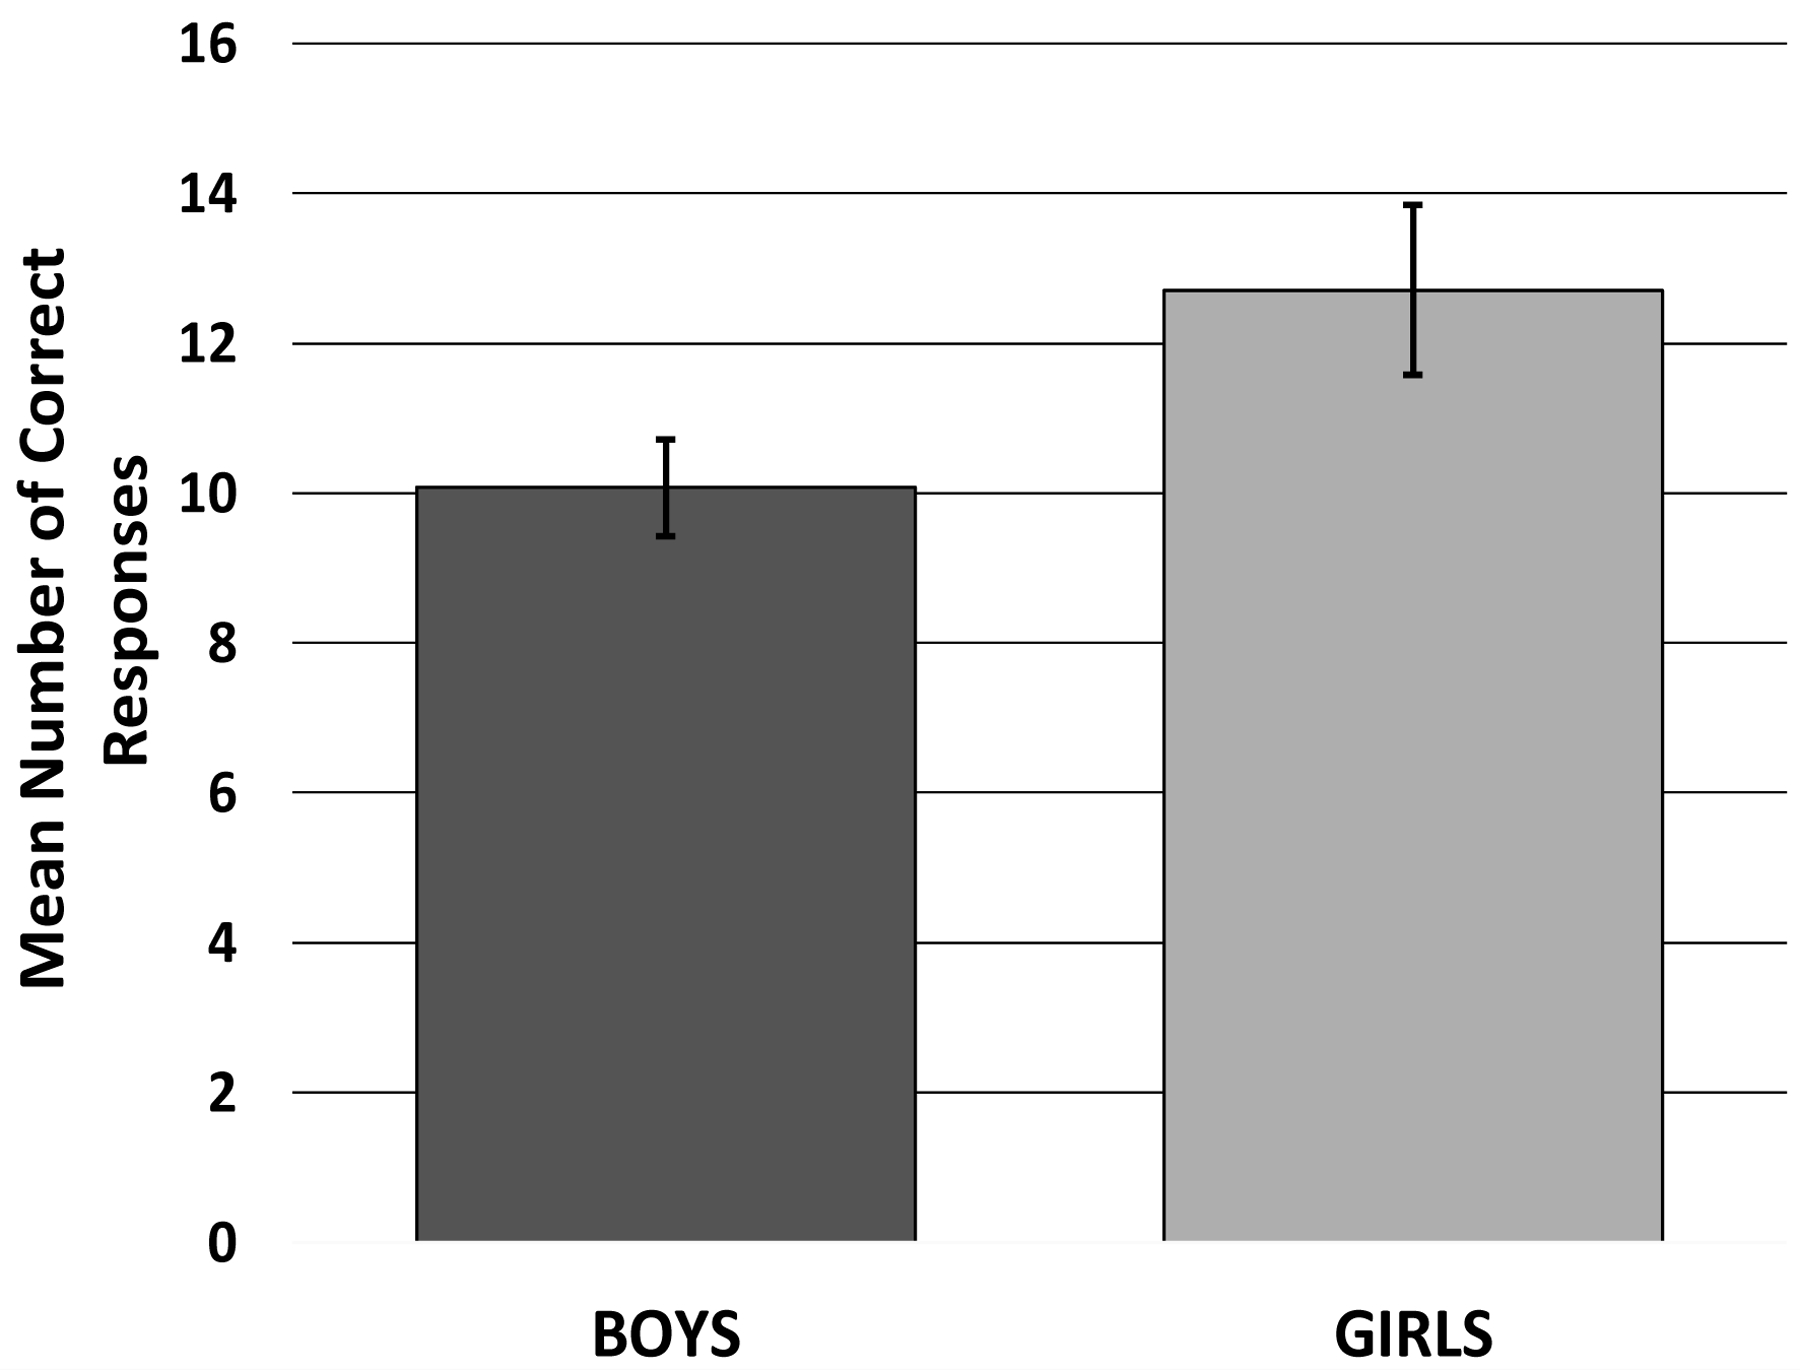
Adjusted Mean (and standard error of the mean) Number of Correct Responses for Boys and Girls on the Peg-Tapping Task.
3.3. PTT Extra Taps
A total of 19 (63%) CWS and 14 (47%) CWNS produced extra taps during one or more of the main trials, while 11 (37%) CWS and 16 (53%) CWNS did not. A chi-square analysis showed no significant difference between the number of CWS and CWNS who did and did not produce extra taps, χ2 (1) = 1.68, p = .19. Similarly, 24 (60%) boys and 9 (45%) girls produced extra taps, whereas 16 (40%) boys and 11 (55%) girls did not, differences which were also not significant, χ2 (1) = 1.21, p = .27.
The 19 CWS and 14 CWNS who produced extra taps were similar in chronological age (CWS: M = 47.37, SD = 8.83; CWNS: M = 49.14, SD = 9.65), t(31) = −.55, p = .59, and SES (CWS: Mdn = 55.50, M rank 17.82; CWNS: Mdn = 46.50, M rank = 15.89), z = .56, p = .57. There was also no significant difference between the two groups of children in their performance on the speech and language tests, F (4, 27) = 1.66, p = .19, and the total ADHD-IV-P score (CWS: M = 11.95, SD = 7.75; CWNS: M = 11.86, SD =7.21), t(31) = .03, p = .97. Similarly, there were no significant differences between the boys and girls in chronological age (Boys: M = 49.50, SD = 9.65; Girls: M = 44.44, SD = 6.43), t(31) = 1.45, p = .16, SES (Boys: Mdn = 54.25, M rank = 17.08; Girls: Mdn = 48.0, M rank = 16.78), z = −.08, p = .94, speech and language test performance, F (4, 27) = 1.34, p = .28, and the total ADHD-IV-P score (Boys: M = 11.88, SD = 8.13; Girls: M = 12.0, SD = 5.43), t(31) = −.04, p = .97.
A GLM with a Poisson distribution was used to analyze the number of extra taps produced by these children, with chronological age as a covariate and both group and sex as factors. The omnibus test was significant, χ2 (4) = 146.05, p < .01, suggesting that the model accounted for a significant amount of variance in the number of extra taps produced. The main effect of group was significant, χ2 (1) = 58.05, p < .001, β = −1.35, as was the main effect of sex, χ2 (1) = 39.23, p < .001, β = −1.57. As shown in Figure A3, the CWS produced an excessive number of taps relative to the CWNS and the boys from both groups collectively generated more taps than the girls. On an individual subject basis, 9 CWNS and 7 CWS had 1 or 2 extra taps, 2 CWNS and 4 CWS had 3 to 5 extra taps, and 2 CWNS and 4 CWS had 6 to 9 extra taps, and 1 CWNS and 4 CWS had more than 10 extra taps. The covariate, chronological age, was also significant, χ2 (1) = 36.54, p < .001, β = −1.57; the younger children produced more extra taps than the older children.
Figure A3.
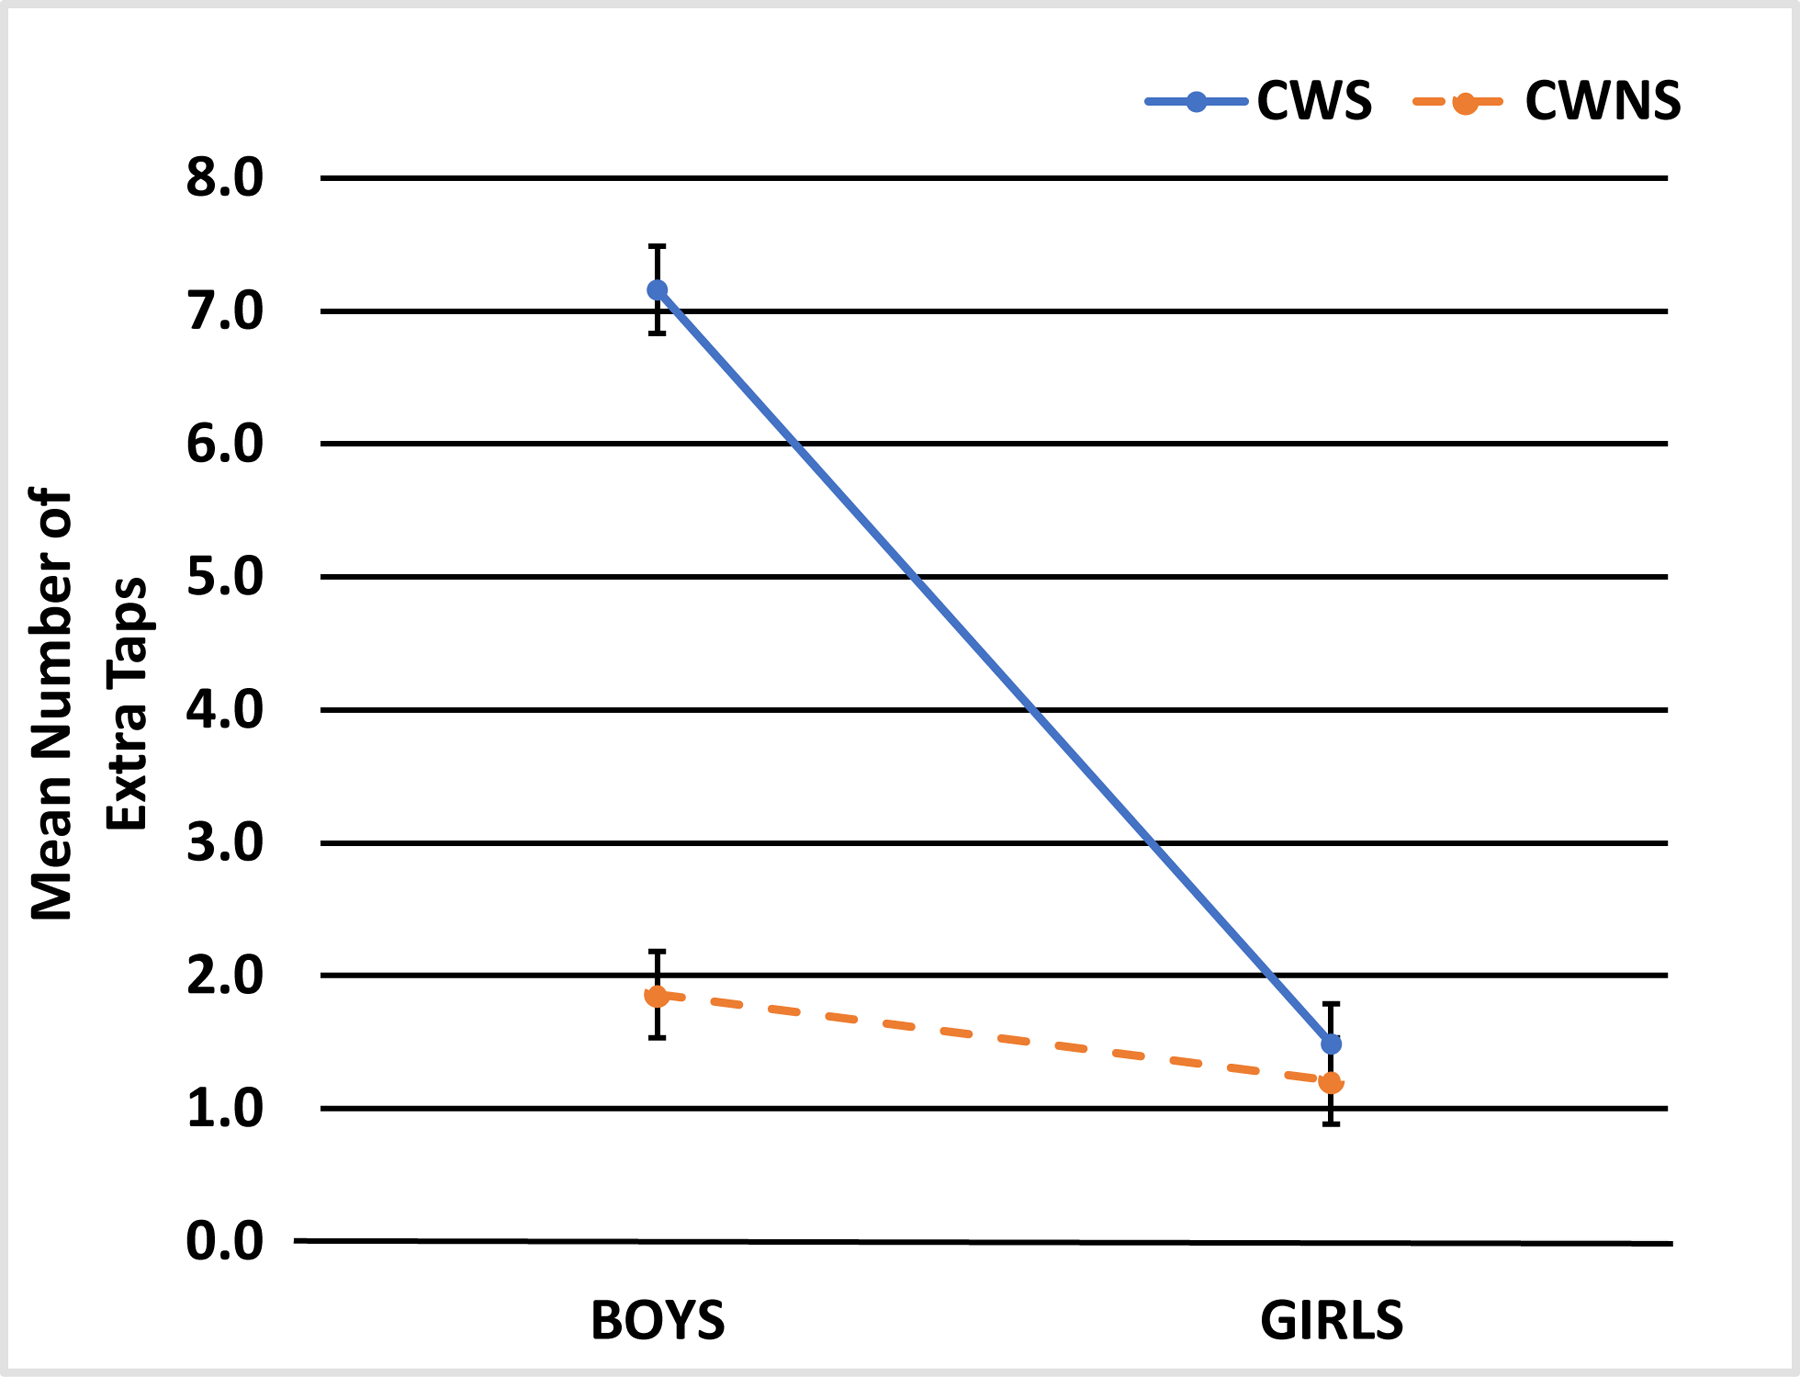
Adjusted Mean (and standard error of the mean) Number of Extra Taps for CWS and CWNS, and Boys and Girls on the Peg-Tapping Task.
The interaction between group and sex was significant, χ2 (1) = 8.21, p = .004. Follow-up pairwise comparisons with Bonferroni correction revealed a significant difference between boys and girls in the CWS group, p < .001, with the boys having more extra taps than the girls (see Table 2). A similar pattern was observed in the group of CWNS, but the difference was not statistically significant, p = .80. The CWS boys also produced significantly more extra taps than the CWNS boys, p < .001, but there were no differences between the two groups of girls, p = .99.
Given the significant main effects of group and sex, Spearman rank partial correlation coefficients, with chronological age as the covariate, were used to determine the relationship between the number of extra taps and both response accuracy and latency for the two groups of children (CWS: n 19; CWNS: n = 14) and sex. The analyses showed significant negative correlations between the number of extra taps and accuracy for both the CWS (r = −.54, p < .01) and CWNS (r = −.44, p = .03). The correlations between the number of extra taps and accuracy for boys (r = −.49, p < .01) and girls (r = −.59, p = .02) were also significant. Furthermore, there was a significant positive correlation between the number of extra taps and response latency for the CWNS (r = .40, p = .04), but not for the CWS (r = .20, p = .36).
3.4. PTT Response Latency
Participants who failed to respond accurately to at least seven (43.75%) out of 16 trials were excluded from the analysis, resulting in the removal of 7 CWS and 4 CWNS. This was done to ensure that each child had a sufficient number of responses for meaningful analysis (e.g., a response latency based on seven or more trials is a better representation of the child’s performance than one or two trials; Anderson & Wagovich, 2017; Catts, Gillispie, Leonard, Kail, & Miller, 2002; Karalunas, Huang-Pollock, & Nigg, 2013; Nardini, Bales, & Mareschal, 2016). Next, response latencies that were two standard deviations above or below the means for each group of children were considered outliers and removed from the data corpus, a standard practice in RT studies (see Ratcliff, 1993). This resulted in the removal of 3.33% (16 out of 480) of the trials from the CWS group and 4.38% (21 out of 480) from the CWNS group (all were more than two standard deviations above their respective group mean).
The final corpus of 23 CWS (14 boys) and 26 CWNS (18 boys) were comparable in chronological age (CWS: M = 52.35, SD = 9.73; CWNS: M = 51.96, SD = 10.15), t(47) = 0.14, p = .89, and SES (CWS: Mdn 50.00, M rank = 24.33; CWNS: Mdn = 54.25, M rank = 25.60), z = - .31, p = .76. There was also no significant difference between the two groups of children in their performance on the speech and language tests, F (4, 44) = 1.33, p = .27, and the total ADHD-IV-P score (CWS: M = 11.86, SD = 8.45; CWNS: M = 11.85, SD = 5.10), t(46) = −.01, p = .99. Similarly, the boys and girls were comparable in chronological age, (Boys: M = 52.59, SD =10.10; Girls: M = 51.29, SD = 9.61), t(47) = .44, p = .67, SES (Boys: Mdn = 55.50, M rank = 27.63; Girls: Mdn = 43.0, M rank = 20.06), z =1.77, p = .08, their overall performance on the speech and language tests, F (4, 27) = .14, p = .97, and the total ADHD-IV-P score (Boys: M = 13.10, SD = 7.19; Girls: M = 9.60, SD = 5.37), t(46) = 1.78, p = .09.
Findings from the ANOVA revealed a significant difference between the two groups, F (1, 47) = 7.80, p = .008, ηp2 = .15 (Figure A4). The CWS and the CWNS had estimated marginal means of 1069.39 (SE = 49.53) and 874.29 (SE = 49.26), respectively, suggesting that the CWS took longer to successfully inhibit the dominant response than the CWNS. The main effect of sex, F (1, 47) = .16, p = .69, ηp2 = .004 (girls: M = 957.69, SE = 56.32; boys: M = 985.99, SE = 41.31), and the interaction between group and sex, F (1, 45) = .05, p = .83, ηp2 = .001, were not statistically significant.
Figure A4.
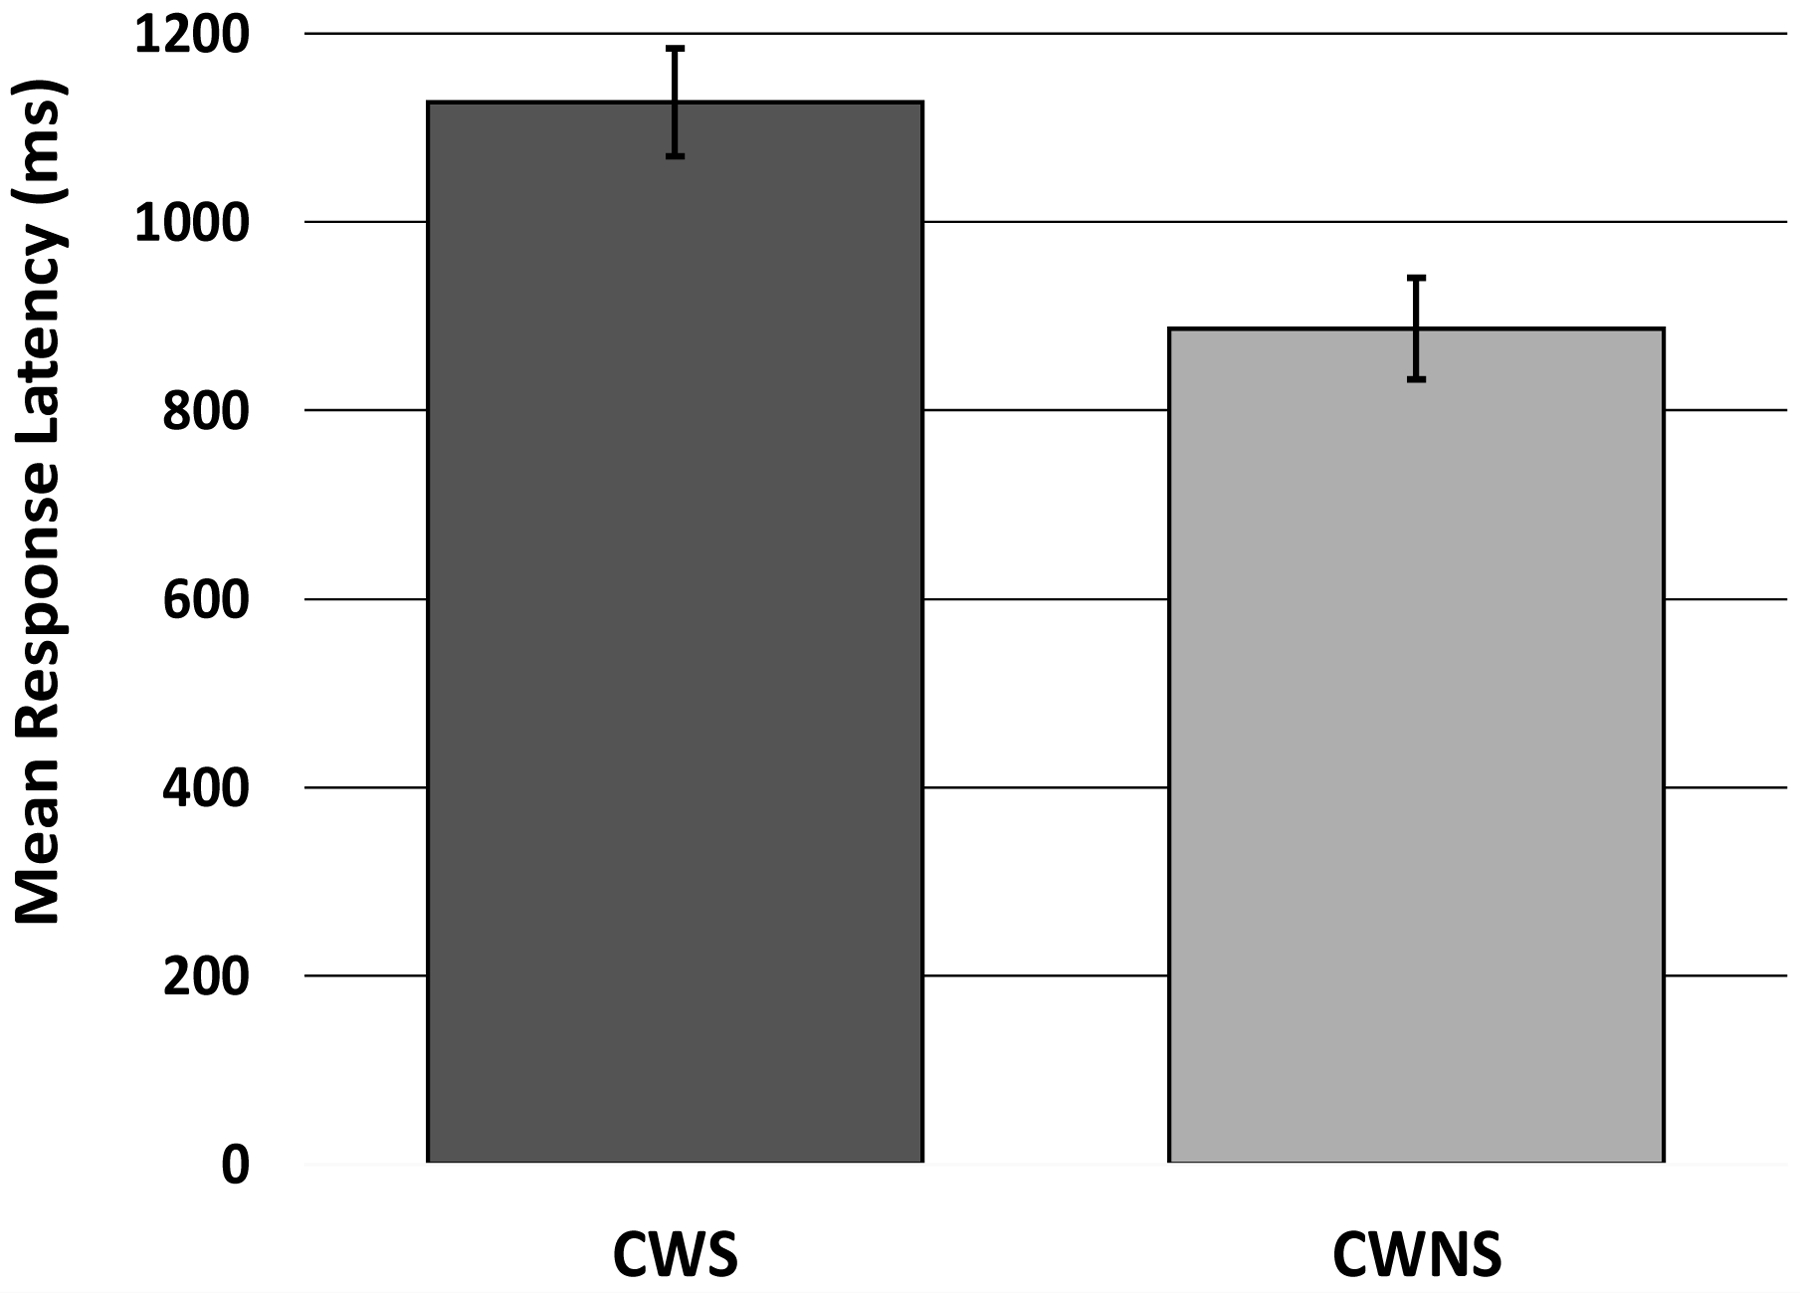
Mean (and standard error of the mean) Response Latency (ms) for CWS and CWNS on the Peg-Tapping Task.
To determine the potential for speed-accuracy trade-offs, Spearman rank partial correlation coefficients, with chronological age as the covariate, were used to examine the association between response latency and accuracy for both groups of children as well as for boys and girls. The analyses showed a significant negative correlation between response latency and accuracy for the CWNS (r = −.51, p < .01), but not the CWS (r = −.13, p = .57). In terms of sex, there was a significant negative association between response latency and accuracy for the boys (r = −.48, p < .01), but not for the girls (r = −.19, p = .47). Thus, these findings indicate that children, regardless of group or sex, were not sacrificing speed for accuracy.
3.5. Potential Effects of Working Memory on Children’s Performance
The potential effects of working memory on children’s performance were examined by analyzing the first and last four trials of the PTT, as well as the association between the number of practice trials and response accuracy. For the CWS, a Wilcoxon signed ranks test revealed a significant difference between the first four (M = 3.10; SD = 1.06) and last four (M = 2.07; SD = 1.46) trials on the PTT, z = - 3.45, p < .01. Likewise, for the CWNS, the difference between the first four (M = 3.67; SD = .55) and last four (M = 2.62; SD = 1.19) trials was significant, z = −3.91, p < .01. Spearman’s rank partial correlations, with chronological age as a covariate, revealed a non-significant correlation between the number of practice trials and response accuracy for the CWS (r = −.05, p = .81). The relationship between the number of practice trials and response accuracy was, however, significant for the CWNS (r = −.40, p = .03).
4. Discussion
In the childhood stuttering literature, some investigators have suggested that there may be an association between disinhibition, impulsivity, and childhood stuttering (Anderson & Wagovich, 2017; Eggers et al., 2013). In the present study, we extended this literature by examining complex nonverbal response inhibition and stopping impulsivity in preschool CWS and CWNS. We also explored biological sex differences across, between, and within the groups. Three main findings emerged from this study: (a) the CWS performed less accurately and more slowly on the PTT than the CWNS, (b) the CWS, especially boys, produced more extra taps than the CWNS, and (c) the girls outperformed the boys on the PTT in accuracy and extra taps, but not response latency. What follows is further discussion of these findings.
4.1. Response Accuracy and Latency
The results revealed that the CWS were significantly less accurate and slower on the PTT than the CWNS. The CWS also required more practice trials than the CWNS, but this difference was not statistically significant. These findings generally confirm the first hypothesis and are consistent with the findings of Anderson and Wagovich (2017), who also examined complex response inhibition and found differences between CWS and CWNS in the verbal domain. The present study extends these findings to include the nonverbal domain. That is, CWS, as a group, are not only less effective and efficient in their ability to suppress a dominant response while executing a conflicting response in the verbal domain (Anderson & Wagovich), but also the nonverbal domain. This suggests that CWS have domain-general weaknesses in complex response inhibition. Although the CWS in the present study were slower to respond than the CWNS, there was no evidence to suggest that they slowed down to increase the accuracy of their responses. This is also consistent with the findings of Anderson and Wagovich, who failed to find any evidence of speed-accuracy trade-offs in CWS and CWNS.
The results of the present study, however, differ from those of several other studies (e.g., Eggers et al., 2018; Eggers & Jansson-Verkasalo, 2017) that failed to find significant differences between CWS and CWNS in inhibition. These differences in findings may be attributed to, at least, three factors. First, in the present study, the participants were preschool-aged children, whereas the participants in the other studies were school-age children. Given that response inhibition tends to improve and become more integrated as children grow older (e.g., Carlson, 2005), it is conceivable that differences between preschool CWS and CWNS in accuracy and/or response latency may diminish over time, such that by the time they get to the school-age years, differences may no longer be present. That is, CWS may initially have difficulty developing inhibition skills, but once acquired, they perform similarly to that of their typically fluent peers (although differences in inhibition have also been found in adults, as noted below). Second, the task used in the present study required the children to produce a conflicting nondominant response whereas the stop-signal task used in these other studies do not (i.e., they measured simple response inhibition). Third, as indicated in the introduction, the children were expected to produce a response on all trials of the PTT and for each trial, the inhibition demands were largely sustained. On the stop-signal task, the children were required to refrain from responding to only some of the trials and after the response had already been initiated. This suggests inherent differences in the degree of inhibition demands between the tasks. In summary, it seems likely that differences in the age of the participants, the complexity of response inhibition, and/or the inhibition demands contributed to the discrepancy in findings.
Chronological age was a significant factor in the number of practice trials needed and the accuracy of responses on the PTT, as the older children required fewer practice trials and were more accurate than the younger children. These age-related findings suggest that the PTT is sensitive to the development of inhibition in preschool children (cf. Bierman, Nix, Greenberg, Blair, & Domitrovich, 2008; Diamond & Taylor, 1996). Furthermore, contrary to what one might expect, there was no relationship between chronological age and response latency for both groups of children, consistent with the findings of Diamond and Taylor. One possible explanation for this latter finding is that to achieve greater accuracy, the older children simply slowed down, resulting in a non-significant association between age and response latency (i.e., there was a speed-accuracy trade-off for the older children). To test this hypothesis, Spearman’s rho correlations between response accuracy and latency were examined for the younger (< 50.50 months) and older children (> 50.50 months). Although the correlation coefficients were moderate for both the younger (r = −.43) and older (r = −.37) children, it was significant only for younger children (p = .04), not the older children (p = .06). Furthermore, there was no significant difference between the younger and older children in response latency, F (1, 47) = .02, p = .89. These findings provide support for the notion that the absence of a significant association between chronological age and response latency was due to a change in the way the older children approached the task.
4.2. Extra Taps
The second main finding was that the CWS produced, on average, a higher number of extra taps compared to the CWNS. This confirms the second hypothesis and suggests that, when compared to CWNS, CWS not only have weaknesses in waiting (Anderson & Ofoe, 2019; Eggers et al., 2013) and greater risk-taking (Blood et al., 2007) impulsivity, but also stopping impulsivity. Of note, while more than half (63%) of the CWS in this study produced extra taps, some CWS (37%) did not, indicating that there may be a subgroup of CWS who have difficulty with stopping impulsivity.
While the CWS produced more extra taps than the CWNS, there was no statistically significant difference in the number of CWS (n = 19) and CWNS (n = 14) who produced extra taps. However, even though this difference was not significant, on a descriptive basis there were still five more CWS than CWNS who had extra taps. Furthermore, of the children who produced extra taps, there were more CWS who produced an excessive number of extra taps compared to the CWNS (8 CWS and 3 CWNS had 6 or more extra taps). Thus, at first glance, these findings might appear inconsistent, but whether the difference in the absolute number of children in the two groups who produce extra taps is significant or not, there are still more CWS that are contributing extra taps, particularly excessive ones, than CWNS. On the other hand, it is possible that children who have more excessive taps have greater difficulty with stopping impulsivity than children who have fewer excessive taps. Thus, the fact that there were more individual CWS who had excessive extra taps than CWNS suggests that these children may have even greater difficulty with stopping impulsivity.
For both groups, children who were less accurate on the PTT produced more extra taps, whereas those who were more accurate had fewer extra taps. In addition, children who were slower on the PTT tended to produce more extra taps, but this relationship was only significant for the CWNS, not the CWS. As will be recalled, the correlation coefficients were moderate-to-large for both groups of children, which suggests that inhibition and impulsivity are related constructs. However, the fact that the correlations were not perfect (i.e., 1.0) indicates that there is some degree of separation between the two constructs.
4.3. Biological Sex Differences
The third main finding showed that the girls were, on average, more accurate and had fewer extra taps on the PTT than the boys, consistent with the third hypothesis. The boys and girls who were less accurate also produced more extra taps than the boys and girls who were more accurate. However, there was no difference in the number of practice trials required and response latency between the boys and girls. There was also no evidence to suggest that the boys and girls were sacrificing speed for accuracy (i.e., no speed-accuracy trade-off effect).
As will be recalled, several investigators have examined biological sex differences in inhibition, finding that boys are less accurate and more impulsive than girls (e.g., Forzano et al., 2011; Olino et al., 2013; Wiebe et al., 2008). Thus, the findings from the present study are consistent with this body of work. There was no significant difference between the boys and girls in response latency. Nevertheless, of the few studies that have examined sex differences in latency on inhibition tasks, most have, like the present study, failed to find differences (Diamond, Kirkham & Amso, 2002; Macdonald, Beauchamp, Crigan, & Anderson, 2014; Williams, Ahern, & Lyon, 2019; cf. MacLeod, 1991). It is not entirely clear why the CWS boys produced significantly more extra taps on the PTT than the CWNS boys, especially since there were no significant group differences between the CWS and CWNS girls and the CWNS boys and girls.3 Nonetheless, as will be recalled, boys tend to be more impulsive than girls (e.g., Størksen et al., 2015). Thus, if CWS have the tendency to be more impulsive than CWNS and boys are more impulsive than girls, then the magnitude of the difference in impulsivity would likely be greater (and statistically significant) for the CWS boys than CWNS boys.
4.4. The Potential Role of Working Memory on the PTT
Given that complex response inhibition tasks involve working memory (Best & Miller, 2010; Garon et al., 2008), we assessed the potential effect of working memory on children’s performance in two ways. First, we examined children’s performance on the first four and last four trials. As previously indicated, if children had difficulty maintaining the rules of the task over time, then we might expect that they would do more poorly on the last four trials of the task than the first four trials (see Anderson & Wagovich, 2017). Both groups of children exhibited this pattern of response. Thus, it is possible that working memory could have influenced children’s performance on the PTT. However, it is also possible that children could have had difficulty maintaining their attention over time. Regardless, it is noteworthy that both groups of children exhibited the same pattern of performance. Therefore, even if working memory and/or attention impacted children’s performance, it is not likely to explain the between-group difference in response accuracy. To further test this assumption, we examined the between group difference in performance on the first four trials of the task using the Mann-Whitney U test. Findings revealed that the CWS were significantly less accurate than the CWNS, z = 2.24, p = .03.4 This suggests that the poorer performance of the CWS on the task cannot be readily attributed to difficulties with working memory and/or attention, for at this point in the task, the rules should be in mind and attention not degraded.
Second, we examined the relationship between the number of practice trials children needed and their accuracy on the PTT. As discussed in Anderson and Wagovich (2017), if children had difficulty remembering the rules of the task, then they would likely require more practice trials and perform more poorly on the task. On the other hand, if they had no difficulty remember the rules, then they would need fewer practice trials and perform more accurately on the task. That there was no significant correlation between the number of practice trials and response accuracy for the CWS suggests that memory did not play a significant role in their performance on the task. The correlation, however, was significant for the CWNS, with poorer performance on the task being associated with more practice and vice versa. This suggests that memory may have played a role in the performance of CWNS. On the other hand, it seems likely that children who have more difficulty with inhibition would also require more practice trials. Thus, the extent to which the correlation between the number of practice trials and response accuracy reflects memory and not inhibition is less than clear. Nevertheless, even if the performance of CWNS was impacted by memory, it is not of significant consequence given that the same was not true of CWS.
In sum, we cannot conclusively rule out the possibility that the poorer performance of the CWS relative to the CWNS on the PTT was due to difficulty with working memory and/or attention. However, it seems unlikely, given that the two groups of children exhibited the same pattern of performance over time and the number of practice trials was not associated with the CWS’s performance on the task.
4.5. Role of Domain-General Processes in Childhood Stuttering
As previously indicated, present findings suggest that CWS are less effective than CWNS in nonverbal complex response inhibition, which together with other studies in the verbal domain (Anderson & Wagovich, 2017), point to limitations in domain-general cognitive processes (i.e., executive function and attention). Cognitive processes are thought to interact with linguistic, sensory, emotional, and motor processes to contribute to the onset and development of stuttering (Conture & Walden, 2012; Smith & Weber, 2017). Indeed, when compared to CWNS, CWS have been reported to have weaknesses in all of these processes (e.g., Anderson & Wagovich, 2010; Conture, 2001; Ntourou, Conture, & Walden, 2013; Ofoe, Anderson, & Ntourou, 2018; Olander, Smith, Zelaznik, 2010; Riley & Riley, 2000). Nevertheless, as of yet, there is no definitive evidence that directly connects any one of these processes to the onset and/or development of stuttering. The question then is, why do CWS have weaknesses in multiple processes and, ultimately, how would they interact or converge to contribute to the development of stuttering? While it is difficult to speculate on the latter, it has been suggested that weaknesses in multiple processes could emerge as a consequence of difficulty with underlying domain-general cognitive processes or vice versa (Anderson & Ofoe, 2019). This possibility stems from the fact that domain-specific processes are connected to and dependent on domain-general cognitive processes (Kronenberger & Pisoni, 2018). Thus, an inefficiency in one domain-specific process (e.g., motor) could have a negative effect on underlying domain-general cognitive processes (e.g., inhibition). This could, in turn, affect other domain specific processes (e.g., linguistic) because these cognitive processes are foundational for all domain specific processes. Alternatively, a primary deficit in underlying domain-general cognitive processes (e.g., inhibition) could directly lead to weaknesses in one or more domain-specific process (e.g., motor, linguistic, etc.). Ultimately, weaknesses in multiple domain-specific and/or - general processes would converge, in some still unknown way, to negatively impact the fluency with which speech is produced.
Another possibility, however, is that children with weaknesses in one or more domain-specific process may need to utilize more cognitive resources for routine tasks, leaving even fewer resources available for more complex tasks (Kronenberger & Pisoni, 2018). Applied to the present study, it is possible that domain-general weaknesses in inhibition leave CWS with even fewer cognitive resources to support the speech-language production system, further increasing their vulnerability to breakdowns in fluency (cf. MacPherson, 2019).
While weaknesses in complex response inhibition and/or stopping impulsivity could, at least theoretically, impact stuttering by virtue of its connection to domain-specific processes or by leaving fewer resources available for speech-language production processes, not all CWS had difficulty with inhibition and impulsivity. Indeed, six out of the 30 CWS, ranging in age from 3;11 to 5;7, received a perfect (16/16) or near perfect (15/16) score on the PTT. Granted, more CWNS (n = 10), many of whom were younger, with ages ranging from 3;2 to 5;8, received perfect to near perfect scores, but the point is that not all CWS had difficulty with the task. This suggests that there may be a subgroup of CWS who have difficulty with inhibition and/or impulsivity and, perhaps, other domain-general processes, as well.
5. Limitations, Future Studies, and Conclusions
This study is the first to examine complex response inhibition in the nonverbal domain in CWS and their typically fluent peers, the findings of which provide further insight into the role of executive function in childhood stuttering. Nevertheless, there are several limitations to this study that warrant consideration. First, we did not control for potential differences in simple motor reaction time between CWS and CWNS. While we could have accomplished this by measuring response latency in a baseline condition where the children tap the dowel once when the examiner taps once and twice when the examiner taps twice, we opted not to do this, as this would have changed the nature of the task. That is, the children would have to respond according to one set of rules (e.g., baseline condition) and then switch to another set of rules (e.g., experimental condition), which requires cognitive flexibility. Thus, the task would no longer be measuring just complex response inhibition (if the baseline condition preceded the experimental condition) or simple reaction time (if the experimental condition preceded the baseline condition), but also cognitive flexibility, thereby compromising the reliability and validity of the tasks (cf. Anderson & Wagovich, 2017). That said, the fact that the CWS were significantly slower than the CWNS on the PTT is not likely to have been a consequence of differences in basic motor reaction time, as such differences have not been found in previous studies (e.g., Anderson & Wagovich, 2017; Anderson, Wagovich, & Ofoe, 2020; Eggers et al., 2012; Eggers et al., 2018).
Second, present findings represent group differences, not individual differences. That is, not all CWS performed in accordance with the larger group of CWS. Some CWS had difficulty with inhibition and impulsivity, whereas others did not. Therefore, findings of weaknesses in inhibition and impulsivity are, perhaps, reflective of a subgroup of CWS rather than all CWS. Furthermore, it is important to note that many of the CWS who participated in this study will likely recover from stuttering. Therefore, we do not know the extent to which these children might differ in their inhibition and impulsivity skills relative to children whose stuttering persists. Future studies are clearly needed to determine if inhibition and impulsivity plays a role in stuttering persistence. That said, differences in inhibition have been reported in the adult literature, with adults who stutter being significantly slower than adults who do not stutter on the stop-signal task (e.g., Markett et al., 2016; Treleaven & Coalson, 2020). This suggests that whatever difficulties CWS have with inhibition may persist into adulthood. Third and finally, although some significant findings were obtained, the sample size for the biological sex analyses, particularly for the girls (10 in each group), was small. As a result, the study may not have been sufficiently powered to detect group by sex interaction effects in some of the analyses. Future studies should, therefore, include a larger sample of boys and girls who stutter, particularly girls, where possible.
In summary, findings from the present study indicate that preschool CWS, as a group, have weaknesses in complex nonverbal response inhibition compared to CWNS. CWS, especially boys, are also more prone to having difficulty with stopping impulsivity. Together with the findings of previous studies, the evidence suggests that CWS not only have difficulties with inhibition and impulsivity in the verbal domain, but also the nonverbal domain, suggesting a domain-general weakness.
Highlights.
Children who stutter were less accurate and slower on the Peg-Tapping Task (Diamond & Taylor, 1996) relative to their typically fluent peers.
Children who stutter may have weaknesses in complex nonverbal response inhibition.
Children who stutter, especially boys, produced more extra taps during the task.
Performance suggests difficulty with stopping impulsivity.
Acknowledgments
This research was supported by a grant awarded to the second author from the National Institute of Deafness and Other Communication Disorders, National Institute of Health (RO1DC012517).
Author Biography
Levi C. Ofoe is a PhD student at Indiana University, Bloomington. His research interests include the study of spoken language production in children who stutter and the nature of stuttering in Bilinguals. He is currently working on his doctoral dissertation.
Julie D. Anderson, Ph.D., CCC-SLP is an Associate Professor at Indiana University and Editor for the Speech section of the Journal of Speech, Language, and Hearing Research. Her research interests include the study of spoken language production, cognitive processes, and fluency development in young children who stutter.
Footnotes
Publisher's Disclaimer: This is a PDF file of an unedited manuscript that has been accepted for publication. As a service to our customers we are providing this early version of the manuscript. The manuscript will undergo copyediting, typesetting, and review of the resulting proof before it is published in its final form. Please note that during the production process errors may be discovered which could affect the content, and all legal disclaimers that apply to the journal pertain.
Disclosure: The authors have declared that no competing interests existed at the time of publication of this manuscript.
The time since stuttering onset for three of the 30 CWS were not included, as their parents were unable to provide an accurate account of when the child first began to stutter.
Correlation coefficients are interpreted based on the guidelines established by Cohen (1988), where coefficients of .10 are small/low, .3 medium/moderate, and .5 large/high.
On a descriptive basis, the CWS girls did have, on average, more extra taps than the CWNS girls and the CWNS girls had fewer extra taps than the CWNS boys. However, the sample size for the girls was small (only 9 girls in total produced extra taps), which likely resulted in insufficient power to achieve statistical significance.
The between-group difference for the last four trials of the task was not significant, z = 1.53, p = .13.
Contributor Information
Levi C. Ofoe, Department of Speech and Hearing Sciences, Indiana University, Bloomington
Julie D. Anderson, Department of Speech and Hearing Sciences, Indiana University, Bloomington
References
- Ahadi SA, Rothbart MK, & Ye RM (1993). Children in the US and China: Different yet the same. European Journal of Personality, 7, 359–377. [Google Scholar]
- Aksan N, & Kochanska G (2004). Links between systems of inhibition from infancy to preschool years. Child Development, 75, 1477–1490. [DOI] [PubMed] [Google Scholar]
- American Speech-Language-Hearing Association. (1997). Guidelines for audiologic screening Rockville, MD: Author. [Google Scholar]
- Anderson JD, & Ofoe LC (2019). The role of executive function in developmental stuttering. Seminars in Speech and Language, 40, 305–319. [DOI] [PMC free article] [PubMed] [Google Scholar]
- Anderson JD, Pellowski MW, Conture EG, & Kelly EM (2003). Temperament characteristics of young children who stutter. Journal of Speech, Language, and Hearing Research, 46, 1221–1233. [DOI] [PMC free article] [PubMed] [Google Scholar]
- Anderson JD, & Wagovich SA (2010). Relationships among linguistic processing speed, phonological working memory, and attention in children who stutter. Journal of Fluency Disorders, 35, 216–234. [DOI] [PMC free article] [PubMed] [Google Scholar]
- Anderson JD, & Wagovich SA (2017). Explicit and implicit verbal response inhibition in preschool-age children who stutter. Journal of Speech, Language, and Hearing Research, 60, 836–852. [DOI] [PMC free article] [PubMed] [Google Scholar]
- Anderson JD, Wagovich SA, & Brown BT (2019). Phonological and semantic contributions to verbal short-term memory in young children with developmental stuttering. Journal of Speech, Language, and Hearing Research, 62, 644–667. [DOI] [PMC free article] [PubMed] [Google Scholar]
- Anderson JD, Wagovich SA, & Ofoe LC (2020). Cognitive flexibility for semantic and perceptual information in developmental stuttering Manuscript submitted for publication. [DOI] [PMC free article] [PubMed] [Google Scholar]
- Bari A, & Robbins TW (2013). Inhibition and impulsivity: Behavioral and neural basis of response control. Progress in Neurobiology, 108, 44–79. [DOI] [PubMed] [Google Scholar]
- Berlin L, Bohlin G, & Rydell A-M (2003). Relations between inhibition, executive functioning, and ADHD symptoms: A longitudinal study from age 5 to 8½ years. Child Neuropsychology, 9, 255–266. [DOI] [PubMed] [Google Scholar]
- Best JR, & Miller PH (2010). A developmental perspective on executive function. Child Development, 81, 1641–1660. [DOI] [PMC free article] [PubMed] [Google Scholar]
- Bezdjian S, Baker LA, Lozano DI, & Raine A (2009). Assessing inattention and impulsivity in children during the Go/NoGo task. British Journal of Developmental Psychology, 27, 365–383. [DOI] [PMC free article] [PubMed] [Google Scholar]
- Bierman KL, Nix RL, Greenberg MT, Blair C, & Domitrovich CE (2008). Executive functions and school readiness intervention: Impact, moderation, and mediation in the Head Start REDI program. Developmental Psychopathology, 20, 821–843. [DOI] [PMC free article] [PubMed] [Google Scholar]
- Blair C (2003). Behavioral inhibition and behavioral activation in young children: Relations with self-regulation and adaptation to preschool in children attending head start. Developmental Psychobiology, 42, 301–311. [DOI] [PubMed] [Google Scholar]
- Blood GW, Blood IM, Maloney K, Weaver A, & Shaffer B (2007). Exploratory study of children who stutter and those who do not stutter on a visual attention test. Communication Disorders Quarterly, 28, 145–153. [Google Scholar]
- Bloodstein O, & Bernstein Ratner N (2008). A Handbook on Stuttering Clifton Park, NY. Thompson/Delmar. [Google Scholar]
- Carlson SM (2005). Developmentally sensitive measures of executive function in preschool children. Developmental Neuropsychology, 28, 595–616. [DOI] [PubMed] [Google Scholar]
- Carlson SM, & Moses LJ (2001). Individual differences in inhibitory control and children’s theory of mind. Child Development, 72, 1032–1053. [DOI] [PubMed] [Google Scholar]
- Carlson SM, Moses LJ, & Breton C (2002). How specific is the relation between executive function and theory of mind? Contributions of inhibitory control and working memory. Infant and Child Development, 11, 73–92. [Google Scholar]
- Carlson SM, & Wang TS (2007). Inhibitory control and emotional regulation in preschool children. Cognitive Development, 80, 489–510. [Google Scholar]
- Catts HW, Gillispie M, Leonard LB, Kail RV, & Miller CA (2002). The role of speed of processing, rapid naming, and phonological awareness in reading achievement. Journal of Learning disabilities, 35, 510–525. [DOI] [PubMed] [Google Scholar]
- Clark CAC, Sheffield TD, Wiebe SA, & Espy KA (2013). Longitudinal associations between executive control and developing mathematical competences in preschool boys and girls. Child Development, 84, 662–677. [DOI] [PMC free article] [PubMed] [Google Scholar]
- Cohen J (1988). Statistical power analysis for the behavioral sciences (2nd ed.). Hillsdale, NJ: Erlbaum. [Google Scholar]
- Conners CK (2002). Conners’ Continuous Performance Test (CPT II) New York: Multi-Health Systems. [Google Scholar]
- Conture EG (2001). Stuttering: Its nature, diagnosis, and treatment. Allyn & Bacon [Google Scholar]
- Conture E, & Walden T (2012). Dual diathesis-stressor model of stuttering. In Bellakova L & Filatova Y (Eds.), Theoretical Issues of Fluency Disorders (pp. 94–127). Moscow, Russia: National Book Centre. [Google Scholar]
- Dalley JW, Everitt BJ, & Robbins TW (2011). Impulsivity, compulsivity, and top-down cognitive control. Neuron, 69, 680–694. [DOI] [PubMed] [Google Scholar]
- Davidson MC, Amso D, Anderson LC, & Diamond A (2006). Development of cognitive control and executive functions from 4 to 13 years: Evidence form manipulations of memory, inhibition, and task switching. Neuropsychologia, 44, 2037–2078. [DOI] [PMC free article] [PubMed] [Google Scholar]
- De Sonneville LMJ (2009). (Amsterdam neuropsychological tasks) Amsterdamse Neuropsychologische Taken Amsterdam: Boom Test Publishers. [Google Scholar]
- Diamond A (2013). Executive functions. Annual Review of Psychology, 64, 135–168. [DOI] [PMC free article] [PubMed] [Google Scholar]
- Diamond A, & Ling DS (2016). Conclusions about interventions, programs, and approaches for improving executive functions that appear justified and those that, despite much hype, do not. Developmental Cognitive Neuroscience, 18, 34–48. [DOI] [PMC free article] [PubMed] [Google Scholar]
- Diamond A, & Taylor C (1996). Development of an aspect of executive control: Development of the abilities to remember what I said and to “do as I say, not as I do”. Developmental Psychobiology, 29, 315–334. [DOI] [PubMed] [Google Scholar]
- Diamond A, Kirkham N, & Amso D (2002). Conditions under which young children can hold two rules in mind and inhibit a prepotent response. Developmental Psychology, 38, 352–262. [PubMed] [Google Scholar]
- Dickman SJ (1990). Functional and Dysfunctional impulsivity: Personality and cognitive correlates. Journal of Personality and Social Psychology, 58, 95–102. [DOI] [PubMed] [Google Scholar]
- Donaher J, & Richels C (2012). Traits of attention deficit/hyperactivity disorder in school-age children who stutter. Journal of Fluency Disorders, 37, 242–252. [DOI] [PubMed] [Google Scholar]
- Dunn L, & Dunn L (2007). Peabody Picture Vocabulary Test- Fourth Edition (PPVT-4) Circle Pines, MN: American Guidance Service, Inc. [Google Scholar]
- Duckworth AL, Gendler TS, Gross JJ (2014). Self-control in school-age children. Educational Psychologist, 49, 199–217. [Google Scholar]
- Druker K, Hennessey N, Mazzucchelli T, & Beilby J (2019). Elevated attention deficits hyperactivity disorder symptoms in children who stutter. Journal of Fluency Disorders, 59, 80–90. [DOI] [PubMed] [Google Scholar]
- Eggers K, & Jansson-Verkasalo E (2017). Auditory attention set-shifting and inhibition in children who stutter. Journal of Speech, Language, and Hearing Research, 60, 3159–3170. [DOI] [PubMed] [Google Scholar]
- Eggers K, De Nil LF, & Van den Bergh BR (2012). The efficiency of attentional networks in children who stutter. Journal of Speech, Language, and Hearing Research, 55, 946–959. [DOI] [PubMed] [Google Scholar]
- Eggers K, De Nil LF, & Van den Bergh BR (2013). Inhibitory control in childhood stuttering. Journal of Fluency Disorders, 38, 1–13. [DOI] [PubMed] [Google Scholar]
- Eggers K, De Nil LF, & Van den Bergh BR (2018). Exogenously triggered response inhibition in developmental stuttering. Journal of Fluency Disorders, 56, 33–44. [DOI] [PubMed] [Google Scholar]
- Eichorn N, Marton K, & Pirutinsky S (2018). Cognitive flexibility in preschool children with and without stuttering disorders. Journal of Fluency Disorders, 57, 37–50. [DOI] [PubMed] [Google Scholar]
- Else-Quest NM, Hyde JS, Goldsmith HH, & Van Hulle CA (2006). Gender differences in temperament: a meta-analysis. Psychological Bulletin, 132, 33–72. [DOI] [PubMed] [Google Scholar]
- Evenden JL (1999). Varieties of impulsivity. Psychopharmacology 146, 348–361. [DOI] [PubMed] [Google Scholar]
- Eye AV, & Mun EY (2005). Analyzing rater agreement: Manifest variable methods New York, NY: Psychology Press. [Google Scholar]
- Fahie CM, & Symons DK (2003). Executive functioning and theory of mind in children clinically referred for attention and behavior problems. Applied Developmental Psychology, 24, 51–73. [Google Scholar]
- Floyd RG, & Kirby EA (2001). Psychometric properties of measures of behavioral inhibition with preschool-age children: Implications for assessment of children at risk for ADHD. Journal of Attention Disorders, 5, 79–91. [Google Scholar]
- Foley M, McClowry SG, Castellanos FX (2008). The relationship between attention deficit hyperactivity disorder and child temperament. Journal of Applied Developmental Psychology, 29, 157–169. [Google Scholar]
- Forzano LB, Michels JL, Carapella RK, Conway P, & Chelonis JJ (2011). Self-control and impulsivity in children: Multiple behavioral measures. The Psychological Record, 61, 425–448. [Google Scholar]
- Friedman NP, & Miyake A (2004). The relations among inhibition and interference cognitive functions: A latent variable analysis. Journal of Experimental Psychology: General, 133, 101–135. [DOI] [PubMed] [Google Scholar]
- Garon N, Bryson SE, & Smith IM (2008). Executive function in Preschoolers: A review using an integrative framework. Psychological Bulletin, 134, 31–60. [DOI] [PubMed] [Google Scholar]
- Gerstadt CL, Hong YJ, & Diamond A (1994). The relationship between cognition and action: Performance of children 3.5–7 years old on a Stroop-like day-night test. Cognition, 53, 129–153. [DOI] [PubMed] [Google Scholar]
- Goldman R, & Fristoe M (2000). Goldman-Fristoe Test of Articulation – Second Edition (GFTA-2) [Measurement instrument] Circle Pines, MN: American Guidance Services, Inc. [Google Scholar]
- Harlor AD Jr., & Bower C (2009). Hearing assessment in infants and children: Recommendations beyond neonatal screening. Pediatrics, 124, 1252–1263. [DOI] [PubMed] [Google Scholar]
- Healey EC, & Reid R (2003). ADHD and stuttering: A tutorial. Journal of Fluency Disorders, 28, 79–93. [DOI] [PubMed] [Google Scholar]
- Hofmann W, Friese M, & Strack F (2009). Impulse and self-control from a dual-systems perspective. Perspectives on Psychological Science, 4, 162–176. [DOI] [PubMed] [Google Scholar]
- Hollingshead A (1975). Four-Factor Index of Social Status New Haven, CT: Yale University. [Google Scholar]
- Hollingshead A (2011). Four factor index of social status. Yale Journal of Sociology, 8, 11–19. [Google Scholar]
- Howard SJ, & Okely AD (2015). Catching fish and avoiding sharks: Investigating factors that influence developmentally appropriate measurements of preschoolers’ inhibitory control. Journal of Psychoeducational Assessment, 33, 585–596. [DOI] [PMC free article] [PubMed] [Google Scholar]
- Hresko W, Reid D, & Hammill D (1999). Test of Early Language Development – Third Edition (TELD-3) Austin, TX: Pro-Ed. [Google Scholar]
- Jones R, Choi D, Conture E, Walden T (2014). Temperament, emotion, and childhood stuttering. Seminars in Speech and Language, 35, 114–131. [DOI] [PMC free article] [PubMed] [Google Scholar]
- Karalunas SL, Huang-Pollock CL, & Nigg JT (2013). Is reaction time variability in ADHD mainly at low frequencies? Journal of Child Psychology and Psychiatry, 54, 536–544. [DOI] [PMC free article] [PubMed] [Google Scholar]
- Kerns KA, McInerney RJ, & Wilde NJ (2001). Time reproduction, working memory, and behavioral inhibition in children with ADHD. Child Neuropsychology, 7, 21–31. [DOI] [PubMed] [Google Scholar]
- Klenberg L, Korkman M, & Lahti-Nuuttila P (2001). Differential development of attention and executive functions in 3-to 12-year-old Finnish children. Developmental Neuropsychology, 20, 407–428. [DOI] [PubMed] [Google Scholar]
- Kochanska G (2002). Committed compliance, moral self, and internalization: A mediational model. Developmental Psychology, 38, 339–351. [DOI] [PubMed] [Google Scholar]
- Kochanska G, Coy KC, & Murray KT (2001). The development of self-regulation in the first four years of life. Child Development, 72, 1091–1111. [DOI] [PubMed] [Google Scholar]
- Kochanska G, Murray KT, & Harlan ET (2000). Effortful control in early childhood: Continuity and change, antecedents, and implications for social development. Developmental Psychology, 36, 220–232. [PubMed] [Google Scholar]
- Kochanska G, Murray K, Jacques TY, Koenig A L, & Vandegeest KA (1996). Inhibitory control in young children and its role in emerging internationalization. Child Development, 67, 490–507. [PubMed] [Google Scholar]
- Kochanska G, Tjebkes T, & Forman D (1998). Children’s emerging regulation of conduct: Restraint, compliance, and internalization from infancy to the second year. Child Development, 69, 1378–1389. [PubMed] [Google Scholar]
- Kronenberger WG, & Pisoni DB (2018). Neurocognitive functioning in deaf children with cochlear implants. In Knoors H & Marschark M (Eds.), Evidence-Based Practice in Deaf Education (363–396). New York: Oxford University Press [Google Scholar]
- Lipsey MW, Nesbitt KT, Farran DC, Dong N, Fuhs MW, & Wilson SJ (2017). Learning-related cognitive self-regulation measures for prekindergarten children: A comparative evaluation of the educational relevance of selected measures. Journal of Educational Psychology, 109, 1084–1102. [Google Scholar]
- Logan GD, & Cowan WB (1984). On the ability to inhibit thought and action – A theory of an act of control. Psychological Review, 91, 295–327. [DOI] [PubMed] [Google Scholar]
- Logan GD, Van Zandt T, Verbruggen F, & Wagemakers E-J. (2014). On the ability to inhibit thought and action: General and special theories of an act of control. Psychological Review, 121, 66–95. [DOI] [PubMed] [Google Scholar]
- Logue AW, & Chavarro A (1992). Self-control and impulsiveness in preschool children. The Psychological Record 42, 189–204. [Google Scholar]
- Lum JAG, Ullman MT, & Conti-Ramsden G (2015). Verbal declarative memory impairments in specific language impairment are related to working memory deficits. Brain Language, 142, 76–85. [DOI] [PMC free article] [PubMed] [Google Scholar]
- Luria AR (1966). Higher cortical functions in man New York: Basic Books. [Google Scholar]
- Macdonald JA, Beauchamp MH, Crigan JA, & Anderson PJ (2014). Age-related differences in inhibitory control in the early school years. Child Neuropsychology, 20, 509–526. [DOI] [PubMed] [Google Scholar]
- MacLeod CM (1991). Half a century of research on the Stroop effect: An integrative review. Psychological Bulletin, 109, 163–203. [DOI] [PubMed] [Google Scholar]
- MacPherson MK (2019). Cognitive load affects speech motor performance differently in older and younger adults. Journal of Speech, Language, and Hearing Research, 62, 1258–1277. [DOI] [PubMed] [Google Scholar]
- MacWhinney B (2000). The CHILDES Project: Tools for analyzing talk. Vol. 2: The Database (3rd edition). Mahwah, NJ: Lawrence Erlbaum Associates. [Google Scholar]
- Markett S, Bleek B, Reuter M, Prüss H, Richardt K, Müller T, Yaruss JS, & Montag C (2016). Impaired motor inhibition in adults who stutter - Evidence from speech free stop-signal reaction time tasks. Neuropsychologia, 91, 444–450. [DOI] [PubMed] [Google Scholar]
- Marton K (2008). Visuo-spatial processing and executive functions in children with specific language impairment. International Journal of Language and Communication Disorders, 43, 181–200. [DOI] [PMC free article] [PubMed] [Google Scholar]
- Marton K, Campanelli L, Scheuer J, Yoon J, & Eichorn N (2012). Executive function profiles in children with and without specific language impairment. Rivista di Psicolinguistica Applicata, 12, 57–73. [PMC free article] [PubMed] [Google Scholar]
- McGoey KE, DuPaul GJ, Haley E, & Shelton TL (2007). Parent and teacher ratings of attention-deficit/hyperactivity disorder in preschool: The ADHD rating scale-IV preschool version. Journal of Psychopathological and Behavioral Assessment, 29, 269–276. [Google Scholar]
- McGraw KO, & Wong SP (1996). Forming inferences about some intraclass correlation coefficients. Psychological Methods, 1, 30–46. [Google Scholar]
- Montgomery DE, & Koeltzow TE (2010). A review of the day-night task: The Stroop paradigm and interference control in young children. Developmental Review, 30, 308–330. [Google Scholar]
- Nardini M, Bales J, & Mareschal D (2016). Integration of audio-visual information for spatial decisions in children and adults. Developmental Science, 19, 803–816. [DOI] [PubMed] [Google Scholar]
- Nigg JT (2017). Annual Research Review: On the relations among self-regulation, self-control, executive functioning, effortful control, cognitive control, impulsivity, risk-taking, and inhibition for developmental psychopathology. The Journal of Child Psychology and Psychiatry, 58, 361–383. [DOI] [PMC free article] [PubMed] [Google Scholar]
- Ntourou K, Conture EG, & Walden TA (2013). Emotional reactivity and regulation in preschool-age children who stutter. Journal of Fluency Disorders, 38, 260–274. [DOI] [PMC free article] [PubMed] [Google Scholar]
- Ofoe LC, Anderson JD, & Ntourou K (2018). Short-term memory, inhibition, and attention in developmental stuttering: A Meta-Analysis. Journal of Speech, Language, and Hearing Research, 13, 1626–1648. [DOI] [PMC free article] [PubMed] [Google Scholar]
- Olander L, Smith A, & Zelaznik HN (2010). Evidence that a motor timing deficit is a factor in the development of stuttering. Journal of Speech, Language, and Hearing Research, 53, 876–886. [DOI] [PMC free article] [PubMed] [Google Scholar]
- Olino TM, Durbin CE, Klein DN, Hayden EP, & Dyson MW (2013). Gender differences in young children’s temperament traits: Comparisons across observational and parent-report methods. Journal of Personality, 81, 119–129. [DOI] [PMC free article] [PubMed] [Google Scholar]
- Olson SL, Schilling EM, & Bates JE (1999). Measurement of impulsivity: Construct coherence, longitudinal stability, and relationship with externalizing problems in middle childhood and adolescence. Journal of Abnormal Child Psychology, 27, 151–165. [DOI] [PubMed] [Google Scholar]
- Patros CHG, Alderson RM, Kasper LJ, Tarle SJ, Lea SE, & Hudec KL (2016). Choice-impulsivity in children and adolescents with attention-deficit/hyperactivity disorder (ADHD): A meta-analytic review. Clinical Psychology Review, 43, 162–174. [DOI] [PubMed] [Google Scholar]
- Petersen IT, Hoyniak CP, McQuillan ME, Bates JE, & Staples AD (2016). Measuring the development of inhibitory control: The challenge of heterotypic continuity. Developmental Review, 40, 25–71. [DOI] [PMC free article] [PubMed] [Google Scholar]
- Piispala J, Määtä S, Pääkkönen A, Bloigu R, Kallio M, & Jansson-Verkasalo E (2017). Atypical brain activation in children who stutter in a visual Go/NoGo task: An ERP study. Clinical Neuropsychology, 128, 194–203. [DOI] [PubMed] [Google Scholar]
- Piispala J, Kallio M, Bloigu R, & Jansson-Verkasalo E (2016). Delay N2 response in Go condition in a visual Go/NoGo ERP study in children who stutter. Journal of Fluency Disorders, 48, 16–26. [DOI] [PubMed] [Google Scholar]
- Ratcliff R (1993). Methods for dealing with reaction time outliers. Psychological Bulletin, 114, 510–532. [DOI] [PubMed] [Google Scholar]
- Rhoades BL, Greenberg MT, & Domitrovich CE (2009). The contribution of inhibitory control to preschoolers’ social-emotional competence. Journal of Applied Developmental Psychology, 30, 310–320. [Google Scholar]
- Riley GD (2009). Stuttering Severity Instrument- 4 Pro-Ed, Austin, TX. [Google Scholar]
- Riley J, & Riley JG (2000). A revised component model for diagnosing and treating children who stutter. Contemporary Issues in Communication Science and Disorders, 27, 188–199. [Google Scholar]
- Robbins TW & Dalley JW (2017). Impulsivity, risky choice, and impulse control disorders: animal models. In Dreyer J-L & Tremblay L, (Eds.), Decision Neuroscience (pp. 81–93). Elsevier, San Diego, CA [Google Scholar]
- Robinson ES, Eagle DM, Economidou D, Theobald DE, Mar AC, Murphy ER, Robbins TW, & Dalley JW (2009). Behavioral characterization of high impulsivity on the 5-choice serial reaction time task: specific deficits in ‘waiting’ versus ‘stopping’. Behavioral Brain Research, 196, 310–316. [DOI] [PubMed] [Google Scholar]
- Smith A, & Weber C (2017). How stuttering develops: The multifactorial dynamic pathways theory. Journal of Speech, Language, and Hearing Research, 60, 2483–2505. [DOI] [PMC free article] [PubMed] [Google Scholar]
- Størksen I, Ellingsen IT, Wanless SB, & McClelland MM (2015). The influence of parental socioeconomic background and gender on self-regulation among 5-year-old children in Norway. Early Education and Development, 26, 663–684. [Google Scholar]
- Strayhorn JM (2002). Self-control: Theory and Research. Journal of the American Academy of Child and Adolescent Psychiatry, 41, 7–16. [DOI] [PubMed] [Google Scholar]
- Treleaven SB, & Coalson GA (2020). Manual response inhibition and quality of life in adults who stutter. Journal of Communication Disorders, 88, 106053. [DOI] [PMC free article] [PubMed] [Google Scholar]
- Verbruggen F, & Logan GD (2008). Automatic and controlled response inhibition: Associative learning in the go/no-go and stop-signal paradigms. Journal of Experimental Psychology: General, 137, 649–672. [DOI] [PMC free article] [PubMed] [Google Scholar]
- Verbruggen F, Logan GD, & Stevens MA (2008). Stop-it: Windows executable software for the stop-signal paradigm. Behavior Research Methods, 40, 479–483. [DOI] [PubMed] [Google Scholar]
- Wessel JR (2016). Prepotent motor activity and inhibitory control demands in different variants of the go/no-go paradigm. Psychophysiology, 55, 1–14. [DOI] [PubMed] [Google Scholar]
- Wiebe SA, Espy KA, & Charak D (2008). Using confirmatory factor analysis to understand executive control in preschool children: Latent structure. Developmental Psychology, 44, 575–587. [DOI] [PubMed] [Google Scholar]
- Wiebe SA, Sheffield T, & Espy KA (2012). Separating the fish form the sharks: A longitudinal study of preschool response inhibition. Child Development, 83, 1245–1261. [DOI] [PMC free article] [PubMed] [Google Scholar]
- Wiebe SA, Sheffield T, Nelson JM, Clark CAC, Chevalier N, & Espy KA (2011). The structure of executive function in 3-years olds. Journal of Experimental Child Psychology, 108, 436–452. [DOI] [PMC free article] [PubMed] [Google Scholar]
- Williams KT (2007). Expressive Vocabulary Test-Second Edition (EVT-2) Circle Pines, MN: American Guidance Service, Inc. [Google Scholar]
- Williams S, Ahern E, & Lyon TD (2019). The relation between young children’s false statements and response latency, executive functioning, and truth-lie understanding. Merrill-Palmer Quarterly, 65, 81–100. [DOI] [PMC free article] [PubMed] [Google Scholar]
- Willoughby MT, Kupersmidt J, & Voegler-Lee M (2012). Is preschool executive function causally related to academic achievement? Child Neuropsychology, 18, 79–91. [DOI] [PMC free article] [PubMed] [Google Scholar]
- Wolfe CD, & Bell MA (2003). Working memory and inhibitory control in early childhood: Contributions from physiology, temperament, and language. Developmental Psychology, 44, 68–83. [DOI] [PubMed] [Google Scholar]
- Yairi E, & Seery CH (2015). Stuttering: Foundations and Clinical Applications (2nd Ed.). Pearson. New Jersey. [Google Scholar]
- Zeger SL, Laing KY, & Albert PS (1988). Models for longitudinal data: a generalized estimating equations approach. Biometrics, 44, 1049–1060. [PubMed] [Google Scholar]