



Abstract
Background:
Numerous studies suggest that some phthalates have adverse reproductive effects. However, literature on the association between phthalates and incidence of uterine leiomyomata (UL) is limited and inconsistent, with no existing prospective studies.
Objectives:
We examined the association of urinary concentrations of phthalate and phthalate alternative biomarkers with UL incidence.
Methods:
We conducted a case-cohort analysis within a subgroup of 754 participants in the Study of the Environment, Lifestyle, and Fibroids (SELF), a prospective cohort of premenopausal Black women aged 23-35 years who were recruited during 2010-2012. We quantified fourteen phthalates and two phthalate alternative [1,2-cyclohexane dicarboxylic acid, diisononyl ester (DINCH)] biomarkers in urine collected at baseline, 20 months, and 40 months. Transvaginal ultrasounds identified UL at baseline and every 20 months during 60 months of follow-up. We evaluated the individual biomarkers, molar sum of di(2-ethylhexyl) phthalate [ΣDEHP] and potency-weighted sum of anti-androgenic [WΣAA] biomarkers. We used Cox proportional hazards regression to estimate adjusted hazard ratios (HRs) and 95% confidence intervals (CIs) for the association between biomarkers and UL incidence. We then used quantile g-computation to examine joint associations of multiple phthalate biomarkers with UL incidence.
Results:
Most individual biomarkers showed weak-to-moderate inverse associations with UL incidence. HRs comparing highest vs. lowest quartiles of mono-isobutyl phthalate (MiBP) and mono-hydroxyisobutyl phthalate (MHiBP) concentrations were 0.74 (95% CI: 0.46, 1.17) and 0.65 (95% CI: 0.41, 1.03), respectively. Inverse associations for specific phthalates were stronger among women with BMI ≥30 kg/m2. HRs comparing detectable vs. nondetectable concentrations of DINCH biomarkers were 0.96 (95% CI: 0.65, 1.41) for cyclohexane-1,2-dicarboxylic acid mono hydroxyisononyl ester (MHNCH) and 0.71 (95% CI: 0.41, 1.23) for cyclohexane-1,2-dicarboxylic acid mono carboxyisoocytl ester (MCOCH). For ΣDEHP and the DEHP metabolite of mono(2-ethylhexyl) phthalate (MEHP), we observed weak-to-moderate positive associations. HRs comparing highest vs. lowest quartiles were 1.12 (95% CI: 0.71, 1.76) and 1.34 (95% CI: 0.84, 2.14) for ΣDEHP and MEHP, respectively. In the mixtures analysis, the HR for a joint quartile increase in phthalate biomarker concentrations was 0.90 (95% CI: 0.73, 1.08).
Discussion:
In this prospective ultrasound study of reproductive-aged Black women, urinary concentrations of phthalate and DINCH biomarkers were not appreciably associated with higher risk of UL, either individually or jointly.
Keywords: Reproductive Health, Women’s Health, Endocrine Disrupting Chemicals, Phthalates, Uterine Leiomyoma, Environmental Epidemiology
1. Introduction
Uterine leiomyomata (UL), also known as fibroids, are noncancerous neoplasms of uterine smooth muscle tissue diagnosed in approximately 30% of reproductive aged women (Coronado et al., 2000; Stewart et al., 2017). Given their tendency to be asymptomatic, the cumulative incidence of ultrasound-detected UL is much higher, approaching 70% for White women and 80% for Black women by the age of 50 years (Baird et al., 2003). Black women generally have a two- to three-fold higher incidence of UL, develop UL at younger ages, and have more severe symptoms, compared with White women (Baird et al., 2003; Eltoukhi et al., 2014; Huyck et al., 2008; Kjerulff et al., 1996). UL-related symptoms and sequelae include infertility, pelvic pain, and menorrhagia (Wise and Laughlin-Tommaso, 2016). As they are the leading indication for hysterectomy in the United States (Merrill, 2008; Whiteman et al., 2008), UL are estimated to cost up to 9 billion dollars annually in medical care expenses (Cardozo et al., 2012). Although UL have a considerable impact on women’s health and have several known risk factors, the etiology of UL is not well understood.
UL are considered hormone-dependent neoplasms. They arise during the reproductive years, when circulating estrogens and progesterone are at their highest, and tend to regress after menopause. Although circulating sex steroid hormones are similar among women with and without UL (Okolo, 2008), expression of steroid hormone receptors, growth factors, and growth factor receptors, most of which are regulated by estrogen, is greater in smooth muscle cells of UL compared with normal myometrium (Andersen, 1996; Andersen and Barbieri, 1995). The extent to which exposure to endocrine disrupting chemicals (EDCs) influences UL development, however, has not been well-studied.
EDCs can interfere with the body’s endocrine system and influence hormone activity (NIEHS, 2019). Phthalate chemicals are one family of widely-used EDCs, with over 470 million pounds produced per year in the United States alone (EPA, 2012). Products such as food packaging, building materials, cleaning and medical supplies, nail polish, hairspray, perfume, and lotion can contain phthalates (ATSDR 2002, 2001, 1995; Blount et al., 2000). As a result of their widespread use and ability to leach, phthalates are ubiquitous in the environment (CDC, 2016; HHS, 2009). Common pathways of human exposure include ingestion of foods in contact with phthalate-containing materials and inhalation of indoor air, as well as dermal exposure from phthalate-containing products (HHS, 2009; Rudel et al., 2003). Detectable levels of phthalates have been found in the urine of up to 99% of the United States general population (Silva et al, 2004). In addition, 1,2-cyclohexane dicarboxylic acid, diisononyl ester (DINCH) is a plasticizer that has been used since 2002 as a replacement for some phthalates, specifically di(2-ethylhexyl) phthalate (DEHP) and di-isononyl phthalate (DiNP) (Crespo et al., 2007; Silva et al., 2013). Accordingly, DINCH may also be found in consumer products including toys, medical devices, food packaging, and cosmetics (Bui et al., 2016).
Despite the accumulating evidence of phthalate-related hormonal and reproductive effects (Bonilla and del Mazo, 2010; Hannon and Flaws, 2015; Kim et al., 2002; Li et al., 2014), phthalate-related disruption of sex steroid hormones (Ema et al., 2000; Gray et al., 2006; Jarfelt et al., 2005; Mylchreest et al., 1999; Mylchreest and Foster, 2000; Parks et al., 2000), and studies suggesting that sex steroid hormones influence UL pathogenesis (Borahay et al. 2017; Andersen, 1996; Andersen and Barbieri, 1995), there is limited epidemiologic literature on the association between urinary phthalate biomarkers and UL incidence. Previous epidemiologic studies have been inconsistent, and have been limited to cross-sectional and case-control study designs, where urinary concentrations of phthalates were measured after case diagnosis (Huang et al., 2010, 2014; Kim et al., 2016; Pollack et al., 2015; Sun et al., 2016; Weuve et al., 2010). To our knowledge, there have been no prospective studies of phthalate and phthalate alternative exposure with UL incidence in a population-based cohort.
In the present study, we examined prospectively the association between urinary concentrations of phthalates and phthalate alternative biomarkers and ultrasound-detected UL incidence in a population of reproductive-aged Black women. We estimated both individual and joint effects of exposure to phthalate biomarkers. For individual phthalate biomarkers, we hypothesized that effects on UL incidence would vary depending on the hormonal activity of the biomarker.
2. Materials and Methods
2.1. Study Population and Design
The Study of the Environment, Lifestyle and Fibroids (SELF) is an ongoing prospective cohort study of 1,693 Black women residing in the Detroit, Michigan metropolitan area. Recruitment of SELF participants occurred from 2010-2012, with community outreach through radio, television, newspapers, event booths, and informational letters to women in the Henry Ford Health Care System (HFHS), the clinical institution collaborating on SELF (Baird et al., 2015). Given the higher incidence of UL among reproductive-aged Black women (Baird et al., 2003; Kjerulff et al., 1996), eligibility for enrollment included women between the ages of 23-35 years who self-identified as Black/African American, had an intact uterus, and had no prior diagnosis of UL, cancer, or autoimmune disease requiring medication. Participants completed telephone- and computer-assisted questionnaires and in-person clinic visits. They also provided first-morning urine and non-fasting blood samples. Most urine samples were collected as first morning urine after we sent participants materials and instructions for urine collection to be done upon waking on the day of each clinic visit. Participants were evaluated at baseline and during three follow-up visits at approximately 20, 40 and 60 months. The study was approved by the Institutional Review Boards at the National Institute of Environmental Health Sciences (NIEHS), HFHS, and Boston University Medical Campus. All women provided informed consent prior to enrollment. The involvement of the Centers for Disease Control and Prevention (CDC) laboratory did not constitute engagement in human subjects research.
In this analysis, we used a case-cohort design to maximize efficiency for the investigation of urinary concentrations of phthalate and phthalate alternative biomarkers in relation to risk of UL (Therneau and Li, 1999). Of the 1,308 women confirmed by ultrasound to be UL-free at baseline, we selected the random sample of women at baseline as a subcohort (n=592) and also included incident UL cases that accrued outside of this subcohort through 60 months of follow-up (N=162), for a total of 754 participants (Figure S1). Incident cases contributed person-time up until the follow-up interval during which they were diagnosed with UL. Baseline characteristics of SELF subcohort participants were similar to the other SELF participants, as previously reported (Bethea et al., 2019).
2.2. Phthalate and DINCH Biomarker Measurement
Urine samples were collected at baseline, 20-month, and 40-month visits. Samples were stored at −80 degrees Celsius at the NIEHS repository (Experimental Pathology Labs, Durham, NC). These samples were shipped on dry ice to the CDC where they were analyzed for 14 phthalate metabolites: mono-n-butyl phthalate (MBP), mono-hydroxybutyl phthalate (MHBP), mono-isobutyl phthalate (MiBP), mono-hydroxyisobutyl phthalate (MHiBP), monobenzyl phthalate (MBzP), mono(2-ethyl-5-hydroxyhexyl) phthalate (MEHHP), mono(2-ethylhexyl) phthalate (MEHP), mono(2-ethyl-5-oxohexyl) phthalate (MEOHP), mono(2-ethyl-5-carboxypentyl) phthalate (MECPP), monoethyl phthalate (MEP), mono carboxyisooctyl phthalate (MCOP), mono-isononyl phthalate (MNP), mono carboxyisononyl phthalate (MCNP), and mono-3-carboxypropyl phthalate (MCPP). The CDC also analyzed urine for two DINCH metabolites: cyclohexane-1,2-dicarboxylic acid mono hydroxyisononyl ester (MHNCH) and cyclohexane-1,2-dicarboxylic acid mono carboxyisoocytl ester (MCOCH). The CDC quantified phthalate and DINCH metabolite concentrations in urine using a modification of a previously described analytical approach based on online solid-phase extraction coupled with isotope dilution-high-performance liquid chromatography-tandem mass spectrometry (Silva et al., 2013). The NIEHS measured urinary creatinine with the use of Beckman Coulter clinical analyzers AU400e and AU480 using Beckman Coulter reagents. To adjust for urine dilution, we implemented the covariate-adjusted standardization method for phthalate metabolites (O’Brien et al., 2016). This method was developed to reduce bias resulting from known determinants of creatinine levels, including age and BMI status that vary between individuals (Barr et al., 2005; O’Brien et al., 2016). We calculated predicted urinary creatinine levels for each participant as a function of their age and BMI status, and then computed a ratio of observed to predicted creatinine. We then divided the individual metabolite concentration by the observed to predicted ratio to implement the covariate-adjusted standardization. Additionally, creatinine concentration was included as a covariate in statistical models. Biospecimens were analyzed for metabolites at the beginning of each incident period (0-20 months, 20-40 months, and 40-60 months).
2.3. Uterine Leiomyomata Assessment
Women underwent transvaginal ultrasound examination to diagnose UL at baseline and all follow-up visits. Transvaginal ultrasounds have a high sensitivity (91%) and specificity (99%) to detect UL, compared with the gold standard of histologic verification (Dueholm et al, 2002). The minimum diameter for detection of fibroids by ultrasound was 0.5 centimeters. To maximize reliability and quality of the assessment data, certified clinical staff sonographers were required to have at least 3 years of gynecology experience and be additionally trained to carry out the SELF protocol. Quality control based on archived images was conducted. A full description of the UL identification procedures in this study has been previously reported (Baird et al., 2015).
2.4. Covariate Data Collection
Women completed telephone- and computer-assisted questionnaires and in-person clinic visits for assessment of demographic factors (age, education, income, marital status), health-related behaviors (smoking status, alcohol use), hormonal contraceptive use, and reproductive history (age at menarche, age at first birth, years since last birth, parity, history of infertility) at baseline. We collected data on fish intake (servings/week and serving size) using a semi-quantitative Block food frequency questionnaire as described previously (Block et al., 1990; Boucher et al., 2006; Brasky et al., 2020; Paul et al., 2005). We calculated body mass index (BMI, kg/m2) from baseline height and weight measured by trained technicians at clinic visits.
2.5. Statistical Analysis
2.5.1. Analysis of Individual Phthalate Biomarkers
Descriptive statistics were computed for selected covariates. Urinary biomarker concentrations were examined at all three collection time points to evaluate the variability in metabolite concentrations in each woman over the study period. As biomarkers were measured repeatedly, we calculated the geometric mean of baseline, 20-month, and 40-month concentrations in our primary analysis to derive a cumulatively-averaged exposure. For this measure, the biomarker concentrations from baseline were assigned to the 0-20 month incident period, the biomarker concentrations from baseline and 20-month follow-up were averaged and assigned to the 20-40 month incident period, and the biomarker concentrations from baseline, 20-month, and 40-month follow-ups were averaged and assigned to the 40-60 month incident period. Among the women selected, baseline concentrations were available for 731 to 751 participants, depending on the biomarker. If biomarker concentrations were missing for follow-up visits (12.4% missing at 20 months, 21.1% missing 40 months), baseline values were carried forward. Cumulative average models controlled for baseline covariates to reduce the potential for time dependent confounding. We calculated the molar sum of DEHP (ΣDEHP) by dividing four DEHP metabolite creatinine standardized concentrations (MEHHP, MEHP, MEOHP, MECPP) by their molecular weight and then summing these values (μmol/L). To examine the association between anti-androgenic phthalates and UL, we also calculated the potency-weighted sum of anti-androgenic metabolite concentrations (WΣAA) including MBP, MiBP, MBzP, MEHP, MEHHP, MEOHP, MECPP, MEP, MHBP, MCOP, and MHiBP according to an approach used previously (Varshavsky et al., 2016; Zota et al., 2019). We categorized phthalate biomarkers into quartiles to allow for non-linear associations and to reduce the impact of extreme values, with the lowest quartile as the reference group. We set values that were below the limit of detection (LOD) to the LOD divided by the square root of 2 (Hornung and Reed, 1990). While this approach has known limitations, all but two of the fourteen phthalate biomarkers had fewer than 1% of values below the LOD. We analyzed biomarkers detected in less than 50% of samples (two DINCH biomarkers) as dichotomous variables and compared detectable to nondetectable concentrations (van’t Erve et al., 2019). We computed Spearman rank correlation coefficients between metabolites.
A total of 23 (3.1%) women were missing follow-up data on UL. Therefore, we imputed their at-risk person-time (in years) and their outcome status (UL: yes vs. no) (Kontopantelis et al., 2017). We used multiple imputation to impute missing outcome data by creating 5 imputation data sets with a Markov chain Monte Carlo method (Rubin, 2004; Zhou et al., 2001). Given that less than ten percent of data were missing within our dataset, five imputations were considered appropriate to generate unbiased associations with limited loss of power (Graham et al. 2007; Schafer and Olsen 1998). We statistically combined estimates and standard errors from the five data sets (Rubin, 2004; Zhou et al., 2001). To reduce bias, improve precision, and optimize imputation performance, UL incidence was included in the imputation model along with other auxiliary variables (Kontopantelis et al., 2017; Pedersen et al., 2017).
Women contributed person-time from baseline until the diagnosis of UL or the occurrence of a censoring event (i.e., hysterectomy, loss to follow-up, or the end of follow-up), whichever came first. We used Cox proportional hazards regression models to estimate hazard ratios (HRs) and 95% confidence intervals (CIs) for the associations between individual phthalate biomarkers and UL. We used time (in years) as the time scale and stratified by age at baseline in one-year intervals. We used weighting methods to account for the oversampling of cases in the case-cohort study design (Therneau and Li, 1999). We included confounders a priori based on hypothesized relationships between phthalates and DINCH, UL and each potential confounder, including education (≤high school/GED, some college vs. ≥college degree), smoking history (never, former, current <10 cigarettes/day, current ≥10 cigarettes/day), alcohol intake in past year (none, heavy [≥7 drinks/week or ≥4 drinks at one time at least once per month]), moderate [all other alcohol intake], BMI (<25, 25-29, 30-34, ≥35 kg/m2), age at menarche (≤10, 11, 12, 13, ≥14 years), parity (0, 1, 2, ≥3 births), age at first birth (<20, 20-24, ≥25 years), and years since last birth (<2, 2-4, 5-9, ≥10 years) modeled as an indicator variable. We modeled fish intake (oz/day) and creatinine (mg/dL) continuously. We modeled self-reported infertility and current hormonal contraceptive use as dichotomous variables. We stratified final models by BMI (<30 vs. ≥30 kg/m2) because higher BMI is associated with reductions in endogenous sex hormone binding globulin (SHBG) concentrations, which may increase the bioavailability of estradiol and therefore modify the phthalates-UL association. In a sensitivity analysis, we evaluated associations using baseline concentrations of phthalate biomarkers as well as time-varying phthalate biomarker concentrations to assess long-term and proximal exposure in relation to UL incidence, as illustrated in Figure S2. Additionally, given the large number of participants with nondetectable concentrations of DINCH metabolites, we evaluated UL incidence comparing participants with DINCH metabolites above vs. at/below the LOD as a secondary analysis. We used SAS version 9.4 for these analyses.
2.5.2. Mixtures Analysis
Exposure to multiple phthalates simultaneously is more likely as phthalates tend to share exposure sources. We therefore assessed the joint impact of multiple phthalates on UL incidence using quantile g-computation. This novel approach to evaluate effects of environmental mixtures has been described in greater detail elsewhere (Keil et al., 2020; Niehoff et al., 2020). Briefly, quantile g-computation was adapted from weighted quantile sum (WQS) regression (Carrico et al., 2015), a similar approach for estimating effects of mixtures. An advantage of quantile g-computation over WQS is that this method can account for varying directions of effect for individual exposures included in the model. All mixture components are first transformed into quartiles. Then a linear model is fit between exposures, covariates, and outcome, which defines the weights for each exposure. Weights represent the strength of the association between each exposure and outcome. The model is implemented by fitting a linear model, where the quantile g-computation estimator is the sum of the regression coefficients across the exposures (Keil et al., 2020; Snowden et al., 2011). Given that phthalate biomarker concentrations generally demonstrated linear relationships with UL incidence in individual generalized additive models, we evaluated quantile g-computation for survival outcomes under linearity assumptions within the R package ‘qgcomp’ (Keil et al., 2020). Within the linear models, each phthalate biomarker was given a negative or positive weight, as described previously (Niehoff et al., 2020). For homogenous effects, the weight is the proportion of effect due to the specific mixture component, which sums to one across components. For heterogenous effects, weights are the proportion of partial effect in each direction, and positive and negative weights sum to two. The underlying model used for these analyses was the Cox proportional hazards model, which estimates hazard ratios for the mixture effect. The mixture effect is interpreted as the hazard ratio per quartile increase in all biomarker concentrations. We modeled the joint association between creatinine-standardized cumulatively-averaged phthalate biomarkers and UL, adjusting for the covariates as described above for the individual phthalate biomarker models within a selected imputed dataset. We included age as a covariate rather than a strata term given the qgcomp model parameters. We performed this analysis in R version 3.6.2.
3. Results
Among participants, mean age at baseline was 28.6 years (Table 1). More than half of women were never married (57%), never smokers (73%), had a gross annual income of $50,000 or less (83%), and had a BMI greater than 30 kg/m2 (60%). About half (51%) of women had some college or technical training, 38% were nulliparous, 20% currently used hormonal contraceptives, and 6% reported a history of infertility. Among parous women, mean age at first birth was 20.6 years and mean years since last birth was 5.1 years (Table 1). Spearman rank correlations between baseline urinary metabolite concentrations ranged from r = −0.04 (between MCOCH and MEP) and −0.03 (between MNP and MHBP) to r = 0.94 (between MEOHP and MEHHP). When we excluded metabolite pairs that were derived from the same parent compound, the maximum Spearman rank correlation was 0.75 (between MCOP and MCPP). Spearman rank coefficients for concentrations of individual metabolites across time points ranged from 0.08 (between baseline and 40-month follow-up for MCPP) to 0.56 (20-month to 40-month follow-up for MBzP). Detection limits ranged from 0.2 ng/mL for MEOHP (detected in 99.7%) to 1.2 ng/mL for MEP (detected in 100%) (Table 2). The detection frequency for urinary phthalate metabolites ranged from 71.7% (MNP) to 100% (MEP), and was considerably lower for the DINCH metabolites: 23.7% and 11.3% for MHNCH and MCOCH, respectively (Table 2). We identified 301 UL cases (Figure S1) during 3,022 person-years of follow-up.
Table 1.
Baseline Characteristics of 754 participants in the Study of Environment, Lifestyle, and Fibroids (SELF) Prospective Cohort Study (2010-2012)
| Characteristics | All participants Mean ± SD or % |
|---|---|
| Age at Study Start (years) | 28.6 ± 3.5 |
| Age at Study End (years) | 32.6 ± 3.6 |
| Age at First Birth* (years) | 20.6 ± 3.7 |
| Years since last birth* | 5.1 ± 3.8 |
| Fish Intake (oz/day) | 0.98 ± 1.18 |
| Parity | |
| Nulliparous | 37.8% |
| 1 | 27.2% |
| 2 | 17.1% |
| ≥3 | 17.9% |
| Smoking Status | |
| Never | 73.3% |
| Past | 7.7% |
| Current | 19.0% |
| Alcohol Use in Last Year | |
| None | 28.9% |
| Moderate | 51.1% |
| Heavy | 20.0% |
| Current Hormonal Contraceptive Use | 19.8% |
| History of Infertility | 6.4% |
| Education, % | |
| ≤High school diploma/GED | 21.8% |
| Some college/Associate’s/Technical | 50.5% |
| ≥Bachelor’s degree | 27.7% |
| Gross annual household income | |
| <$20,000 | 45.2% |
| $20,000-$50,000 | 37.9% |
| >$50,000 | 16.8% |
| BMI (Body Mass Index) (kg/m2) | |
| <25 | 19.0% |
| 25-29 | 20.8% |
| 30-34 | 19.6% |
| ≥35 | 40.6% |
| Marital status | |
| Never married | 57.3% |
| Currently married | 28.5% |
| Previously married | 14.2% |
Among parous women (n=472); Note: Results presented for first imputation data set; findings were similar for imputation data sets 1-5.
Table 2.
Distribution of creatinine standardized urinary concentrations of phthalate and DINCH biomarkers at baseline in SELF (2010-2012)
| Biomarker by Parent Compound | N | LOD (ng/mL) | % Detect | Median (ng/mL) | 75th %ile (ng/mL) |
|---|---|---|---|---|---|
|
Di-n-butyl phthalate (DBP)
| |||||
| Mono-n-butyl phthalate (MBP) | 751 | 0.4 | 99.9 | 27.0 | 40.2 |
| Mono-hydroxybutyl phthalate (MHBP) | 731 | 0.4 | 93.6 | 2.0 | 2.9 |
|
| |||||
|
Di-isobutyl phthalate (DiBP)
| |||||
| Mono-isobutyl phthalate (MiBP) | 751 | 0.8 | 99.4 | 18.6 | 29.9 |
| Mono-hydroxyisobutyl phthalate (MHiBP) | 731 | 0.4 | 99.2 | 5.1 | 8.1 |
|
| |||||
|
Benzylbutyl phthalate (BzBP)
| |||||
| Monobenzyl phthalate (MBzP) | 751 | 0.3 | 99.7 | 10.7 | 19.6 |
|
| |||||
|
Di(2-ethylhexyl) phthalate (DEHP)
| |||||
| Mono-2-ethyl-5-hydroxyhexyl phthalate (MEHHP) | 751 | 0.4 | 99.7 | 20.1 | 31.6 |
| Mono-2-ethylhexyl phthalate (MEHP) | 751 | 0.8 | 91.6 | 3.9 | 7.0 |
| Mono-2-ethyl-5-oxohexyl phthalate (MEOHP) | 751 | 0.2 | 99.7 | 12.3 | 19.2 |
| Mono-2-ethyl-5-carboxypentyl phthalate (MECPP) | 751 | 0.4 | 99.9 | 25.2 | 41.3 |
|
| |||||
|
Di-ethyl phthalate (DEP)
| |||||
| Monoethyl phthalate (MEP) | 751 | 1.2 | 100 | 99.1 | 197.4 |
|
| |||||
|
Di-isonoyl phthalate (DNP)
| |||||
| Mono carboxyisooctyl phthalate (MCOP) | 751 | 0.3 | 99.7 | 32.9 | 89.0 |
| Mono-isononyl phthalate (MNP) | 731 | 0.9 | 71.7 | 1.8 | 5.3 |
|
| |||||
|
Di-isodecyl phthalate (DDP)
| |||||
| Mono carboxyisononyl phthalate (MCNP) | 751 | 0.2 | 99.7 | 4.5 | 8.4 |
|
| |||||
|
Di-n-octyl (DOP)/DBP
| |||||
| Mono-3-carboxypropyl phthalate (MCPP) | 751 | 0.4 | 98.0 | 3.8 | 9.3 |
|
| |||||
|
1,2-Cyclohexane dicarboxylic acid, diisononyl ester (DINCH)
| |||||
| Cyclohexane-1,2-dicarboxylic acid mono hydroxyisononyl ester (MHNCH) ester (MHNCH) | 751 | 0.4 | 23.7 | < LOD | < LOD |
| Cyclohexane-1,2-dicarboxylic acid mono carboxyisooctyl ester (MCOCH) | 731 | 0.5 | 11.3 | < LOD | < LOD |
Most individual phthalate metabolite concentrations were weakly to moderately associated with lower risk of UL, though associations were generally imprecise (Figure 1). The inverse associations of greatest magnitude (comparing the highest vs. lowest quartiles) were observed for MHiBP and MiBP. Participants with MHiBP concentrations in the highest quartile had a 35% lower incidence of UL (HR=0.65, 95% CI: 0.41, 1.03) compared with participants in the lowest quartile (Table 3). Similarly, participants with MiBP concentrations in the highest quartile had a 26% lower incidence of UL (HR=0.74, 95% CI: 0.46, 1.17) compared with participants in the lowest quartile. Notably, MEHP was the only individual metabolite with positive HRs across quartiles, including at the highest vs. lowest quartile (HR=1.34, 95% CI: 0.84, 2.14). MBzP (highest vs. lowest quartile: HR=1.17, 95% CI: 0.74, 1.85) and MEHHP (highest vs. lowest quartile: HR=1.06, 95% CI: 0.68, 1.65) were the only other individual biomarkers with positive HRs comparing extreme quartiles, though results for MEHHP were particularly weak and consistent with no association. For ΣDEHP and the weighted sum of anti-androgenic phthalate (WΣAA) biomarkers, HRs comparing highest vs. lowest quartiles were 1.12 (95% CI: 0.71, 1.76) and 1.05 (95% CI: 0.66, 1.66), respectively (Table 3). We did not find consistent dose-response relationships for most biomarkers. Models using baseline and time-varying concentrations produced similar findings to comparable models with cumulatively averaged concentrations (Table S1–S3).
Figure 1. Hazard Ratio (HR) and 95% Confidence Intervals (CI) for association between cumulatively-averaged creatinine-standardized quartiles of phthalate biomarker concentrations (ng/mL) and risk of uterine leiomyomata.
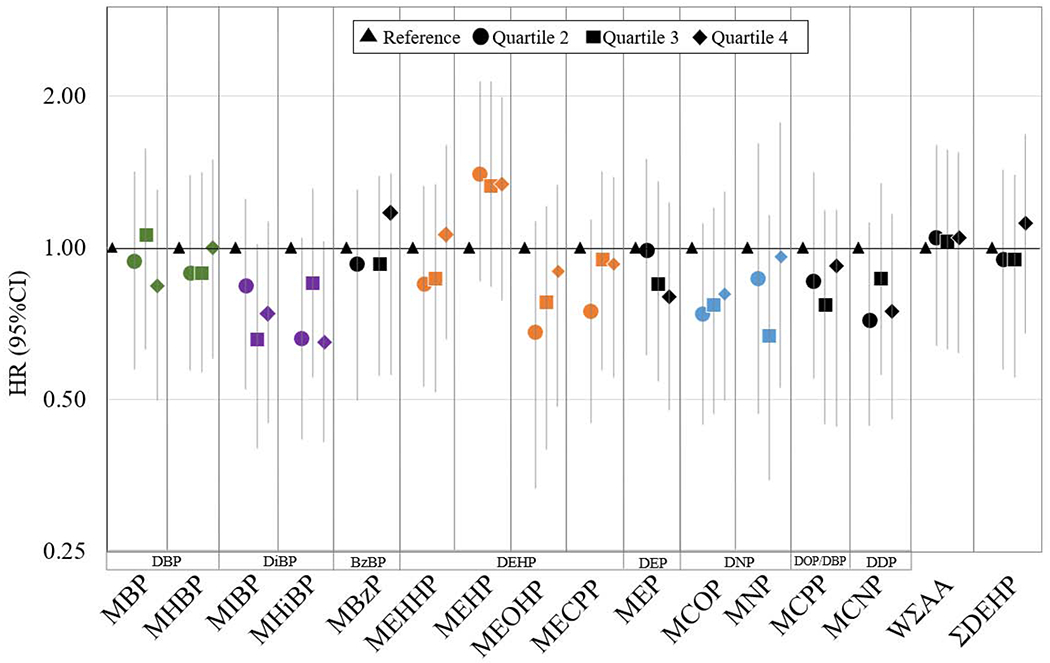
Model adjusted for age at menarche, smoking, alcohol use, BMI, education, parity, age at first birth, years since last birth, history of infertility, fish intake, creatinine, and current hormonal contraceptive use. ΣDEHP is the total molar sum of di(2-ethylhexyl) phthalate metabolites (μmol/L) [ΣDEHP (MEHP + MEHHP + MEOHP + MECPP)]. WΣAA is the potency weighted sum of anti-androgenic metabolites [ WΣAA (Weighted (MBP+ MiBP + MBzP + MEHP + MEHHP + MEOHP + MECPP + MEP + MHBP + MCOP + MHiBP)]. Green points correspond to the multiple DBP metabolites (MBP, MHBP). Purple points correspond to the multiple DiBP metabolites (MIBP, MHiBP). Orange points correspond to the multiple DEHP metabolites (MEHHP, MEHP, MEOHP, MECPP). Blue points correspond to the multiple DNP metabolites (MCOP, MNP). Metabolite abbreviations: mono-n-butyl phthalate (MBP), mono-hydroxybutyl phthalate (MHBP), mono-isobutyl phthalate (MiBP), mono-hydroxyisobutyl phthalate (MHiBP), Monobenzyl phthalate (MBzP), mono(2-ethyl-5-hydroxyhexyl) phthalate (MEHHP), mono(2-ethylhexyl) phthalate (MEHP), mono(2-ethyl-5-oxohexyl) phthalate (MEOHP), mono(2-ethyl-5-carboxypentyl) phthalate (MECPP), monoethyl phthalate (MEP), mono carboxyisooctyl phthalate (MCOP), mono-isononyl phthalate (MNP), mono-3-carboxypropyl phthalate (MCPP) and mono carboxyisononyl phthalate (MCNP). Parent compound abbreviations: Di-n-butyl phthalate (DBP), Di-isobutyl phthalate (DiBP), Benzylbutyl phthalate (BzBP), Di(2-ethylhexyl) phthalate (DEHP), Di-ethyl phthalate (DEP), Di-isonoyl phthalate (DNP), Di-n-octyl [(DOP)/DBP], Di-isodecyl phthalate (DDP).
Table 3.
Cumulatively-averaged creatinine standardized phthalate biomarker concentrations and risk of uterine leiomyomata, SELF cohort
| Phthalate biomarker a (ng/mL) | # Cases/Person-yearsb | Unadjusted HR (95%CI) | Adjusted HRc (95% CI) |
|---|---|---|---|
| Mono-n-butyl phthalate (MBP) | |||
| <17.37 | 87/785 | Reference | Reference |
| 17.37-25.16 | 82/788 | 0.99 (0.65, 1.52) | 0.94 (0.60, 1.47) |
| 25.16 -36.41 | 73/716 | 1.06 (0.69, 1.64) | 1.06 (0.67, 1.68) |
| ≥36.41 | 69/733 | 0.81 (0.51, 1.29) | 0.84 (0.52, 1.36) |
| Mono-hydroxybutyl phthalate (MHBP) | |||
| <1.15 | 94/786 | Reference | Reference |
| 1.15-1.75 | 70/789 | 0.83 (0.54, 1.29) | 0.89 (0.57, 1.41) |
| 1.75-2.62 | 67/711 | 0.79 (0.51, 1.23) | 0.89 (0.57, 1.41) |
| ≥2.62 | 80/736 | 0.91 (0.59, 1.40) | 1.00 (0.63, 1.57) |
| Mono-isobutyl phthalate (MiBP) | |||
| <12.62 | 93/790 | Reference | Reference |
| 12.62-18.09 | 79/744 | 0.91 (0.60, 1.38) | 0.84 (0.54, 1.29) |
| 18.09-28.16 | 68/750 | 0.68 (0.44, 1.06) | 0.66 (0.42, 1.05) |
| ≥28.16 | 71/738 | 0.76 (0.49, 1.17) | 0.74 (0.46, 1.17) |
| Mono-hydroxyisobutyl phthalate (MHiBP) | |||
| <3.39 | 99/808 | Reference | Reference |
| 3.39-5.00 | 59/711 | 0.64 (0.41, 0.99) | 0.66 (0.42, 1.05) |
| 5.00-7.34 | 79/724 | 0.84 (0.55, 1.26) | 0.85 (0.55, 1.31) |
| ≥7.34 | 74/779 | 0.67 (0.44, 1.04) | 0.65 (0.41, 1.03) |
| Monobenzyl phthalate (MBzP) | |||
| <6.41 | 90/800 | Reference | Reference |
| 6.41-10.10 | 72/722 | 0.88 (0.56, 1.37) | 0.93 (0.59, 1.47) |
| 10.10-18.43 | 73/760 | 0.84 (0.54, 1.30) | 0.93 (0.58, 1.47) |
| ≥18.43 | 76/740 | 1.02 (0.66, 1.58) | 1.17 (0.74, 1.85) |
| Mono(2-ethyl-5-hydroxyhexyl) phthalate (MEHHP) | |||
| <11.85 | 85/770 | Reference | Reference |
| 11.85-17.57 | 71/743 | 0.87 (0.56, 1.36) | 0.85 (0.53, 1.36) |
| 17.57-27.32 | 66/750 | 0.84 (0.54, 1.32) | 0.87 (0.55, 1.43) |
| ≥27.32 | 89/759 | 1.06 (0.69, 1.62) | 1.06 (0.68, 1.65) |
| Mono(2-ethylhexyl) phthalate (MEHP) | |||
| <2.08 | 69/773 | Reference | Reference |
| 1.36-2.25 | 84/750 | 1.40 (0.89, 2.20) | 1.40 (0.87, 2.24) |
| 2.25-3.88 | 73/739 | 1.24 (0.77, 1.99) | 1.33 (0.82, 2.17) |
| ≥3.88 | 85/760 | 1.39 (0.89, 2.17) | 1.34 (0.84, 2.14) |
| Mono(2-ethyl-5-oxohexyl) phthalate (MEOHP) | |||
| <7.27 | 41/347 | Reference | Reference |
| 7.27-11.20 | 46/514 | 0.70 (0.38, 1.27) | 0.68 (0.37, 1.25) |
| 11.20-16.78 | 72/746 | 0.81 (0.48, 1.37) | 0.78 (0.45, 1.36) |
| ≥16.78 | 152/1415 | 0.87 (0.54, 1.40) | 0.90 (0.54, 1.48) |
| Mono(2-ethyl-5-carboxypentyl) phthalate (MECPP) | |||
| <16.20 | 86/759 | Reference | Reference |
| 16.20-23.56 | 66/758 | 0.76 (0.48, 1.19) | 0.75 (0.47, 1.21) |
| 23.56-35.18 | 77/749 | 0.91 (0.59, 1.40) | 0.95 (0.60, 1.50) |
| ≥35.18 | 82/756 | 0.93 (0.55, 1.44) | 0.93 (0.59, 1.47) |
| Monoethyl phthalate (MEP) | |||
| <52.17 | 86/770 | Reference | Reference |
| 52.17-96.74 | 78/741 | 0.98 (0.64, 1.50) | 0.99 (0.64, 1.55) |
| 96.74-172.17 | 75/755 | 0.92 (0.59, 1.41) | 0.85 (0.54, 1.34) |
| ≥172.17 | 72/756 | 0.84 (0.53, 1.31) | 0.80 (0.50, 1.27) |
| Mono carboxyisooctyl phthalate (MCOP) | |||
| <17.88 | 87/760 | Reference | Reference |
| 17.88-34.25 | 70/768 | 0.78 (0.49, 1.23) | 0.74 (0.46, 1.19) |
| 34.25-73.36 | 74/749 | 0.86 (0.55, 1.33) | 0.77 (0.48, 1.25) |
| ≥73.36 | 80/745 | 0.90 (0.57, 1.42) | 0.81 (0.50, 1.33) |
| Mono-isononyl phthalate (MNP) | |||
| <1.05 | 26/238 | Reference | Reference |
| 1.05-1.94 | 77/738 | 0.91 (0.47, 1.75) | 0.87 (0.43, 1.74) |
| 1.94-4.46 | 99/1123 | 0.76 (0.40, 1.43) | 0.67 (0.33, 1.33) |
| ≥4.46 | 109/923 | 1.10 (0.58, 2.07) | 0.96 (0.48, 1.92) |
| Mono carboxyisononyl phthalate (MCNP) | |||
| <3.06 | 89/762 | Reference | Reference |
| 3.06-4.55 | 67/748 | 0.72 (0.46, 1.13) | 0.72 (0.45, 1.15) |
| 4.55-7.58 | 78/758 | 0.85 (0.55, 1.30) | 0.87 (0.56, 1.35) |
| ≥7.58 | 77/754 | 0.79 (0.51, 1.23) | 0.75 (0.47, 1.20) |
| Mono-3-carboxypropyl phthalate (MCPP) | |||
| <2.22 | 82/767 | Reference | Reference |
| 2.22-3.76 | 81/776 | 0.89 (0.58, 1.37) | 0.86 (0.55, 1.35) |
| 3.76-7.27 | 68/733 | 0.80 (0.51, 1.26) | 0.77 (0.48, 1.22) |
| ≥7.27 | 80/746 | 0.95 (0.61, 1.47) | 0.92 (0.58, 1.46) |
| ΣAA Weightedd | |||
| <70.08 | 78/748 | Reference | Reference |
| 70.08-95.10 | 73/735 | 0.99 (0.64, 1.53) | 1.05 (0.66, 1.67) |
| 95.10-130.90 | 72/736 | 0.94 (0.60, 1.45) | 1.03 (0.65, 1.63) |
| ≥130.90 | 88/803 | 1.00 (0.65, 1.55) | 1.05 (0.66, 1.66) |
| ΣDEHPe (μmol/L) | |||
| <0.12 | 82/771 | Reference | Reference |
| 0.12-0.19 | 73/727 | 0.96 (0.62, 1.47) | 0.95 (0.59, 1.51) |
| 0.19-0.28 | 67/751 | 0.82 (0.52, 1.30) | 0.95 (0.58, 1.53) |
| ≥0.28 | 89/773 | 1.08 (0.71, 1.66) | 1.12 (0.71, 1.76) |
Quartiles of metabolite concentrations.
Results presented for first imputation data set; findings were similar for imputation data sets 1-5.
Model adjusted for age at menarche, smoking, alcohol use, BMI, education, parity, age at first birth, years since last birth, history of infertility, fish intake, creatinine, and current hormonal contraceptive use.
Potency weighted sum of anti-androgenic biomarkers [ ΣAA Weighted (MBP, MiBP, MBzP, MEHP, MEHHP, MEOHP, MECPP, MEP, MHBP, MCOP, MHiBP)]
The total molar sum of di(2-ethylhexyl) phthalate biomarkers [ΣDEHP (MEHP + MEHHP + MEOHP + MECPP)].
We stratified our adjusted models by BMI to examine whether the associations between phthalate biomarkers and UL incidence varied by adiposity. BMI itself was associated with UL incidence in an inverse U-shaped pattern [HRs (95% CIs) for BMIs 25-29, 30-34, and ≥35 kg/m2 vs. <25 were 0.99 (0.69-1.45), 1.41 (0.99, 2.01), and 0.85 (0.60, 1.20), respectively]. Associations between the highest vs. lowest quartiles of phthalate biomarkers were generally more strongly inverse among women with BMI ≥30 kg/m2 compared to women with BMI <30 kg/m2 (Figure 2). For instance, women with BMI ≥30 kg/m2 in the highest MBP quartile had a 38% lower risk of UL compared with women in the lowest MBP quartile (95% CI: 0.33, 1.17); that same contrast among women with BMI <30 kg/m2 produced an HR of 1.55 (95% CI: 0.62, 3.91), but there was no evidence of a dose-response relation (Table 4). Among women with BMI ≥30 kg/m2, inverse or null associations were observed comparing the highest vs. lowest quartiles of WΣAA (HR=0.80, 95% CI: 0.45, 1.43) and ΣDEHP (HR: 0.98, 95% CI: 0.54, 1.77), whereas associations were positive albeit imprecise among women with BMI <30 kg/m2 for the same contrast (WΣAA HR=1.78, 95% CI: 0.75, 4.23; ΣDEHP HR=1.46, 95% CI: 0.65, 3.29) (Table 4). For the DEHP metabolite, MEHP, we observed positive associations of greater magnitude comparing the highest vs. lowest quartiles among women with BMI ≥30 kg/m2 (MEHP HR=1.30, 95% CI: 0.70, 2.43) compared to among women with BMI <30 kg/m2 (MEHP HR=1.08, 95% CI: 0.48, 2.44). For the DEHP metabolites of MECPP, MEHHP, and MEOHP, associations were not appreciably different across BMI strata.
Figure 2. Hazard Ratio (HR) and 95% Confidence Intervals (CI) for association between cumulatively-averaged creatinine-standardized quartiles of phthalate biomarker concentrations (ng/mL) and risk of uterine leiomyomata, quartile 2, 3, and 4 (Q2-Q4) vs. reference, stratified by Body Mass Index (BMI) at baseline (<30 vs. >=30 kg/m2).
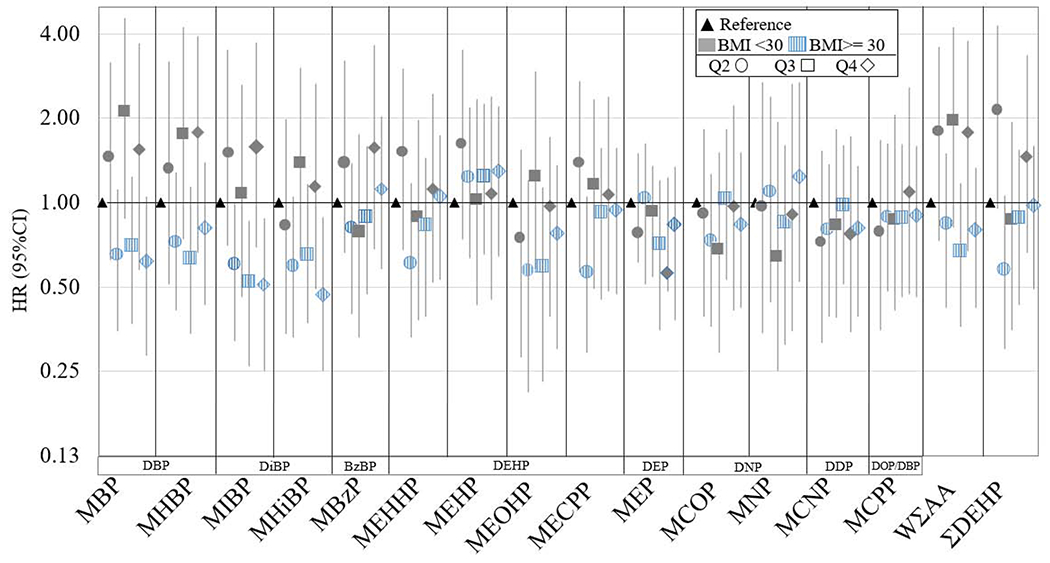
Model adjusted for age at menarche, smoking, alcohol use, BMI, education, parity, age at first birth, years since last birth, history of infertility, fish intake, creatinine, and current hormonal contraceptive use. ΣDEHP is the total molar sum of di(2-ethylhexyl) phthalate biomarkers (μmol/L) [ΣDEHP (MEHP + MEHHP + MEOHP + MECPP)]. WΣAA is the potency weighted sum of anti-androgenic biomarkers [ WΣAA (Weighted (MBP+ MiBP + MBzP + MEHP + MEHHP + MEOHP + MECPP + MEP + MHBP + MCOP + MHiBP)]. Metabolite abbreviations: mono-n-butyl phthalate (MBP), mono-hydroxybutyl phthalate (MHBP), mono-isobutyl phthalate (MiBP), mono-hydroxyisobutyl phthalate (MHiBP), Monobenzyl phthalate (MBzP), mono(2-ethyl-5-hydroxyhexyl) phthalate (MEHHP), mono(2-ethylhexyl) phthalate (MEHP), mono(2-ethyl-5-oxohexyl) phthalate (MEOHP), mono(2-ethyl-5-carboxypentyl) phthalate (MECPP), monoethyl phthalate (MEP), mono carboxyisooctyl phthalate (MCOP), mono-isononyl phthalate (MNP), mono-3-carboxypropyl phthalate (MCPP) and mono carboxyisononyl phthalate (MCNP). Parent compound abbreviations: Di-n-butyl phthalate (DBP), Di-isobutyl phthalate (DiBP), Benzylbutyl phthalate (BzBP), Di(2-ethylhexyl) phthalate (DEHP), Di-ethyl phthalate (DEP), Di-isonoyl phthalate (DNP), Di-n-octyl [(DOP)/DBP], Di- isodecyl phthalate (DDP).
Table 4.
Cumulatively-averaged creatinine standardized phthalate biomarker concentrations and risk of uterine leiomyomata, SELF cohort, by BMI at baseline (<30 vs. ≥ 30 kg/m2)
| BMI <30 kg/m2 | BMI ≥30 kg/m2 | |||
|---|---|---|---|---|
|
| ||||
| Phthalate biomarkersa (ng/mL) | # Cases/P-yearsb | Adjusted HRc (95% CI) | # Cases/P-yearsb | Adjusted HRc (95% CI) |
| Mono-n-butyl phthalate (MBP) | ||||
| <17.37 | 26/317 | Reference | 62/468 | Reference |
| 17.37-25.16 | 32/332 | 1.45 (0.64, 3.28) | 50/456 | 0.65 (0.36, 1.16) |
| 25.16 -36.41 | 33/303 | 2.11 (0.93, 4.77) | 39/413 | 0.70 (0.38, 1.27) |
| ≥36.41 | 30/268 | 1.55 (0.62, 3.91) | 39/465 | 0.62 (0.33, 1.17) |
| Mono-hydroxybutyl phthalate (MHBP) | ||||
| <1.15 | 24/268 | Reference | 70/518 | Reference |
| 1.15-1.75 | 27/325 | 1.32 (0.49, 3.54) | 43/464 | 0.72 (0.41, 1.29) |
| 1.75-2.62 | 32/298 | 1.76 (0.72, 4.31) | 35/413 | 0.63 (0.34, 1.15) |
| ≥2.62 | 38/329 | 1.78 (0.70, 4.52) | 42/407 | 0.81 (0.45, 1.46) |
| Mono-isobutyl phthalate (MiBP) | ||||
| <12.62 | 28/341 | Reference | 65/449 | Reference |
| 12.62-18.09 | 32/286 | 1.51 (0.68, 3.35) | 47/458 | 0.60 (0.34, 1.06) |
| 18.09-28.16 | 28/287 | 1.08 (0.46, 2.57) | 40/463 | 0.52 (0.28, 0.94) |
| ≥28.16 | 33/306 | 1.58 (0.69, 3.62) | 38/432 | 0.51 (0.27, 0.95) |
| Mono-hydroxyisobutyl phthalate (MHiBP) | ||||
| <3.39 | 30/297 | Reference | 69/511 | Reference |
| 3.39-5.00 | 22/278 | 0.83 (0.34, 1.99) | 37/433 | 0.59 (0.33, 1.05) |
| 5.00-7.34 | 33/294 | 1.38 (0.63, 3.04) | 46/430 | 0.65 (0.37, 1.17) |
| ≥7.34 | 36/351 | 1.14 (0.49, 2.65) | 38/428 | 0.47 (0.25, 0.89) |
| Monobenzyl phthalate (MBzP) | ||||
| <6.41 | 33/317 | Reference | 57/459 | Reference |
| 6.41-10.10 | 29/332 | 1.38 (0.62, 3.04) | 43/463 | 0.81 (0.44, 1.50) |
| 10.10-18.43 | 27/303 | 0.79 (0.34, 1.83) | 46/439 | 0.89 (0.49, 1.62) |
| ≥18.43 | 32/268 | 1.57 (0.68, 3.59) | 44/442 | 1.12 (0.60, 2.07) |
| Mono(2-ethyl-5-hydroxyhexyl) phthalate (MEHHP) | ||||
| <11.85 | 33/354 | Reference | 52/416 | Reference |
| 11.85-17.57 | 32/303 | 1.51 (0.72, 3.19) | 39/440 | 0.61 (0.31, 1.19) |
| 17.57-27.32 | 24/285 | 0.89 (0.39, 2.03) | 42/465 | 0.83 (0.44, 1.57) |
| ≥27.32 | 32/278 | 1.12 (0.51, 2.46) | 57/481 | 1.05 (0.58, 1.89) |
| Mono(2-ethylhexyl) phthalate (MEHP) | ||||
| <2.08 | 24/292 | Reference | 45/481 | Reference |
| 1.36-2.25 | 35/327 | 1.62 (0.75, 3.51) | 49/423 | 1.23 (0.65, 2.33) |
| 2.25-3.88 | 28/302 | 1.02 (0.44, 2.39) | 45/437 | 1.24 (0.66, 2.35) |
| ≥3.88 | 34/299 | 1.08 (0.48, 2.44) | 51/461 | 1.30 (0.70, 2.43) |
| Mono(2-ethyl-5-oxohexyl) phthalate (MEOHP) | ||||
| <7.27 | 16/163 | Reference | 25/184 | Reference |
| 7.27-11.20 | 19/235 | 0.75 (0.27, 2.11) | 27/279 | 0.57 (0.25, 1.31) |
| 11.20-16.78 | 32/303 | 1.24 (0.51, 2.99) | 40/443 | 0.59 (0.27, 1.29) |
| ≥16.78 | 54/519 | 0.97 (0.43, 2.19) | 98/896 | 0.78 (0.39, 1.56) |
| Mono(2-ethyl-5-carboxypentyl) phthalate (MECPP) | ||||
| <16.20 | 33/344 | Reference | 53/415 | Reference |
| 16.20-23.56 | 32/320 | 1.39 (0.64, 3.00) | 34/438 | 0.56 (0.29, 1.09) |
| 23.56-35.18 | 28/308 | 1.16 (0.54, 2.51) | 49/441 | 0.92 (0.49, 1.70) |
| ≥35.18 | 28/248 | 1.07 (0.49, 2.38) | 54/508 | 0.94 (0.52, 1.73) |
| Monoethyl phthalate (MEP) | ||||
| <52.17 | 33/319 | Reference | 53/451 | Reference |
| 52.17-96.74 | 30/313 | 0.78 (0.36, 1.72) | 48/428 | 1.03 (0.57, 1.84) |
| 96.74-172.17 | 34/304 | 0.93 (0.43, 2.00) | 41/451 | 0.71 (0.38, 1.33) |
| ≥172.17 | 24/284 | 0.56 (0.25, 1.24) | 48/472 | 0.84 (0.45, 1.55) |
| Mono carboxyisooctyl phthalate (MCOP) | ||||
| <17.88 | 34/301 | Reference | 53/459 | Reference |
| 17.88-34.25 | 33/329 | 0.91 (0.42, 1.97) | 37/439 | 0.73 (0.37, 1.43) |
| 34.25-73.36 | 25/302 | 0.68 (0.30, 1.54) | 49/447 | 1.03 (0.55, 1.94) |
| ≥73.36 | 29/288 | 0.97 (0.42, 2.23) | 51/457 | 0.84 (0.44, 1.61) |
| Mono-isononyl phthalate (MNP) | ||||
| <1.05 | 10/100 | Reference | 16/138 | Reference |
| 1.05-1.94 | 31/277 | 0.97 (0.30, 3.20) | 46/461 | 1.09 (0.42, 2.81) |
| 1.94-4.46 | 40/460 | 0.64 (0.20, 2.13) | 59/663 | 0.85 (0.33, 2.16) |
| ≥4.46 | 40/383 | 0.91 (0.27, 3.07) | 69/540 | 1.24 (0.49, 3.19) |
| Mono carboxyisononyl phthalate (MCNP) | ||||
| <3.06 | 35/316 | Reference | 54/446 | Reference |
| 3.06-4.55 | 25/312 | 0.72 (0.33, 1.58) | 42/436 | 0.80 (0.43, 1.52) |
| 4.55-7.58 | 30/297 | 0.83 (0.39, 1.79) | 48/461 | 0.98 (0.54, 1.75) |
| ≥7.58 | 31/295 | 0.77 (0.35, 1.71) | 46/459 | 0.81 (0.43, 1.50) |
| Mono-3-carboxypropyl phthalate (MCPP) | ||||
| <2.22 | 34/314 | Reference | 48/453 | Reference |
| 2.22-3.76 | 34/333 | 0.79 (0.37, 1.72) | 47/443 | 0.89 (0.47, 1.64) |
| 3.76-7.27 | 26/297 | 0.87 (0.39, 1.94) | 42/436 | 0.88 (0.47, 1.65) |
| ≥7.27 | 27/276 | 1.09 (0.48, 2.50) | 53/470 | 0.90 (0.48, 1.67) |
| ΣAA Weightedd | ||||
| <70.08 | 22/302 | Reference | 56/446 | Reference |
| 70.08-95.10 | 37/370 | 1.79 (0.80, 4.01) | 36/365 | 0.84 (0.44, 1.59) |
| 95.10-130.90 | 33/285 | 1.96 (0.84, 4.58) | 39/451 | 0.67 (0.37, 1.24) |
| ≥130.90 | 29/263 | 1.78 (0.75, 4.23) | 59/540 | 0.80 (0.45, 1.43) |
| ΣDEHPe (μmol/L) | ||||
| <0.12 | 30/348 | Reference | 52/423 | Reference |
| 0.12-0.19 | 35/288 | 2.12 (1.00, 4.49) | 38/439 | 0.58 (0.30, 1.13) |
| 0.19-0.28 | 23/317 | 0.87 (0.37, 2.02) | 44/434 | 0.88 (0.47, 1.67) |
| ≥0.28 | 33/267 | 1.46 (0.65, 3.29) | 56/506 | 0.98 (0.54, 1.77) |
Note: n for BMI at baseline: <30 kg/m2 (n= 304); ≥ 30 kg/m2 (n= 460).
Quartiles of metabolite concentrations.
Results presented for first imputation data set; findings were similar for imputation data sets 1-5; P-years = person-years;
Model adjusted for age at menarche, smoking, alcohol use, BMI, education, parity, age at first birth, years since last birth, history of infertility, fish intake, creatinine, and current hormonal contraceptive use.
Potency weighted sum of anti-androgenic biomarkers [ ΣAA Weighted (MBP, MiBP, MBzP, MEHP, MEHHP, MEOHP, MECPP, MEP, MHBP, MCOP, MHiBP)]
The total molar sum of di(2-ethylhexyl) phthalate biomarkers [ΣDEHP (MEHP + MEHHP + MEOHP + MECPP)].
In multivariable-adjusted models, the HR comparing women with MHNCH concentrations above vs. at/below the LOD was 0.96 (95% CI: 0.65, 1.41) (Table 5). This same contrast for MCOCH showed a slightly stronger inverse association with UL (HR: 0.71, 95% CI: 0.41, 1.23), but with a smaller percentage of women above the LOD (11.3%). We also observed stronger inverse associations among women with BMI ≥30 kg/m2 (Table 5).
Table 5.
Baseline DINCH metabolite concentrations and risk of uterine leiomyomata overall and stratified by BMI, SELF cohort
| BMI <30 kg/m2 | BMI ≥30 kg/m2 | ||||
|---|---|---|---|---|---|
|
| |||||
| DINCH Biomarkers (ng/mL)a | #Cases/P-yearsb | Unadjusted HR (95%CI) | Adjusted HRc (95% CI) | Adjusted HRc (95% CI) | Adjusted HRc (95% CI) |
| MHNCHd | |||||
| ≤ LOD | 235/2290 | Reference | Reference | Reference | Reference |
| > LOD | 76/732 | 0.97 (0.68, 1.39) | 0.96 (0.65, 1.41) | 1.00 (0.50, 2.01) | 0.89 (0.55, 1.47) |
| MCOCHe | |||||
| ≤ LOD | 280/2648 | Reference | Reference | Reference | Reference |
| > LOD | 31/374 | 0.71 (0.42, 1.19) | 0.71 (0.41, 1.23) | 0.84 (0.28, 2.47) | 0.59 (0.30, 1.19) |
Detectable vs. non-detectable concentrations.
Results presented for first imputation data set; findings were similar for imputation data sets 1-5. P-years = person-years;
Model adjusted for age at menarche, smoking, alcohol use, BMI, education, parity, age at first birth, years since last birth, history of infertility, fish intake, creatinine, and current hormonal contraceptive use;
MHNCH 76% ≤ LOD of 0.4 ng/mL
MCOCH 89% ≤ LOD of 0.5 ng/mL;
Using quantile g-computation, the adjusted HR per quartile increase in joint phthalate biomarker concentrations was 0.90 (95% CI: 0.73, 1.08) (Table 6). This model evaluated the joint effect of urinary phthalate biomarker concentrations—including MBP, MHBP, MiBP, MHiBP, MBzP, MEHHP, MEHP, MEOHP, MECPP, MEP, MCOP, MNP, MCPP and MCNP—on UL incidence. Biomarkers MiBP and MECPP were assigned the largest negative weights and MEOHP was assigned the largest positive weight within the model (Figure 3).
Table 6.
Quantile g-computation estimates per quartile increase in mixture of cumulatively-averaged creatinine standardized phthalate biomarker concentrations and risk of uterine leiomyomata, SELF cohort
Hazard ratio for a joint quartile increase in biomarker concentrations.
Results presented for first imputation data set; findings were similar for imputation data sets 1-5.
Model adjusted for age enrolled, age at menarche, smoking, alcohol use, BMI, education, parity, age at first birth, years since last birth, history of infertility, fish intake, creatinine, and current hormonal contraceptive use.
Includes mono-n-butyl phthalate (MBP), mono-hydroxybutyl phthalate (MHBP), mono-isobutyl phthalate (MiBP), mono-hydroxyisobutyl phthalate (MHiBP), Monobenzyl phthalate (MBzP), mono(2-ethyl-5-hydroxyhexyl) phthalate (MEHHP), mono(2-ethylhexyl) phthalate (MEHP), mono(2-ethyl-5-oxohexyl) phthalate (MEOHP), mono(2-ethyl-5-carboxypentyl) phthalate (MECPP), monoethyl phthalate (MEP), mono carboxyisooctyl phthalate (MCOP), mono-isononyl phthalate (MNP), mono-3-carboxypropyl phthalate (MCPP) and mono carboxyisononyl phthalate (MCNP).
Figure 3. Weights corresponding to the proportion of the positive or negative partial effect per phthalate biomarker in the quantile g-computation model.
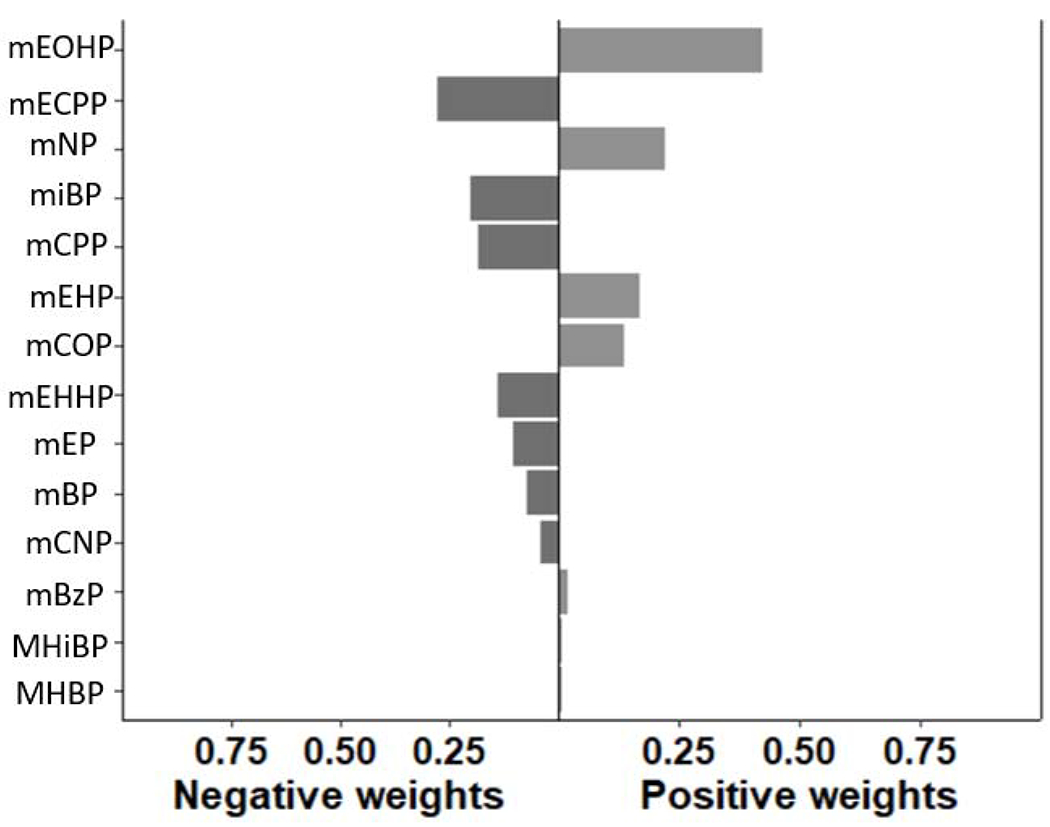
The length of the bars corresponds to the effect size only relative to other effects in the same direction. The darker shading in the negative direction indicates overall mixtures effect in that direction. Results presented for first imputation data set; findings were similar for other imputation data sets.
4. Discussion
In this cohort of reproductive-aged Black women, urinary concentrations of phthalate and phthalate alternative biomarkers were not appreciably associated with UL incidence. In general, urinary concentrations of most individual phthalate biomarkers showed moderate-to-weak inverse associations with UL incidence, with the exception of a positive association for MEHP concentrations across quartiles when compared with the lowest quartile, though estimates were imprecise. The inverse associations of greatest magnitude were observed for MHiBP and MiBP, metabolites of dibutyl phthalates, when comparing highest vs. lowest quartiles of biomarker concentrations. We observed no evidence of dose-response relationships for most biomarkers. DINCH biomarkers showed weak to moderate inverse associations with UL incidence when comparing detectable vs. nondetectable concentrations. Additionally, we observed little evidence of an association between the phthalate biomarkers mixture and UL incidence.
Results from previous epidemiologic studies of the association between urinary phthalate biomarkers and UL have been inconsistent. However, studies have been limited in design (i.e., cross-sectional or case-control studies), sample size, exposure and outcome assessment, and analysis (e.g., evaluation of individual phthalates). A small case-control study of Korean women (30 cases and 27 controls) reported a positive association between the log-transformed creatinine-adjusted urinary molar sum of four DEHP biomarkers (MEHP, MEHHP, MEOHP, MECPP) and ultrasound-detected UL, but there was little evidence of association for individual biomarkers including MiBP, MBzP, and MEP (Kim et al., 2016). In a case-control study of Chinese women (n=61 for each group), log-transformed creatinine-adjusted urinary concentrations of some individual phthalate metabolites, including MnBP and MEHP, were positively associated with UL confirmed histopathologically after hysterectomy or myomectomy (Sun et al., 2016). Additionally, in a case-control study of Taiwanese women (36 UL cases and 29 controls) higher urinary MEHP concentrations were associated with increased odds of histopathologically-confirmed UL (Huang et al., 2010). The same group of researchers reported that two polymorphisms of genes known to be involved in estrogen biosynthesis and function modulated the association between phthalate exposure and UL risk (Huang et al., 2014).
In contrast, in a study of an operative sample of women in the U.S. that were scheduled for laparoscopy or laparotomy, there was little association between urinary phthalate biomarkers and UL risk across most phthalate monoesters (UL N=99, no UL N=374) (Pollack et al., 2015). In the largest of all epidemiologic studies on the topic, a cross-sectional analysis of 1,227 women in the National Health and Nutrition Examination Survey (NHANES), women with a history of UL tended to have higher urinary MBP concentrations and lower urinary MEHP concentrations, although both associations were imprecise and UL was self-reported (Weuve et al., 2010). This study also reported little association for MEP, MBzP, and MEHHP. More recently, a cross-sectional case series analysis of 57 U.S. women undergoing inpatient surgery for UL reported positive associations between urinary phthalate metabolites and uterine volume (Zota et al., 2019).
Overall, our results disagree with some of the prior literature on urinary phthalate biomarkers and UL. Previous studies had some methodological limitations that we addressed, including exposure assessment occurring after case diagnosis for the case-control studies, the inability to establish temporality in cross-sectional studies, and the lack of a control group. We observed weak-to-moderate inverse associations between most individual phthalate biomarkers and UL, with the exception of positive associations across all quartiles (compared to the lowest quartile) for the DEHP metabolite, MEHP. We also observed positive associations for ΣDEHP, but only when comparing extreme quartiles of exposure. There was no evidence of a dose-response relationship across quartiles of most biomarkers.
In the quantile g-computation analyses, we observed little evidence that phthalate biomarkers act jointly to affect UL incidence. MEOHP demonstrated the strongest positive weight and MECPP and MiBP demonstrated the strongest negative weights. This negative weight ranking of MiBP and MECPP was in accord with individual biomarker models, as was the positive ranking for MEHP, although the positive ranking for MEOHP contrasted with the direction of individual biomarker models. A limitation of quantile g-computation is that model specifications such as nonlinearity and interactions must be known and specified prior to modeling. Quantile g-computation also does not model potential interactions between exposures. Further, we assumed linearity given that individual associations for most phthalates appeared linear. However, this approach may be expanded further to include application of nonlinear mixtures associations.
Several experimental studies indicate that phthalates may adversely affect reproductive function by interfering with folliculogenesis, steroidogenesis, and oocyte development (Bonilla and del Mazo, 2010; Hannon and Flaws, 2015; Kim et al., 2002; Li et al., 2014). Phthalates have also been shown to disrupt sex steroid hormones. Specifically, consistent evidence supports that some phthalates and their metabolites exhibit anti-androgenic properties, where doses of DEHP, di-n-butyl phthalate (DBP), or benzylbutyl phthalate (BzBP) reduced testosterone concentrations in male animals and induced ovarian anomalies in female animals (Ema et al., 2000; Gray et al., 2006; Jarfelt et al., 2005; Mylchreest et al., 1999; Mylchreest and Foster, 2000; Parks et al., 2000). However, literature on the estrogenic activity of specific phthalates is inconclusive (Chen et al., 2014; Craig et al., 2013; Davis et al., 1994; Hannon and Flaws, 2015; Lovekamp and Davis, 2001; Lovekamp-Swan and Davis, 2003; Okubo et al., 2003). Notably, only a limited number of parent phthalates and metabolites have been investigated for hormone activity in experimental literature. Moreover, species-specific and cell-specific findings are often difficult to translate to the whole human body.
One pathway that may explain the observed inverse associations is the anti-androgenic effect of specific phthalates, which have been detailed in previous in epidemiologic studies (Meeker and Ferguson, 2014; Sathyanarayana et al., 2014) and toxicology studies of reproductive health outcomes (Ema et al., 2000; Gray et al., 2006; Jarfelt et al., 2005; Mylchreest et al., 1999; Mylchreest and Foster, 2000; Parks et al., 2000), and were cited by Parada et al. 2018 after reporting inverse associations between eight urinary phthalate metabolite concentrations and breast cancer incidence, rather than UL (Parada et al., 2018). The literature on the association between androgen levels and UL is limited, but includes a large U.S. prospective cohort study (Study of Women’s Health Across the Nation), which found that higher concentrations of circulating testosterone were associated with a greater incidence of UL during 13 years of follow-up (Wong et al., 2016). Our findings of possible effect modification by BMI on the association between weighted ΣAA concentrations and UL incidence are also supported by studies indicating reduced circulating concentrations of SHBG in women with higher BMI (Azziz, 1989; Lukanova et al., 2004). In this hyperandrogenic environment (Hogeveen et al., 2002), anti-androgenic phthalates may appear more protective. Still, there is no concrete knowledge of the particular mechanism by which androgen activity influences UL incidence, and this proposed mechanism is speculative and may only be one of many factors affecting UL incidence.
Within our analysis, the only positive association across quartiles was observed for the DEHP metabolite, MEHP. This finding may suggest a potential alternative pathway for specific DEHP metabolites, such as activation of signaling pathways for UL (Borahay et al., 2017). One in vitro study evaluating human myometrial and UL cells from 53 women with histologic evidence of UL and 33 surgical controls showed direct effects of DEHP on human UL cells, including increased cellular viability and proliferation in both normal myometrial as well as UL cells (Kim et al., 2017). However, this work was conducted on a small sample of cells, with a control group that was comprised of other benign gynecologic conditions, and results were not validated in in vivo models. Future research should explicitly investigate potential mechanisms of specific phthalates on UL, including DEHP metabolites.
Limitations of this study include that UL growth rates can vary widely, both among women and between neoplasms within the same woman (Peddada et al, 2008). These characteristics make it more difficult to assign a follow-up period that is long enough to allow for detection of UL incidence but short enough to determine when a UL occurred more precisely. We evaluated phthalates and UL incidence over a 5-year period. Due to the study’s age range restriction, we did not evaluate the presence of UL through the postmenopausal years, when UL incidence typically declines (Marshall et al., 1997; Velebil et al., 1995; Whiteman et al., 2010), nor did we examine associations among younger women (age<23 years). We therefore may not be capturing an important part of the etiologic window for UL development if, for example, EDCs are associated with early incidence of UL. As younger women would have less opportunity to develop UL prior to enrollment, we stratified our analysis by median age to evaluate the extent to which phthalate-UL associations varied by age (Table S4). In age-stratified analyses, we still observed inconsistent evidence for an association. Additionally, most UL detected in this cohort are newly-detected, small, and potentially on the less severe end of the overall severity spectrum. Thus, the present study examined the influence of phthalate and DINCH exposure on tumor incidence, not UL growth.
Exposures to phthalates and phthalate alternatives are episodic and thus biomarker concentrations have been shown to vary within a day, across days and across weeks/months. Phthalates (and DINCH) have short half-lives and do not bioaccumulate in the body. Thus, biomarker concentrations measured during the follow-up period may not be representative of longer-term exposure. To reduce exposure measurement error, we collected repeated phthalate measurements at multiple time points (baseline, 20-month, and 40-month visits). We cumulatively-averaged these repeated measures for the analysis, which may also reflect exposures more chronically over months or years and reduces measurement error. Our exposure assessment is an improvement over previous studies as the measures likely preceded UL development, and the repeated biomarker measures allows us to estimate longer-term exposure. However, the first morning urine voids may underestimate exposure to phthalates for individuals not exposed to phthalates and phthalate containing products overnight. Another limitation of our study is that results may not be generalizable to women outside of the demographic and exposure characteristics of our sample (i.e., Black women aged of 23-35 years with an average BMI of 34 kg/m2) (Table 1). On the other hand, Black women are an understudied population with a greater incidence of UL and generally higher chemical exposures. As such, our study fills an important gap in the literature.
To our knowledge, this is the first study to prospectively evaluate associations of urinary concentrations of individual biomarkers of phthalates and the DINCH alternatives with UL incidence in a population-based cohort, to use transvaginal ultrasound to systematically screen all women for UL at all study visits, and to evaluate joint effects of phthalates biomarkers on UL incidence. Additional strengths of SELF include its prospective design with repeated collection of biomarkers among reproductive-aged women. Repeated exposure biomarker measures facilitated the establishment of temporal trends, accounting for intra-individual variation of phthalate concentrations over time. Additionally, our sample was larger than most previous studies on this topic and we were able to evaluate both individual and multiple phthalate exposures. The use of transvaginal ultrasound within this study reduced potential for outcome misclassification. Our study also addresses potential for outcome misclassification by requiring that all ultrasound technicians have at least 3 years of experience in gynecologic ultrasounds, special training on the study protocol to assure standardized assessments, and ongoing quality control evaluations of archived images.
5. Conclusion
In summary, urinary concentrations of specific phthalate and phthalate alternative biomarkers were generally not associated with higher risk of UL among reproductive-aged Black women, when concentrations where evaluated individually or as a mixture. Although our findings suggest a potential lower incidence of UL among women with higher biomarker concentrations of specific phthalates and phthalate alternatives, these results nonetheless raise important questions about potential plasticizer-specific hormonal influences on UL development and on additional aspects of reproductive health.
Supplementary Material
Highlights.
Phthalates widely detected among a cohort of reproductive-aged Black women
Biomarkers generally showed weak-to-moderate inverse associations with UL incidence
Inverse associations stronger among women with BMI≥30 kg/m2 for specific phthalates
Little evidence of effect of the phthalate biomarkers mixture on UL incidence
Funding:
This work was funded by research from the National Institutes of Health [R01-ES024749, T32ES014562]. In addition, the research was supported in part by the Intramural Research Program of the National Institute of Environmental Health Sciences and in part by funds allocated for health research by the American Recovery and Reinvestment Act. The funding sources had no role in study design; collection, analysis, and interpretation of data; writing of the report; or in the decision to submit the article for publication.
Footnotes
Publisher's Disclaimer: This is a PDF file of an unedited manuscript that has been accepted for publication. As a service to our customers we are providing this early version of the manuscript. The manuscript will undergo copyediting, typesetting, and review of the resulting proof before it is published in its final form. Please note that during the production process errors may be discovered which could affect the content, and all legal disclaimers that apply to the journal pertain.
The authors declare they have no actual or potential competing financial interests.
Publisher's Disclaimer: Disclaimer: The findings and conclusions in this report are those of the authors and do not necessarily represent the official position of the Centers for Disease Control and Prevention. Use of trade names is for identification only and does not imply endorsement by the CDC, the Public Health Service, or the U.S. Department of Health and Human Services.
References
- Andersen J, 1996. Growth factors and cytokines in uterine leiomyomas. Semin. Reprod. Endocrinol 14, 269–282. 10.1055/s-2007-1016336 [DOI] [PubMed] [Google Scholar]
- Andersen J, Barbieri RL, 1995. Abnormal gene expression in uterine leiomyomas. J. Soc. Gynecol. Investig 2, 663–672. [DOI] [PubMed] [Google Scholar]
- ATSDR (Agency for Toxic Substances and Disease Registry), 2002. Toxicological Profile: Di(2-ethylhexyl)phthalate (DEHP) [WWW Document]. URL https://www.atsdr.cdc.gov/toxprofiles/tp.asp?id=684&tid=65 (accessed 6.27.19). [PubMed]
- ATSDR (Agency for Toxic Substances and Disease Registry), 2001. Toxicological Profile: Di-n-butyl Phthalate [WWW Document]. URL https://www.atsdr.cdc.gov/toxprofiles/tp.asp?id=859&tid=167 (accessed 6.27.19). [PubMed]
- ATSDR (Agency for Toxic Substances and Disease Registry), 1995. Toxicological Profile: Diethyl phthalate [WWW Document]. URL https://www.atsdr.cdc.gov/toxprofiles/TP.asp?id=603&tid=112 (accessed 6.27.19). [PubMed]
- Azziz R, 1989. Reproductive endocrinologic alterations in female asymptomatic obesity. Fertil. Steril 52, 703–725. 10.1016/s0015-0282(16)61020-8 [DOI] [PubMed] [Google Scholar]
- Baird D, Dunson DB, Hill MC, Cousins D, Schectman JM, 2003. High cumulative incidence of uterine leiomyoma in black and white women: Ultrasound evidence. American Journal of Obstetrics and Gynecology 188, 100–107. 10.1067/mob.2003.99 [DOI] [PubMed] [Google Scholar]
- Baird DD, Harmon QE, Upson K, Moore KR, Barker-Cummings C, Baker S, Cooper T, Wegienka G, 2015. A Prospective, Ultrasound-Based Study to Evaluate Risk Factors for Uterine Fibroid Incidence and Growth: Methods and Results of Recruitment. J Womens Health (Larchmt) 24, 907–915. 10.1089/jwh.2015.5277 [DOI] [PMC free article] [PubMed] [Google Scholar]
- Barr Dana B, Wilder Lynn C, Caudill Samuel P, Gonzalez Amanda J, Needham Lance L, Pirkle James L, 2005. Urinary Creatinine Concentrations in the U.S. Population: Implications for Urinary Biologic Monitoring Measurements. Environmental Health Perspectives 113, 192–200. 10.1289/ehp.7337 [DOI] [PMC free article] [PubMed] [Google Scholar]
- Bethea TN, Wesselink AK, Weuve J, McClean MD, Hauser R, Williams PL, Ye X, Calafat AM, Baird DD, Wise LA, 2019. Correlates of exposure to phenols, parabens, and triclocarban in the Study of Environment, Lifestyle and Fibroids. Journal of Exposure Science & Environmental Epidemiology 1. 10.1038/s41370-019-0114-9 [DOI] [PMC free article] [PubMed] [Google Scholar]
- Block G, Hartman AM, Naughton D, 1990. A reduced dietary questionnaire: development and validation. Epidemiology 1, 58–64. 10.1097/00001648-199001000-00013 [DOI] [PubMed] [Google Scholar]
- Blount BC, Silva MJ, Caudill SP, Needham LL, Pirkle JL, Sampson EJ, Lucier GW, Jackson RJ, Brock JW, 2000. Levels of seven urinary phthalate metabolites in a human reference population. Environ Health Perspect 108, 979–982. [DOI] [PMC free article] [PubMed] [Google Scholar]
- Bonilla E, del Mazo J, 2010. Deregulation of the Sod1 and Nd1 genes in mouse fetal oocytes exposed to mono-(2-ethylhexyl) phthalate (MEHP). Reprod. Toxicol 30, 387–392. 10.1016/j.reprotox.2010.04.008 [DOI] [PubMed] [Google Scholar]
- Borahay MA, Asoglu MR, Mas A, Adam S, Kilic GS, Al-Hendy A, 2017. Estrogen Receptors and Signaling in Fibroids: Role in Pathobiology and Therapeutic Implications. Reprod Sci 24, 1235–1244. 10.1177/1933719116678686 [DOI] [PMC free article] [PubMed] [Google Scholar]
- Boucher B, Cotterchio M, Kreiger N, Nadalin V, Block T, Block G, 2006. Validity and reliability of the Block98 food-frequency questionnaire in a sample of Canadian women. Public Health Nutr 9, 84–93. 10.1079/phn2005763 [DOI] [PubMed] [Google Scholar]
- Brasky TM, Bethea TN, Wesselink AK, Wegienka GR, Baird DD, Wise LA, 2020. Dietary Fat Intake and Risk of Uterine Leiomyomata: A Prospective Ultrasound Study. Am. J. Epidemiol 10.1093/aje/kwaa097 [DOI] [PMC free article] [PubMed] [Google Scholar]
- Bui TT, Giovanoulis G, Cousins AP, Magnér J, Cousins IT, de Wit CA, 2016. Human exposure, hazard and risk of alternative plasticizers to phthalate esters. Science of The Total Environment 541, 451–467. 10.1016/j.scitotenv.2015.09.036 [DOI] [PubMed] [Google Scholar]
- Cardozo ER, CLARK AD, BANKS NK, HENNE MB, STEGMANN BJ, SEGARS JH, 2012. The Estimated Annual Cost of Uterine Leiomyomata in the United States. Am J Obstet Gynecol 206, 211.e1–211.e9. 10.1016/j.ajog.2011.12.002 [DOI] [PMC free article] [PubMed] [Google Scholar]
- Carrico C, Gennings C, Wheeler DC, Factor-Litvak P, 2015. Characterization of Weighted Quantile Sum Regression for Highly Correlated Data in a Risk Analysis Setting. J Agric Biol Environ Stat 20, 100–120. 10.1007/s13253-014-0180-3 [DOI] [PMC free article] [PubMed] [Google Scholar]
- Centers for Disease Control (CDC), 2016. National Biomonitoring Program Factsheet - Phthalates [WWW Document]. URL https://www.cdc.gov/biomonitoring/phthalates_factsheet.html (accessed 3.18.17).
- Coronado GD, Marshall LM, Schwartz SM, 2000. Complications in pregnancy, labor, and delivery with uterine leiomyomas: a population-based study. Obstetrics & Gynecology 95, 764–769. 10.1016/S0029-7844(99)00605-5 [DOI] [PubMed] [Google Scholar]
- Craig Zelieann R., Hannon Patrick R., Wang Wei, Ziv-Gal Ayelet, and Flaws Jodi A.. “Di-n-Butyl Phthalate Disrupts the Expression of Genes Involved in Cell Cycle and Apoptotic Pathways in Mouse Ovarian Antral Follicles.” Biology of Reproduction 88, no. 1 (January 1, 2013). 10.1095/biolreprod.112.105122. [DOI] [PMC free article] [PubMed] [Google Scholar]
- Crespo JE, Balart R, Sanchez L, López J, 2007. Substitution of di(2-ethylhexyl) phthalate by di(isononyl) cyclohexane-1,2-dicarboxylate as a plasticizer for industrial vinyl plastisol formulations. Journal of Applied Polymer Science 104, 1215–1220. 10.1002/app.25760 [DOI] [Google Scholar]
- Davis BJ, Maronpot RR, Heindel JJ, 1994. Di-(2-ethylhexyl) Phthalate Suppresses Estradiol and Ovulation in Cycling Rats. Toxicology and Applied Pharmacology 128, 216–223. 10.1006/taap.1994.1200 [DOI] [PubMed] [Google Scholar]
- Department of Health and Human Services, 2009. National Report on Human Exposure to Environmental Chemicals [WWW Document]. URL https://www.cdc.gov/exposurereport/pdf/fourthreport.pdf (accessed 3.18.17).
- Dueholm M, Lundorf E, Hansen ES, Ledertoug S, Olesen F, 2002. Accuracy of magnetic resonance imaging and transvaginal ultrasonography in the diagnosis, mapping, and measurement of uterine myomas. Am. J. Obstet. Gynecol 186, 409–415. [DOI] [PubMed] [Google Scholar]
- Eltoukhi HM, Modi MN, Weston M, Armstrong AY, Stewart EA, 2014. The health disparities of uterine fibroid tumors for African American women: a public health issue. Am. J. Obstet. Gynecol 210, 194–199. 10.1016/j.ajog.2013.08.008 [DOI] [PMC free article] [PubMed] [Google Scholar]
- Ema M, Miyawaki E, Kawashima K, 2000. Critical period for adverse effects on development of reproductive system in male offspring of rats given di-n-butyl phthalate during late pregnancy. Toxicology Letters 111, 271–278. 10.1016/S0378-4274(99)00192-7 [DOI] [PubMed] [Google Scholar]
- Environmental Protection Agency (EPA), 2012. Phthalates Action Plan. [Google Scholar]
- Fu Z, Zhao F, Chen K, Xu J, Li P, Xia D, Wu Y, 2017. Association between urinary phthalate metabolites and risk of breast cancer and uterine leiomyoma. Reproductive Toxicology 74, 134–142. 10.1016/j.reprotox.2017.09.009 [DOI] [PubMed] [Google Scholar]
- Graham John W., Olchowski Allison E., and Gilreath Tamika D., 2007. “How Many Imputations Are Really Needed? Some Practical Clarifications of Multiple Imputation Theory.” Prevention Science 8, no. 3: 206–13. 10.1007/s11121-007-0070-9. [DOI] [PubMed] [Google Scholar]
- Gray LE, Laskey J, Ostby J, 2006. Chronic di-n-butyl phthalate exposure in rats reduces fertility and alters ovarian function during pregnancy in female Long Evans hooded rats. Toxicol. Sci 93, 189–195. 10.1093/toxsci/kfl035 [DOI] [PubMed] [Google Scholar]
- Hannon PR, Flaws JA, 2015. The Effects of Phthalates on the Ovary. Front. Endocrinol 6. 10.3389/fendo.2015.00008 [DOI] [PMC free article] [PubMed] [Google Scholar]
- Hogeveen KN, Cousin P, Pugeat M, Dewailly D, Soudan B, Hammond GL, 2002. Human sex hormone–binding globulin variants associated with hyperandrogenism and ovarian dysfunction. J Clin Invest 109, 973–981. 10.1172/JCI14060 [DOI] [PMC free article] [PubMed] [Google Scholar]
- Hornung RW, Reed LD, 1990. Estimation of Average Concentration in the Presence of Nondetectable Values. Applied Occupational and Environmental Hygiene 5, 46–51. 10.1080/1047322X.1990.10389587 [DOI] [Google Scholar]
- Huang P-C, Li W-F, Liao P-C, Sun C-W, Tsai E-M, Wang S-L, 2014. Risk for estrogen-dependent diseases in relation to phthalate exposure and polymorphisms of CYP17A1 and estrogen receptor genes. Environ Sci Pollut Res 21, 13964–13973. 10.1007/s11356-014-3260-6 [DOI] [PubMed] [Google Scholar]
- Huang P-C, Tsai E-M, Li W-F, Liao P-C, Chung M-C, Wang Y-H, Wang S-L, 2010. Association between phthalate exposure and glutathione S-transferase M1 polymorphism in adenomyosis, leiomyoma and endometriosis. Hum. Reprod 25, 986–994. 10.1093/humrep/deq015 [DOI] [PubMed] [Google Scholar]
- Huyck KL, Panhuysen CIM, Cuenco KT, Zhang J, Goldhammer H, Jones ES, Somasundaram P, Lynch AM, Harlow BL, Lee H, Stewart EA, Morton CC, 2008. The impact of race as a risk factor for symptom severity and age at diagnosis of uterine leiomyomata among affected sisters. American Journal of Obstetrics and Gynecology 198, 168.e1–168.e9. 10.1016/j.ajog.2007.05.038 [DOI] [PMC free article] [PubMed] [Google Scholar]
- Jarfelt K, Dalgaard M, Hass U, Borch J, Jacobsen H, Ladefoged O, 2005. Antiandrogenic effects in male rats perinatally exposed to a mixture of di(2-ethylhexyl) phthalate and di(2-ethylhexyl) adipate. Reprod. Toxicol 19, 505–515. 10.1016/j.reprotox.2004.11.005 [DOI] [PubMed] [Google Scholar]
- Keil AP, Buckley JP, O’Brien KM, Ferguson KK, Zhao S, White AJ, 2020. A Quantile-Based g-Computation Approach to Addressing the Effects of Exposure Mixtures. Environ. Health Perspect 128, 47004. 10.1289/EHP5838 [DOI] [PMC free article] [PubMed] [Google Scholar]
- Kim E-J, Kim J-W, Lee S-K, 2002. Inhibition of oocyte development in Japanese medaka (Oryzias latipes) exposed to di-2-ethylhexyl phthalate. Environ Int 28, 359–365. [DOI] [PubMed] [Google Scholar]
- Kim JH, Kim SH, Oh YS, Ihm HJ, Chae HD, Kim C-H, Kang BM, 2017. In vitro effects of phthalate esters in human myometrial and leiomyoma cells and increased urinary level of phthalate metabolite in women with uterine leiomyoma. Fertil. Steril 107, 1061–1069.e1. 10.1016/j.fertnstert.2017.01.015 [DOI] [PubMed] [Google Scholar]
- Kim YA, Kho Y, Chun KC, Koh JW, Park JW, Bunderson-Schelvan M, Cho YH, 2016. Increased Urinary Phthalate Levels in Women with Uterine Leiomyoma: A Case-Control Study. Int J Environ Res Public Health 13. 10.3390/ijerph13121247 [DOI] [PMC free article] [PubMed] [Google Scholar]
- Kjerulff KH, Langenberg P, Seidman JD, Stolley PD, Guzinski GM, 1996. Uterine leiomyomas. Racial differences in severity, symptoms and age at diagnosis. J Reprod Med 41, 483–490. [PubMed] [Google Scholar]
- Kontopantelis E, White IR, Sperrin M, Buchan I, 2017. Outcome-sensitive multiple imputation: a simulation study. BMC Medical Research Methodology 17, 2. 10.1186/s12874-016-0281-5 [DOI] [PMC free article] [PubMed] [Google Scholar]
- Li L, Zhang T, Qin X-S, Ge W, Ma H-G, Sun L-L, Hou Z-M, Chen H, Chen P, Qin G-Q, Shen W, Zhang X-F, 2014. Exposure to diethylhexyl phthalate (DEHP) results in a heritable modification of imprint genes DNA methylation in mouse oocytes. Mol. Biol. Rep 41, 1227–1235. 10.1007/s11033-013-2967-7 [DOI] [PubMed] [Google Scholar]
- Lovekamp TN, Davis BJ, 2001. Mono-(2-ethylhexyl) Phthalate Suppresses Aromatase Transcript Levels and Estradiol Production in Cultured Rat Granulosa Cells. Toxicology and Applied Pharmacology 172, 217–224. 10.1006/taap.2001.9156 [DOI] [PubMed] [Google Scholar]
- Lovekamp-Swan T, Davis BJ, 2003. Mechanisms of phthalate ester toxicity in the female reproductive system. Environ Health Perspect 111, 139–145. [DOI] [PMC free article] [PubMed] [Google Scholar]
- Lukanova A, Lundin E, Micheli A, Arslan A, Ferrari P, Rinaldi S, Krogh V, Lenner P, Shore RE, Biessy C, Muti P, Riboli E, Koenig KL, Levitz M, Stattin P, Berrino F, Hallmans G, Kaaks R, Toniolo P, Zeleniuch-Jacquotte A, 2004. Circulating levels of sex steroid hormones and risk of endometrial cancer in postmenopausal women. Int. J. Cancer 108, 425–432. 10.1002/ijc.11529 [DOI] [PubMed] [Google Scholar]
- Marshall LM, Spiegelman D, Barbieri RL, Goldman MB, Manson JE, Colditz GA, Willett WC, Hunter DJ, 1997. Variation in the incidence of uterine leiomyoma among premenopausal women by age and race. Obstet Gynecol 90, 967–973. [DOI] [PubMed] [Google Scholar]
- Meeker JD, Ferguson KK, 2014. Urinary phthalate metabolites are associated with decreased serum testosterone in men, women, and children from NHANES 2011-2012. J. Clin. Endocrinol. Metab 99, 4346–4352. 10.1210/jc.2014-2555 [DOI] [PMC free article] [PubMed] [Google Scholar]
- Merrill RM, 2008. Hysterectomy surveillance in the United States, 1997 through 2005. Med. Sci. Monit 14, CR24–31. [PubMed] [Google Scholar]
- Mylchreest E, Foster PM, 2000. DBP exerts its antiandrogenic activity by indirectly interfering with androgen signaling pathways. Toxicol. Appl. Pharmacol 168, 174–175. 10.1006/taap.2000.9031 [DOI] [PubMed] [Google Scholar]
- Mylchreest E, Sar M, Cattley RC, Foster PM, 1999. Disruption of androgen-regulated male reproductive development by di(n-butyl) phthalate during late gestation in rats is different from flutamide. Toxicol. Appl. Pharmacol 156, 81–95. 10.1006/taap.1999.8643 [DOI] [PubMed] [Google Scholar]
- National Institute of Environmental Health Sciences (NIEHS), 2019. Endocrine Disruptors. [Google Scholar]
- Niehoff NM, Keil AP, O’Brien KM, Jackson BP, Karagas MR, Weinberg CR, White AJ, 2020. Metals and trace elements in relation to body mass index in a prospective study of US women. Environ. Res 184, 109396. 10.1016/j.envres.2020.109396 [DOI] [PMC free article] [PubMed] [Google Scholar]
- O’Brien KM, Upson K, Cook NR, Weinberg CR, 2016. Environmental Chemicals in Urine and Blood: Improving Methods for Creatinine and Lipid Adjustment. Environ Health Perspect 124, 220–227. 10.1289/ehp.1509693 [DOI] [PMC free article] [PubMed] [Google Scholar]
- Okolo S, 2008. Incidence, aetiology and epidemiology of uterine fibroids. Best Pract Res Clin Obstet Gynaecol 22, 571–588. 10.1016/j.bpobgyn.2008.04.002 [DOI] [PubMed] [Google Scholar]
- Okubo Tomoko, Suzuki Toshinari, Yokoyama Yoshiko, Kano Kazutaka, and Kano Itsu. “Estimation of Estrogenic and Anti-Estrogenic Activities of Some Phthalate Diesters and Monoesters by MCF-7 Cell Proliferation Assay in Vitro.” Biological and Pharmaceutical Bulletin 26, no. 8 (2003): 1219–24. 10.1248/bpb.26.1219. [DOI] [PubMed] [Google Scholar]
- Parada H, Gammon MD, Chen J, Calafat AM, Neugut AI, Santella RM, Wolff MS, Teitelbaum SL, 2018. Urinary Phthalate Metabolite Concentrations and Breast Cancer Incidence and Survival following Breast Cancer: The Long Island Breast Cancer Study Project. Environ Health Perspect 126, 047013. 10.1289/EHP2083 [DOI] [PMC free article] [PubMed] [Google Scholar]
- Parks LG, Ostby JS, Lambright CR, Abbott BD, Klinefelter GR, Barlow NJ, Gray LE, 2000. The plasticizer diethylhexyl phthalate induces malformations by decreasing fetal testosterone synthesis during sexual differentiation in the male rat. Toxicol. Sci 58, 339–349. 10.1093/toxsci/58.2.339 [DOI] [PubMed] [Google Scholar]
- Paul DR, Rhodes DG, Kramer M, Baer DJ, Rumpler WV, 2005. Validation of a Food Frequency Questionnaire by Direct Measurement of Habitual ad Libitum Food Intake. American Journal of Epidemiology 162, 806–814. 10.1093/aje/kwi279 [DOI] [PubMed] [Google Scholar]
- Peddada SD, Laughlin SK, Miner K, Guyon J-P, Haneke K, Vahdat HL, Semelka RC, Kowalik A, Armao D, Davis B, Baird DD, 2008. Growth of uterine leiomyomata among premenopausal black and white women. Proceedings of the National Academy of Sciences 105, 19887–19892. 10.1073/pnas.0808188105 [DOI] [PMC free article] [PubMed] [Google Scholar]
- Pedersen AB, Mikkelsen EM, Cronin-Fenton D, Kristensen NR, Pham TM, Pedersen L, Petersen I, 2017. Missing data and multiple imputation in clinical epidemiological research. Clin Epidemiol 9, 157–166. 10.2147/CLEP.S129785 [DOI] [PMC free article] [PubMed] [Google Scholar]
- Pollack AZ, Buck Louis GM, Chen Z, Sun L, Trabert B, Guo Y, Kannan K, 2015. Bisphenol A, benzophenone-type ultraviolet filters, and phthalates in relation to uterine leiomyoma. Environ. Res 137, 101–107. 10.1016/j.envres.2014.06.028 [DOI] [PMC free article] [PubMed] [Google Scholar]
- Rubin, 2004. Multiple Imputation for Nonresponse in Surveys. John Wiley & Sons Inc, New York, United States. [Google Scholar]
- Rudel RA, Camann DE, Spengler JD, Korn LR, Brody JG, 2003. Phthalates, alkylphenols, pesticides, polybrominated diphenyl ethers, and other endocrine-disrupting compounds in indoor air and dust. Environ. Sci. Technol 37, 4543–4553. [DOI] [PubMed] [Google Scholar]
- Sathyanarayana S, Barrett E, Butts S, Wang C, Swan SH, 2014. Phthalate Exposure and Reproductive Hormone Concentrations in Pregnancy. Reproduction 147, 401–409. 10.1530/REP-13-0415 [DOI] [PMC free article] [PubMed] [Google Scholar]
- Schafer JL, and Olsen MK, 1998. “Multiple Imputation for Multivariate Missing-Data Problems: A Data Analyst’s Perspective.” Multivariate Behavioral Research 33, no. 4: 545–71. 10.1207/s15327906mbr3304_5. [DOI] [PubMed] [Google Scholar]
- Silva MJ, Barr DB, Reidy JA, Malek NA, Hodge CC, Caudill SP, Brock JW, Needham LL, Calafat AM, 2004. Urinary levels of seven phthalate metabolites in the U.S. population from the National Health and Nutrition Examination Survey (NHANES) 1999-2000. Environ Health Perspect 112, 331–338. [DOI] [PMC free article] [PubMed] [Google Scholar]
- Silva MJ, Jia T, Samandar E, Preau JL, Calafat AM, 2013. Environmental exposure to the plasticizer 1,2-cyclohexane dicarboxylic acid, diisononyl ester (DINCH) in U.S. adults (2000-2012). Environ. Res 126, 159–163. 10.1016/j.envres.2013.05.007 [DOI] [PMC free article] [PubMed] [Google Scholar]
- Snowden JM, Rose S, Mortimer KM, 2011. Implementation of G-computation on a simulated data set: demonstration of a causal inference technique. Am. J. Epidemiol 173, 731–738. 10.1093/aje/kwq472 [DOI] [PMC free article] [PubMed] [Google Scholar]
- Stewart EA, Cookson C, Gandolfo RA, Schulze-Rath R, 2017. Epidemiology of uterine fibroids: a systematic review. BJOG: Int J Obstet Gy n/a-n/a. 10.1111/1471-0528.14640 [DOI] [PubMed] [Google Scholar]
- Sun J, Zhang M-R, Zhang L-Q, Zhao D, Li S-G, Chen B, 2016. Phthalate monoesters in association with uterine leiomyomata in Shanghai. Int J Environ Health Res 26, 306–316. 10.1080/09603123.2015.1111310 [DOI] [PubMed] [Google Scholar]
- Therneau TM, Li H, 1999. Computing the Cox model for case cohort designs. Lifetime Data Anal 5, 99–112. [DOI] [PubMed] [Google Scholar]
- van’t Erve TJ, Rosen EM, Barrett ES, Nguyen RHN, Sathyanarayana S, Milne GL, Calafat A,M, Swan SH, Ferguson KK, 2019. Phthalates and phthalate alternatives have diverse associations with oxidative stress and inflammation in pregnant women. Environ Sci Technol 53, 3258–3267. 10.1021/acs.est.8b05729 [DOI] [PMC free article] [PubMed] [Google Scholar]
- Varshavsky JR, Zota AR, Woodruff TJ, 2016. A Novel Method for Calculating Potency-Weighted Cumulative Phthalates Exposure with Implications for Identifying Racial/Ethnic Disparities among U.S. Reproductive-Aged Women in NHANES 2001-2012. Environ. Sci. Technol 50, 10616–10624. 10.1021/acs.est.6b00522 [DOI] [PMC free article] [PubMed] [Google Scholar]
- Velebil P, Wingo PA, Xia Z, Wilcox LS, Peterson HB, 1995. Rate of hospitalization for gynecologic disorders among reproductive-age women in the United States. Obstet Gynecol 86, 764–769. 10.1016/0029-7844(95)00252-M [DOI] [PubMed] [Google Scholar]
- Weuve J, Hauser R, Calafat AM, Missmer SA, Wise LA, 2010. Association of exposure to phthalates with endometriosis and uterine leiomyomata: findings from NHANES, 1999-2004. Environ. Health Perspect 118, 825–832. 10.1289/ehp.0901543 [DOI] [PMC free article] [PubMed] [Google Scholar]
- Whiteman MK, Hillis SD, Jamieson DJ, Morrow B, Podgornik MN, Brett KM, Marchbanks PA, 2008. Inpatient hysterectomy surveillance in the United States, 2000-2004. American Journal of Obstetrics and Gynecology 198, 34.e1–34.e7. 10.1016/j.ajog.2007.05.039 [DOI] [PubMed] [Google Scholar]
- Whiteman MK, Kuklina E, Jamieson DJ, Hillis SD, Marchbanks PA, 2010. Inpatient hospitalization for gynecologic disorders in the United States. Am. J. Obstet. Gynecol 202, 541.e1–6. 10.1016/j.ajog.2009.12.013 [DOI] [PubMed] [Google Scholar]
- Wise LA, Laughlin-Tommaso SK, 2016. Epidemiology of Uterine Fibroids: From Menarche to Menopause. Clin Obstet Gynecol 59, 2–24. 10.1097/GRF.0000000000000164 [DOI] [PMC free article] [PubMed] [Google Scholar]
- Wong JYY, Gold EB, Johnson WO, Lee JS, 2016. Circulating Sex Hormones and Risk of Uterine Fibroids: Study of Women’s Health Across the Nation (SWAN). J Clin Endocrinol Metab 101, 123–130. 10.1210/jc.2015-2935 [DOI] [PMC free article] [PubMed] [Google Scholar]
- Zhou X-H, Eckert GJ, Tierney WM, 2001. Multiple imputation in public health research. Statist. Med 20, 1541–1549. 10.1002/sim.689 [DOI] [PubMed] [Google Scholar]
- Zota AR, Geller RJ, Calafat AM, Marfori CQ, Baccarelli AA, Moawad GN, 2019. Phthalates exposure and uterine fibroid burden among women undergoing surgical treatment for fibroids: a preliminary study. Fertil. Steril 111, 112–121. 10.1016/j.fertnstert.2018.09.009 [DOI] [PMC free article] [PubMed] [Google Scholar]
Associated Data
This section collects any data citations, data availability statements, or supplementary materials included in this article.