

Abstract
Objectives:
To evaluate the effectiveness of CT texture analysis (CTTA) in (1) differentiating Thymoma (THY) from thymic hyperplasia (TH) (2) low from high WHO grade, and (3) low from high Masaoka Koga (MK)/International Thymic Malignancy Interest Group (ITMIG) stages.
Methods:
After institute ethical clearance, this cross-sectional study analyzed 26 patients (THY-18, TH-8) who underwent dual energy CT (DECT) and surgery between January 2016 and December 2018. CTTA was performed using TexRad (Feedback Medical Ltd., Cambridge, UK- www.fbkmed.com) by a single observer. Free hand regions of interest (ROIs) were placed over axial sections where there was maximum enhancement and homogeneity. Filtration histogram was used to generate six first-order texture parameters [mean, standard deviation (SD), mean of positive pixels (MPP), entropy, skewness, and kurtosis] at six spatial scaling factors “SSF 0, 2, 3, 4, 5, and 6”. Mann–Whitney test was applied among various categories and p value < 0.05 was considered significant. Three-step feature selection was performed to determine the best parameters among each category.
Results:
The best performing parameters were (1) THY vs TH- Mean at “SSF 0” (AUC: 0.8889) and MPP at “SSF 0” (AUC: 0.8889), (2) Low vs high WHO grade - no parameter showed statistical significance with good AUC, and (3) Low vs high MK/ITMIG stage- SD at “SSF 6” (AUC: 0.8052 and 0.8333 respectively]).
Conclusion:
CTTA revealed several parameters with excellent diagnostic performance in differentiating thymoma from thymic hyperplasia and MK/ITMIG high vs low stages. CTTA could potentially serve as a non-invasive tool for this stratification.
Advances in knowledge:
This study has employed texture analysis, a novel radiomics method on DECT scans to determine the best performing parameter and their corresponding cut-off values to differentiate among the above-mentioned categories. These new parameters may help add another layer of confidence to non-invasively stratify and prognosticate patients accurately which was only previously possible with a biopsy.
Introduction
Thymoma is the most common previsceral compartment mediastinal neoplasm, constituting up to 50% of all such neoplasms.1 These tumors represent 0.2–1.5% of the total diagnosed adult malignancies with an incidence of about 0.13–0.15/100 000.2,3 There is paucity of imaging studies on thymomas, especially on the role of CT texture analysis (CTTA), warranting more research.
The major subset of patients with thymic pathology also suffer from Myasthenia Gravis (MG) or other diseases like myotonic dystrophy, and even autoimmune cytopenias.4,5 Upto 80% of patients with MG develop thymic lesions (65% thymic hyperplasia and 15% thymomas).6 Diagnosis is vital in this subset as thymectomy is indicated in all cases of thymoma as it is a potentially malignant tumor, and it also results in improvement of the clinical course in MG.7 The prognosis after surgery depends primarily upon the surgical stage and the WHO histological grade.
The Masaoka Koga (MK) system is used for the staging of thymomas. High MK stage tumors (IIb, III, IVa and IVb) have a 5 year survival rate of ~50 to 70% as compared with the low stage tumors which have ~90% survival rate.8 These statistics stand true for the WHO grading as well (high grade defined as grades B2, B3 and C). Predicting these data prospectively on imaging, will help in planning the appropriate course of management and provide prognostic information. A biopsy may also be performed (especially incase of uncertain diagnosis) and may direct the patient to chemotherapy in case of thymic carcinoma/lymphoma.
Thymic hyperplasia is a benign entity but thymectomy is still indicated, as it leads to clinical improvement of myasthenic symptoms in up to 85% of patients and leads to drug free remission in up to 35% of patients.7
CT is the current standard for diagnosis, and relies primarily on the qualitative morphological parameters for differentiating a normal thymus from hyperplasia or thymoma. However, this qualitative approach is not foolproof, as around 20% of thymic hyperplasias appear morphologically similar to thymomas and about 45% of thymic hyperplasias can mimic a normal thymus.6 Hence, quantitative imaging techniques like CTTA could potentially help in this differentiation and further predict the MK/ITMIG stage and the WHO grade of the tumor, thus influencing the management.
CTTA is a quantitative imaging technique under the broader category of radiomics, which assesses tumor heterogeneity at the pixel level by evaluating the distribution and spatial relationship of grayscale pixel values. Multiple studies have shown the efficacy of CTTA in evaluating lung tumors, glioblastomas, breast cancer, colorectal carcinomas and renal cell carcinomas, however there are only scant data on the role of CTTA in evaluating thymic tumors.9
Radiomics using texture analysis has proven to be a significant paradigm in evaluating the microarchitecture of the tumor which potentially reflects various histological tumor details like grade or stage. CTTA has the potential to non-invasively predict tumor subtypes thus providing prognostic information regarding the tumor pre-operatively, which is currently only possible through a biopsy.
Texture analysis quantifies the heterogeneity of a tumor by assessing the differences in the brightness of the highlighted features from the background signal intensity. For example, if there is a bright pixel (A) with surrounding relatively darker pixels (B & C), the filter will enhance the bright pixel (A) and darken the surrounding darker pixels (B & C) relative to the increase in brightness of the brighter pixel (A). This filtered image would have enhanced heterogeneity, whereas on the other hand, if all the pixels in a tumor are homogeneous then there will be no highlighted or darkened pixels and the filtered image histogram would be only zeros. SD and entropy, which are measures of dispersion and disorder respectively, tend to be higher with greater degrees of heterogeneity. SD has also been shown to be positively correlated with hypoxia and negatively correlated with angiogenesis among NSCLC and colorectal carcinomas respectively.9 Kurtosis, which is a measure of the peakedness of the histogram on the other hand, decreases with increase in heterogeneity of the tumor. Mean and MPP are related to the overall pixel value in the tumor, with mean and MPP increasing with an increase in the signal intensity and enhancement.
Hence, the primary aim of the study was to: (1) evaluate the CTTA features in differentiation of thymoma from TH and to (2) compare the CTTA features among the WHO grade, MK stage and the new ITMIG stage of thymoma.
Methods and materials
Patient population
This ethically approved cross-sectional study enrolled 30 patients between January 2016 and December 2018 after obtaining informed consent. The CT and MR features of the group are beyond the scope of the current article and shall be presented in a separate paper. Of the 30 patients, 4 were excluded as they were not fit for surgical intervention, thus the final study cohort was 26 patients of which 18 had THY and 8 had TH on histopathological evaluation of the surgical specimen. Clinical and histological data including the MG status, WHO grade, and surgical staging according to both the MK and ITMIG system were also noted. The inclusion criteria included: (1) all patients of MG who were imaged at our institute and subsequently underwent surgery (TH or THY), (2) patients with an anterior mediastinal mass, who underwent imaging and were found to have thymoma on histopathology. We excluded patients who had undergone prior surgery/chemotherapy, were less than 13 years of age or had any contraindication for iodinated contrast media.
Imaging evaluation
All patients underwent a contrast-enhanced Dual Energy CT scan on a 2 × 128 slice dual source dual energy CT scanner (Siemens Somatom Definition Flash, Erlangen Germany). Non-ionic iodinated contrast (Iomeron- 400 mg iodine/ml) was administered at a dose of 1–1.5 mL/kg through an 18–20 G i.v. cannula using a pressure injector at the rate of 4 ml s−1 followed by a saline chase of 20 ml at 4 ml s−1. A single venous phase scan was done in the dual-energy mode (100/140 kV with Care dose 4D modulation) at a fixed delay of 60 s from the start of injection.
Image analysis
CTTA was performed using the TexRad software (Feedback Medical Ltd., Cambridge, UK- www.fbkmed.com) by a single radiologist (NR) with 4 years of experience in radiology. The mixed 120 kV (derived from 100 and 140 kV dual energy CT data) soft tissue kernel reconstructed data set with 0.6 mm slice thickness was transferred to the TexRad software. The single largest free hand regions of interest (ROIs) was drawn over the largest and most homogenous part of the lesion on axial sections of the CECT including only the solid enhancing component of the tumor, taking care to exclude the necrotic, calcified areas and the periphery of the tumor (so that TA would correlate with only microscopic heterogeneity). The mean ROI area was 8.7 cm2 (minimum - 1 cm2 and maximum - 33 cm2). TexRad uses an image filtration-histogram technique with application of various spatial scaling factors (SSFs) which highlights features sized from 2 to 6 mm “(SSF 2–SSF 6)”. In addition, the unfiltered image was also evaluated (SSF 0). The higher SSF images mitigate photon noise and provide more accurate texture parameters than lower SSF images. The histograms of the pixel values in the “5” filtered and “1” unfiltered images were quantified and evaluated for; (i) Mean (M), (ii) Standard Deviation (SD), (iii) Kurtosis (K), (iv) Skewness (S), (v) Entropy (E), and (vi) Mean of Positive Pixels (MPP) Table 1. Thus, 36 texture parameters or metrics were derived for each patient.
Table 1.
Definition of parameters
| M | Average value of pixels within the ROI |
| SD | The measure of dispersion of pixel values from the mean |
| S | Measure of asymmetry of the histogram which may be positive or negative |
| K | Measure of the peakedness of the histogram, which is positive for curves steeper than a Gaussian curve and negative for a flatter one |
| E | Measure of texture heterogeneity in terms of randomness of gray-levels distribution within the ROI |
| MPP | Average of only positive pixels. |
E, Entropy; K, Kurtosis; M, Mean; MPP, Mean of Positive pixels; ROI, region of interest; S, Skewness; SD, Standard deviation.
Statistical analysis
The data of all the patients were recorded on a spreadsheet (Microsoft Excel 2016) and analyzed by using STATA (v. 4.1). Statistical comparisons of various CTTA parameters were performed between the: (1) THY and TH groups, (2) low and high grade tumor groups, and (3) low and high stage tumor groups for both MK and ITMIG systems. The Student’s-t test and Mann–Whitney test were used for unskewed and skewed data respectively, normalcy was determined by the Shapiro–Wilk test and a p-value of less than 0.05 was considered statistically significant. All parameters that showed a significant p-value underwent receiver operating characteristic (ROC) curve analysis to generate the area under the curve (AUC) and an optimal cut-off point, of these parameters those which showed high class separation (i.e. AUC >0.8) were further selected and tabulated.
Results
Demographics
The final sample size included 26 patients, which consisted of 13 (50%) men and 13 (50%) women with a mean age of 36.7 years (range 14–72 years). Among the 26 patients, 21 (80%) had clinical and serological MG [anti-acetylcholine receptor (AChR) and or anti-muscle-specific tyrosine kinase (MuSK)], 1 (3.8%) had ocular MG, and 4 (15%) did not have MG. Histopathological examination revealed THY in 18 patients and TH in 8 patients.
Among the 18 thymomas, 8 patients had low grade and 10 patients had a high grade THY (WHO A- 3, WHO AB- 3, WHO B1- 2, WHO B2- 4, WHO B3- 6, WHO C- 0).
The distribution among MK stages revealed low stage thymoma in 11 patients and high stage thymoma in 7 patients (MK1 - 8, MK2a - 3, MK2b - 1, MK3 - 4, MK4a - 1, and MK4b - 1).
The distribution among the new ITMIG stage showed low stage thymoma in 12 patients and high stage thymoma in 6 patients (ITMIG 1–12, ITMIG 2–3, ITMIG 3a - 1, ITMIG 3b- 0, ITMIG 4a – 1, and ITMIG - 1).
Differentiation of THY from TH:
Table 2 shows the comparison of CT texture features between these groups and the metrics with significant p-value were identified. This yielded nine metrics for which ROC analysis was performed and AUC values were tabulated (Table 3). After the first step in feature selection (selecting only those metrics with AUC >0.8), the number of metrics reduced from 9 to 6. In the second step, for each metric only the SSF with highest AUC was selected thereby reducing the number of metrics to two.
Table 2.
Mann–Whitney U test in the differentiation of various categories: p values of each texture variable listed among the categories of differentiation
| SSF | Mean | SD | Entropy | MPP | Skewness | Kurtosis |
|---|---|---|---|---|---|---|
| Thymoma vs Thymic hyperplasia | ||||||
| 0 | 0.0019 | 0.4198 | 0.2238 | 0.0019 | 0.8895 | 0.7179 |
| 2 | 0.0263 | 0.3173 | 0.4358 | 0.4047 | 0.1484 | 0.6769 |
| 3 | 0.0032 | 0.0129 | 0.6758 | 0.3741 | 0.47 | 0.4702 |
| 4 | 0.0032 | 0.0196 | 0.2049 | 0.2013 | 0.8026 | 0.8676 |
| 5 | 0.0046 | 0.084 | 0.1267 | 0.5411 | 0.9336 | 0.6567 |
| 6 | 0.0027 | 0.2665 | 0.1973 | 0.7388 | 0.2584 | 0.7426 |
| WHO low vs high grade | ||||||
| 0 | 0.4908 | 0.9815 | 0.1358 | 0.594 | 0.4499 | 0.5049 |
| 2 | 0.0621 | 0.6569 | 0.0752 | 0.4239 | 0.3281 | 0.4772 |
| 3 | 0.2863 | 0.7689 | 0.1878 | 0.3284 | 0.8588 | 0.1309 |
| 4 | 0.4239 | 0.9078 | 0.2355 | 0.3284 | 0.9292 | 0.041 |
| 5 | 0.4772 | 0.9835 | 0.3909 | 0.3284 | 0.9292 | 0.1309 |
| 6 | 0.7898 | 0.594 | 0.44987 | 0.7898 | 0.1353 | 0.4729 |
| MK low vs high stage | ||||||
| 0 | 0.1351 | 0.3416 | 0.8919 | 0.1351 | 0.9639 | 0.4685 |
| 2 | 0.3896 | 0.3416 | 0.6836 | 0.3416 | 0.2046 | 0.1604 |
| 3 | 0.2976 | 0.0634 | 0.2576 | 0.2576 | 0.6503 | 0.497 |
| 4 | 0.3416 | 0.0416 | 0.7513 | 0.1604 | 0.497 | 0.497 |
| 5 | 0.2215 | 0.0333 | 0.5559 | 0.113 | 0.4414 | 0.6184 |
| 6 | 0.4414 | 0.0333 | 0.5859 | 0.3416 | 0.5762 | 0.4829 |
| ITMIG low vs high stage | ||||||
| 0 | 0.2234 | 0.5121 | 0.9253 | 0.1898 | 0.5119 | 0.8148 |
| 2 | 0.1898 | 0.3993 | 0.6396 | 0.3993 | 0.2059 | 0.349 |
| 3 | 0.2234 | 0.0752 | 0.9626 | 0.2234 | 0.5116 | 0.7079 |
| 4 | 0.5121 | 0.0349 | 0.6396 | 0.1602 | 0.349 | 0.7787 |
| 5 | 0.5121 | 0.0246 | 0.3206 | 0.1113 | 0.5741 | 1 |
| 6 | 0.8517 | 0.0246 | 0.3232 | 0.4537 | 0.5382 | 0.7492 |
ITMIG, International Thymic Malignancy Interest Group; MK, Masaoka Koga; MPP, Mean of Positive pixels; SD, standard deviation.
Parameters showing statistical significance (p < 0.05) are highlighted in bold.
Table 3.
AUC values and diagnostic performance of each statistically significant parameter (p < 0.05) among the four categories
| Parameter | SSF | AUC | Cut-off | Sensitivity | Specificity | PPV | NPV |
|---|---|---|---|---|---|---|---|
| Thymoma vs Thymic hyperplasia | |||||||
| Mean | 0 | 0.8889* | 54.83 | 83.8% | 87.5% | 93.3% | 73.6% |
| Mean | 2 | 0.7778 | 4.02 | 81.1% | 79.3% | 90.5% | 68.2% |
| Mean | 3 | 0.8681 | −1.31 | 83.8% | 75% | 88.2% | 66.7% |
| Mean | 4 | 0.8681 | −6.3 | 77.8% | 87.5% | 93.3% | 63.6% |
| Mean | 5 | 0.8542 | −13.31 | 79.4% | 84.9% | 91.7% | 61.7% |
| Mean | 6 | 0.875 | −19.53 | 73.2% | 79.4% | 88.3% | 58.3% |
| SD | 3 | 0.7986 | 70.52 | 72.20% | 75% | 86.7% | 54.5% |
| SD | 4 | 0.7361 | 69 | 66.70% | 62.50% | 80% | 45.5% |
| MPP | 0 | 0.8889* | 54.83 | 88.9% | 87.5% | 94.1% | 77.8% |
| WHO low vs high grade | |||||||
| Kurtosis | 4 | 0.7875 | 0.32 | 75.2% | 76.8% | 81.4% | 63.6% |
| MK low vs high stage | |||||||
| SD | 4 | 0.7922 | 62.53 | 64.8% | 69.2% | 59.4% | 66.3% |
| SD | 5 | 0.8012 | 58.6 | 71.4% | 72.7% | 72.5% | 59% |
| SD | 6 | 0.8052* | 54.9 | 84.4% | 73.3% | 79.3% | 68.3% |
| ITMIG low vs high stage | |||||||
| SD | 4 | 0.8056 | 61.62 | 81.1% | 74.8% | 81.6% | 67.3% |
| SD | 5 | 0.8333 | 58.6 | 80.6% | 85.4% | 83.7% | 65.1% |
| SD | 6 | 0.8333* | 54.9 | 86.9% | 82.1% | 87.1% | 79.8% |
AUC, area under the curve; ITMIG, International Thymic Malignancy Interest Group; MK, Masaoka Koga; MPP, Mean of Positive pixels; NPV, negative predictive value; PPV, positive predictive value; SD, standard deviation; SSF, spatial scaling factor.
The parameters after step two of feature selection are in bold. The best SSF for each parameter among the categories are highlighted with an asterisk.
After the second step of data reduction, the following features were selected as the best parameters in distinguishing THY from TH: (a) Mean at SSF 0 [AUC: 0.8889, 95% confidence interval (CI): 0.684–1.000] and (b) MPP at SSF 0 (AUC: 0.8889, 95% CI: 0.6844–1.000). The optimal cut-off values with their diagnostic performance are shown in (Table 3) Figures 1–3.
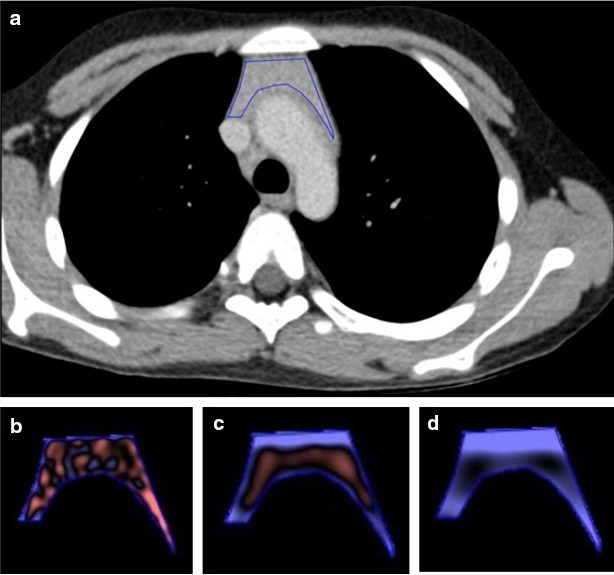
Figure 1.

(a–f). Axial DECT section of a 59-year-old male shows a well-defined anterior mediastinal mass which on surgical HPE revealed low grade (WHO grade A) and low stage (MK/ITMIG Stage 1) thymoma. (a) Demonstration of ROI placement on the axial mixed kv venous phase image. Color coded post-filtration texture images at fine “SSF-2” (b), medium “SSF-4” (b), and coarse “SSF-6” (c) SSFs. (e) Pixel intensity distribution histogram which was subsequently generated. DECT, dual energy CT; ITMIG, International Thymic Malignancy Interest Group; MK, Masaoka Koga; ROI, region of interest; SSF, spatial scaling factor.
Figure 2.

(a–d). Axial DECT section of a 65-year-old male patient with Myasthenia Gravis shows an anterior mediastinal mass with lobulated margins and left sided pleural effusion, surgical HPE revealed high grade (WHO grade B3) and high stage (MK/ITMIG Stage 4a) invasive thymoma. (a) ROI placement on the homogeneous enhancing part of the tumor on the axial mixed kv venous phase image. Color coded post-filtration texture images at fine “SSF-2” (a), medium “SSF-4” (b), and coarse “SSF-6” (c) SSFs. DECT, dual energy CT; ITMIG, International Thymic Malignancy Interest Group; MK, Masaoka Koga; ROI, region of interest; SSF, spatial scaling factor.
Figure 3.
(a–d). Axial DECT section of a 17-year-old female patient with Myasthenia Gravis shows bulky thymus with soft tissue density within, this on HPE revealed thymic hyperplasia. (a) ROI placement on the homogeneous enhancing part of the tumor on the axial mixed kv venous phase image. Color coded post-filtration texture images at fine “SSF-2” (a), medium “SSF-4” (b), and coarse “SSF-6” (c) SSFs. DECT, dual energy CT; ROI, region of interest; SSF, spatial scaling factor
Differentiation of Low and High WHO Thymoma Grades (Figures 1 and 2):
Mann–Whitney analysis yielded only a single metric (kurtosis at SSF 4) to be statistically significant (Table 2) and ROC analysis showed an AUC of 0.7875 [95% confidence interval (CI): 0.572–1.000], this had to be excluded in our first step of feature selection because the AUC was <0.8 (Table 3).
Differentiation of Low and High MK/ ITMIG Thymoma Stages (Figures 1 and 2):
After Mann–Whitney analysis the p-values of three metrics showed statistical significance for both MK and ITMIG systems (Table 2) and ROC analyses were performed and AUC values are tabulated in Table 3. The first step in feature selection (selecting only those metrics with AUC >0.8) revealed SD at SSF 5 and 6 to have the same AUC among both staging systems, hence the higher SSF metric was selected, i.e. SD at SSF 6.
The best parameter to distinguish low from high MK/ITMIG stage thymoma was SD at SSF 6 [AUC: 0.8052 (MK) and 0.8333 (ITMIG), 95% Confidence interval: 0.5884–1.000 (MK) and 0.638–1.000 (ITMIG)] with an optimal cut-off of 54.9 for both.Table 3
Discussion
In our study, we first set out to evaluate the potential of CTTA in differentiation of thymoma from thymic hyperplasia using texture analysis and was the only one in literature among only MG patients as far as we knew at the time of writing this article. This differentiation is currently done qualitatively on CT and quantitatively using the chemical shift index and signal intensity index on MRI, hence there is a lack of standardized quantitative data on CT for which CTTA could help.10,11 We found in our study that many parameters like mean, SD and MPP were statistically significant in this differentiation; however, the best parameters for this purpose were mean at SSF 0 and MPP at SSF 0. These results can be explained by the fact that thymic hyperplasia contains microscopic fat within, which reduces the mean pixel attenuation as compared with a thymoma.
Secondly, we evaluated whether CTTA could help in stratification of thymoma into the WHO grades as either low grade (Type A, AB, and B1) or high grade thymomas (Type B2, B3, and C). Previous studies have shown this to be possible using DWI, iodine density on dual energy CT and recently two studies have shown CTTA to be helpful for this purpose.10,12 A study by Iannarelli et al in 2018 showed a significant association between the WHO grade and the mean, SD and MPP for differentiation of low grade and high grade thymoma, however the SSF details and cut-off values were not mentioned in this study.13 In a similar study by Yasaka et al in 2017, they showed that mean at SSF 0 (mean 0) and entropy at SSF 6 using NCCT and mean 0 in CECT showed statistical significance in differentiating low from high grades.14 In contrast to both of these articles, our study showed that kurtosis at SSF of 4 was the only statistically significant parameter for this purpose, but this parameter had an AUC <0.8 and had to be excluded. With increasing grade, higher kurtosis would indicate an increased proportion of attenuation values away from the mean (outliers), thus depicting microscopic heterogeneity. Wang et al15 built a LASSO-based logistic regression model with texture features to determine a radiomic signature for this purpose. 10 features were found to be useful out of the 841 tested. Similar to our study, they also found kurtosis to be helpful. However, larger studies are required to validate this finding.
The final part of this study evaluated the role of CTTA parameters for differentiating between low and high stage thymoma using both the MK and the ITMIG systems. The histopathology of each patient was reviewed and reclassified according to the new ITMIG classification, which restaged only one tumor from high to low stage compared to MK staging. Analysis was done for both the MK and ITMIG stages separately, however the result including the significant parameters, their AUC, and cut-off point all remained the same. Iannarelli et al in 201813,16 showed a significant association between the MK stages and the mean, MPP, skewness and kurtosis. Again, in contrast to the limited literature, our study showed SD at a SSF of 6 to be the single best parameter for differentiating the MK and ITMIG stages. This finding could mean that the low stage thymomas have less angiogenesis as compared with the high stage tumors, which is also supported by the qualitative contrast dynamics, however again further studies are required to validate this claim.
Summary
In summary, our study yielded several individual texture parameters which demonstrated good performance in differentiating not only thymoma from thymic hyperplasia but also low from high WHO grade and MK/ITMIG stage. The best parameters to differentiate thymoma from thymic hyperplasia were mean 0 and MMP 0, to differentiate WHO low and high grade Kurtosis 6 showed statistical significance however had a low AUC on AUROC analysis, and to differentiate MK/ ITMIG stages was SD 6. Even though multiple parameters have been proven to be statistically significant, CTTA is a relatively young field and how the various parameters mirror the histologic findings is still not yet fully understood, hence further studies will be required.
Our study was not without limitations, the primary limitation being the small sample size and thus larger studies will be required to validate our findings. This is also the reason that advanced models like machine learning were not applied in our study. Secondly, we used the TexRad software, which only offers first-order texture parameters, hence we did not evaluate the second and higher order texture parameters. These higher order parameters could potentially have the ability to provide more comprehensive data; however, as of now the biological basis of these parameters is not known and there is lack of standardization.
Conclusion
CTTA revealed several parameters with excellent diagnostic performance (AUC >0.8) in differentiating THY from TH, WHO grades, and MK/ITMIG stages. CTTA can thus potentially serve as a non-invasive tool for this stratification. However, larger studies are required before it can be adapted into clinical practice.
Footnotes
Acknowledgements: I would like to thank Dr Abdul Razik for his guidance in the study.
Contributor Information
Naveen Rajamohan, Email: naveenrajamohan@gmail.com.
Ankur Goyal, Email: ankurgoyalaiims@gmail.com.
Devasenathipathy Kandasamy, Email: devammc@gmail.com.
Ashu Seith Bhalla, Email: ashubhalla2@yahoo.com.
Rajinder Parshad, Email: drrajinderparshad.aiims@gmail.com.
Deepali Jain, Email: deepalijain76@gmail.com.
Raju Sharma, Email: raju152@yahoo.com.
REFERENCES
- 1.Marom EM. Advances in thymoma imaging. J Thorac Imaging 2013; 28: 69–83. doi: 10.1097/RTI.0b013e31828609a0 [DOI] [PubMed] [Google Scholar]
- 2.Engels EA. Epidemiology of thymoma and associated malignancies. Journal of Thoracic Oncology 2010; 5(10 Suppl 4): S260–5. doi: 10.1097/JTO.0b013e3181f1f62d [DOI] [PMC free article] [PubMed] [Google Scholar]
- 3.Hsu C-H, Chan JK, Yin C-H, Lee C-C, Chern C-U, Liao C-I. Trends in the incidence of thymoma, thymic carcinoma, and thymic neuroendocrine tumor in the United States. PLoS One 14: e0227197. doi: 10.1371/journal.pone.0227197 [DOI] [PMC free article] [PubMed] [Google Scholar]
- 4.Mignarri A, Gentili F, Masia F, Genua A, Cenciarelli S, Brunori P, et al. Imaging of the thymus in myotonic dystrophy type 1. Neurol Sci 2018; 39: 347–51. doi: 10.1007/s10072-017-3202-4 [DOI] [PubMed] [Google Scholar]
- 5.Gentili F, Pelini V, Lucii G, Luzzi L, Mazzei FG, Fausto A, et al. Update in diagnostic imaging of the thymus and anterior mediastinal masses. Gland Surg. 2019; 8(Suppl 3): S188–207. doi: 10.21037/gs.2019.05.06 [DOI] [PMC free article] [PubMed] [Google Scholar]
- 6.Priola AM, Priola SM. Imaging of thymus in myasthenia gravis: from thymic hyperplasia to thymic tumor. Clin Radiol 2014; 69: e230–45. doi: 10.1016/j.crad.2014.01.005 [DOI] [PubMed] [Google Scholar]
- 7.AccessMedicine. Harrison’s principles of internal medicine, 18e | AccessMedicine | McGraw-Hill Medical.. Available from: https://accessmedicine.mhmedical.com/content.aspx?bookid=331§ionid=40726698.
- 8.Marx A, Chan JKC, Coindre J-M, Detterbeck F, Girard N, Harris NL, et al. The 2015 World Health organization classification of tumors of the thymus: continuity and changes. J Thorac Oncol 2015; 10: 1383–95. doi: 10.1097/JTO.0000000000000654 [DOI] [PMC free article] [PubMed] [Google Scholar]
- 9.Miles KA, Ganeshan B, Hayball MP. Ct texture analysis using the filtration-histogram method: what do the measurements mean? Cancer Imaging 2013; 13: 400–6. doi: 10.1102/1470-7330.2013.9045 [DOI] [PMC free article] [PubMed] [Google Scholar]
- 10.Priola AM, Priola SM, Giraudo MT, Gned D, Giardino R, Marci V. Chemical-shift and diffusion-weighted magnetic resonance imaging of thymus in myasthenia gravis: usefulness of quantitative assessment. Invest Radiol 2015; 50: 228–38. [DOI] [PubMed] [Google Scholar]
- 11.Priola AM, Priola SM, Gned D, Giraudo MT, Fornari A, Veltri A. Comparison of CT and chemical-shift MRI for differentiating thymoma from non-thymomatous conditions in myasthenia gravis: value of qualitative and quantitative assessment. Clin Radiol 2016; 71: e157–69. doi: 10.1016/j.crad.2015.12.009 [DOI] [PubMed] [Google Scholar]
- 12.Chang S, Hur J, Im DJ, Suh YJ, Hong YJ, Lee H-J, et al. Volume-based quantification using dual-energy computed tomography in the differentiation of thymic epithelial tumours: an initial experience. Eur Radiol 2017; 27: 1992–2001. doi: 10.1007/s00330-016-4542-9 [DOI] [PubMed] [Google Scholar]
- 13.Iannarelli A, Sacconi B, Tomei F, Anile M, Longo F, Bezzi M, et al. Analysis of CT features and quantitative texture analysis in patients with thymic tumors: correlation with grading and staging. Radiol Med 2018; 123: 345–50. doi: 10.1007/s11547-017-0845-4 [DOI] [PubMed] [Google Scholar]
- 14.Yasaka K, Akai H, Nojima M, Shinozaki-Ushiku A, Fukayama M, Nakajima J, et al. Quantitative computed tomography texture analysis for estimating histological subtypes of thymic epithelial tumors. Eur J Radiol 2017; 92: 84–92. doi: 10.1016/j.ejrad.2017.04.017 [DOI] [PubMed] [Google Scholar]
- 15.Wang X, Sun W, Liang H, Mao X, Lu Z. Radiomics signatures of computed tomography imaging for predicting risk categorization and clinical stage of thymomas. Biomed Res Int 2019; 2019: 1–10. doi: 10.1155/2019/3616852 [DOI] [PMC free article] [PubMed] [Google Scholar]
- 16.Gentili F, Monteleone I, Mazzei FG, Luzzi L, Del Roscio D, Guerrini S, et al. Advancement in diagnostic imaging of thymic tumors. Cancers 2021; 13: 3599. doi: 10.3390/cancers13143599 [DOI] [PMC free article] [PubMed] [Google Scholar]