

ABSTRACT
MicroRNAs (miRNAs) are associated with healing or deteriorating degenerated intervertebral disc (IVD) tissues in spinal cord diseases, including intervertebral disc degeneration (IDD). IDD represents a chronic process of extracellular matrix destruction, but the relevant molecular mechanisms implicated in the regenerative effects of miRNAs are unclear. Here, we investigated the regenerative effects of microRNA-140 (miR-140-3p) in an IDD model induced by annulus needle puncture. Bioinformatics analysis was conducted to identify regulatory factors (KLF5/N-cadherin/MDM2/Slug) linked to miR-140-3p effects in IDD. Mesenchymal stem cells (MSCs) were extracted from degenerated IVD nucleus pulposus (NP), and the expression of miR-140-3p/KLF5/N-cadherin/MDM2/Slug was manipulated to explore their effects on cell proliferation, migration, apoptosis and differentiation. The results showed that miR-140-3p was under-expressed in the degenerated IVD NP, whereas its overexpression alleviated IDD. Mechanistic studies suggested that miR-140-3p targeted KLF5 expression, and high KLF5 expression impeded the migration and differentiation of MSCs. In degenerated IVD NP-derived MSCs, MiR-140-3p-mediated KLF5 downregulation simultaneously elevated N-cadherin expression and transcriptionally inhibited MDM2, thus upregulating Slug expression. The experimental data indicated that miR-140-3p enhanced the proliferation, migration and differentiation of degenerated IVD NP-derived MSCs and repressed their apoptosis. The in vivo validation experiment also demonstrated that miR-140-3p inhibited IDD by modulating the KLF5/N-cadherin/MDM2/Slug axis. Collectively, our results uncovered the regenerative role of miR-140-3p in IDD via regulation of the KLF5/N-cadherin/MDM2/Slug axis, which could be a potential therapeutic target for IDD.
Abbreviations: miR-140-3p: microRNA-140-3p; IDD: intervertebral disc degeneration; MSCs: Mesenchymal stem cells; IVD: intervertebral disc; MSCs: mesenchymal stem cells; KLF5: Kruppel-like factor 5; MDM2: mouse double minute 2; NC: negative control; DHI: disc height index
KEYWORDS: MicroRNA-140-3p, KLF5, N-cadherin, MDM2, slug, intervertebral disc degeneration, intervertebral disc nucleus pulposus-derived mesenchymal stem cells
Introduction
Intervertebral disc degeneration (IDD) is widely recognized to cause low back pain due to musculoskeletal dysfunction resulting in disability and socio-economic burden influencing nearly 600 million individuals across the globe [1]. The vulnerability of the intervertebral disc (IVD) to degeneration is mainly ascribed to its avascular and acellular properties [2]. During degeneration, the IVD shows a disruption of the balance between anabolic-catabolic activities, resulting in disordered secretion of extracellular matrix and pro-inflammatory factors [3]. The major molecular mechanisms implicated in the pathogenesis of IDD are programmed apoptosis of nucleus pulposus cells (NPCs) and oxidative stress [4]. The current conservative and surgical therapeutic options are limited in treatment efficacy, typically failing to rescue degenerated IVD tissue or reverse pathological alterations [5]. More recent work in animal models has attempted IVD regeneration through injection of stem cells and lead to relevant clinical trials [6]. Accumulating evidence reveals that the potential of multipotent mesenchymal stem cells (MSCs) in treating IDD is exerted via effects in the nucleus pulposus (NP) [7].
In recent years, some studies have explored the role of microRNAs (miRNAs) in restoring or deteriorating degenerated IVD tissues in spinal diseases, including IDD [8,9]. For instance, deregulation of miR-155 has been reported in NP of degenerated IVD, and ectopic expression of miR-155 could be an anabolic therapeutic option to regenerate IVD through binding to an extracellular signal-regulated kinase (ERK) 1/2 [10]. Another study has found downregulation of miR-140-5p in degenerated IVD tissues, which was inversely associated with disease severity [11].
In this study, the targeting relationship between miR-140 and Kruppel-like factor 5 (KLF5) was predicted by an initial bioinformatic prediction. KLF5 is a zinc-finger transcription factor capable of modulating pluripotent stem cell self-renewal [12]. Existing evidence has demonstrated that KLF5 is positively associated with inflammation in NPCs and cartilage degradation, and a knockdown of KLF5 induces N-cadherin (CDH2) expression [13,14]. KLF5 also acts as a transcription factor of mouse double minute 2 (MDM2) to enhance its expression, by binding to the regulatory sequence [15]. MDM2, in turn, can function through forming a complex with Slug and modulating its degradation [16]. The present study aimed to explore a hypothesis that miR-140-3p can modulate the KLF5/N-cadherin/MDM2/Slug axis to exert regenerative effects in IDD.
Results
MiR-140-3p is under-expressed in degenerated IVD NP tissues, and over-expression of miR-140-3p can inhibit IDD
First, we established an SD rat IDD model using annulus needle puncture. On day 28, IVD specimens from rats with IDD were collected and considered as the IDD group, while IVD specimens of unmodeled rats were used as a control group. Observation using HE staining revealed that the NP of the IVD in the sham group was rich in NPCs and intertwined in a jelly-like extracellular matrix with a large number of vacuoles around them. In the IDD rats, the number of NPCs was seen to be reduced, the arrangement was disordered, and the vacuoles almost disappeared (Fig. 1A). In safranin O-fast green stained sections, the NP of the unmodeled rats showed a regular arrangement of green staining, and the extracellular matrix showed a distinct orange-red staining throughout the NPCs, indicating that the matrix contained a large amount of collagen fibres for maintaining NP morphology and elasticity. In the IDD rats, a large amount of orange-red stained extracellular matrix was lost, suggesting its degradation (Fig. 1B). The above findings indicated that the IDD model was successfully established. qPCR was employed to quantify the expression of miR-140-3p in IVD tissue, NP tissue, and annulus fibrosus (AF) tissue in IDD rats and unmodeled rats. Relative to the unmodeled rats, miR-140-3p showed poor expression in degenerated IVD tissue (Fig. 1C) and degenerated NP tissue (Fig. 1D) (p < 0.05), but its expression did not show significant changes in degenerated AF tissue (Fig. 1E). These results displayed that miR-140-3p was under-expressed in the NP of degenerated IVD.
Figure 1.
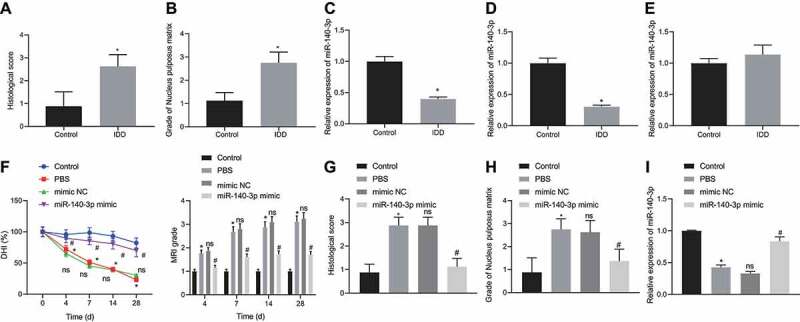
miR-140-3p is under-expressed in degenerated IVD NP, and overexpression of miR-140-3p can alleviate IDD. A-B: HE staining (A) and Safranin O-fast green staining (B) to observe the histological changes of the IVD NP in IDD and Control rats; C: qPCR quantification of miR-140-3p expression in IVD tissue of IDD and Control rats, * p < 0.05; D: qPCR quantification of miR-140-3p expression in IVD NP tissue of IDD and Control rats, * p < 0.05; E: qPCR quantification of miR-140-3p expression in AF tissue of IDD and Control rats, * p < 0.05; F: X-ray examination to observe changes in IVD height of rats at Co7-8, * p < 0.05, compared with the Control group. ns p > 0.05, compared with the PBS group. # p < 0.05 compared with the mimic NC group; G and H: HE staining (G) and saffron O-fast green staining (H) to observe the histological changes of IVD NP of rats in Control group, PBS group, mimic NC group and miR-140-3p mimic group. I: qPCR quantification of the expression of miR-140-3p in the NP of rat IVD in Control group, PBS group, mimic NC group and miR-140-3p mimic group. * p < 0.05, compared with the Control group. ns p> 0.05, compared with the PBS group. # p < 0.05, compared with the mimic NC group. Measurement data were expressed as mean ± standard deviation. Data from two groups were compared using unpaired t-test. Comparisons between multiple groups were conducted by one-way ANOVA with Tukey’s post hoc test. Statistical analysis of time-based measurements within each group was performed using repeated measures ANOVA, followed by a Bonferroni’s post-hoc test. n = 8
Next, we evaluated the effect of transfection with miR-140-3p mimic on the expression of miR-140-3p, the histological morphology of the NP in IVD, and IVD height changes at Co7-8. The height of the IVD at Co7-8 of the unmodeled rats was not significantly different at each time point (Fig. 1F), and IVDs exhibited full and complete oval-shaped high-signal regions. The NP was a complete oval structure, and contained abundant NPCs and extracellular matrix. The upper and lower endplate cartilage lines were intact, and the boundary between the NP and the AF was obvious (Fig. 1G and Fig. 1H). Relative to unmodeled rats, the expression of miR-140-3p in the NP from IVD was reduced in IDD rats receiving PBS injection (p < 0.05, Fig. 1I), and the IVD height was diminished on day 4 after modelling (p < 0.05), while the difference was more marked over time. At day 28, the IVD height of IDD rats receiving PBS injection was almost completely lost, and osteophyte formation was seen in the upper and lower vertebrae, showing a fusion trend (Fig. 1F). Moreover, almost no complete NP structure was observed. AF and NP fused and deformed, the upper and lower endplate cartilage lines were broken, the subchondral bone was significantly damaged, and a large amount of extracellular matrix was lost (Fig. 1G and H), exhibiting obvious IDD. As compared to IDD rats injected with PBS, IDD rats injected with mimic negative control (NC) showed no significant changes in the expression of miR-140-3p in the NP from IVD, IVD height, IVD signal intensity, IVD score, and NP morphology. Relative to IDD rats injected with mimic NC, IDD rats injected with miR-140-3p mimic showed significantly elevated expression of miR-140-3p in the NP from IVD (p < 0.05, Fig. 1I), increased height of degenerated IVD and lower IVD score (p < 0.05, Fig. 1F), while the tissue morphology was significantly improved (Fig. 1G and H), suggesting alleviation of IDD.
These results indicated that miR-140-3p was highly expressed in the NP from degenerated IVD and could effectively alleviate IDD.
MiR-140-3p accelerates migration and differentiation of MSCs in degenerated IVD NP
We proceeded to investigate whether miR-140-3p regulated MSCs in the NP from IVD. Rat NP MSCs were isolated from degenerated IVD NP from IDD rats and normal IVD NP from unmodeled rats, which were labelled as D-NPMSCs and C-NPMSCs, respectively. Flow cytometry was employed to examine the expression C-NPMSCs and D-NPMSCs cell surface antigen factors (CD29, CD44 and CD73) and identify the isolated and cultured rat NP MSCs, showing no significant difference in the expression levels of CD29, CD44 and CD73 (Fig. 2A). However, we found that miR-140-3p expression was appreciably reduced in D-NPMSCs (p < 0.05) (Fig. 2B). D-NPMSCs were transfected with mimic NC or miR-140-3p mimic. qPCR was employed to quantify miR-140-3p expression and pluripotent stem cell genes (OCT4 and NANOG) in MSCs. CCK-8 assay, scratch test and flow cytometry were employed to assess cell proliferation, migration, and apoptosis. Adipogenic induction and oil red O staining, as well as osteogenic induction and alizarin red staining were applied to assess the cell differentiation ability. Relative to mimic NC, treatment with miR-140-3p mimic in D-NPMSCs led to a higher expression of miR-140-3p (p < 0.05, Fig. 2C), enhanced proliferation (Fig. 2D), migration (Fig. 2E) and expression of OCT4 and NANOG (Fig. 2F) (p < 0.05), along with diminished apoptosis (p < 0.05, Fig. 2G). Lipid-positive cells were increased after adipogenic differentiation (p < 0.05, Fig. 2H), and calcium nodules were elevated after osteogenic induction (p < 0.05, Fig. 2I). The above results indicated that miR-140-3p augmented the proliferation and migration of MSCs in degenerated IVD NP and enhanced their differentiation.
Figure 2.
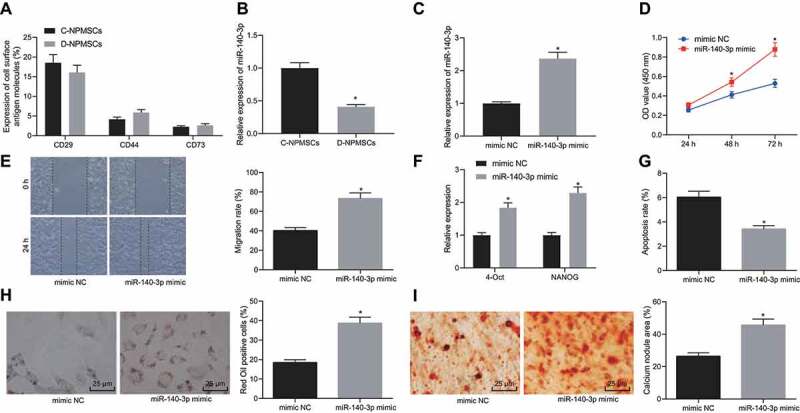
miR-140-3p augments migration and differentiation of NPMSCs. Rat NP MSCs were isolated from degenerated IVD NP of IDD rats and normal IVD NP of unmodeled rats, which were labelled as D-NPMSCs and C-NPMSCs, respectively. A: Flow cytometric detection of expression of surface antigen molecules (CD29, CD44 and CD73) to identify C-NPMSCs and D-NPMSCs that were isolated and cultured; B: qPCR determination of miR-140-3p expression in MSCs in IVD NP in IDD group and Control group, * p < 0.05; C: qPCR determination of the expression of miR-140-3p in D-NPMSCs in mimic NC group and miR-140-3p mimic group, * p < 0.05; D: CCK-8 assay to measure the proliferation ability of D-NPMSCs in mimic NC group and miR-140-3p mimic group, * p < 0.05; E: Scratch test to detect the migration ability of D-NPMSCs in mimic NC group and miR-140-3p mimic group, * p < 0.05 F: qPCR to determine the expression of pluripotent stem cell genes (OCT4 and NANOG) in D-NPMSCs of mimic NC group and miR-140-3p mimic group, * p < 0.05; G: Flow cytometry to detect apoptosis of D-NPMSCs in mimic NC group and miR-140-3p mimic group, * p < 0.05; H: Oil red O staining to assess the differentiation ability of D-NPMSCs after adipogenic differentiation in mimic NC group and miR-140-3p mimic group (× 400), * p < 0.05; I: Alizarin red staining to assess the differentiation ability of D-NPMSCs after osteogenic differentiation in mimic NC group and miR-140-3p mimic group (× 400), * p < 0.05. Measurement data were expressed as mean ± standard deviation. Data from two groups were compared using unpaired t-test. Statistical analysis of time-based measurements within each group was performed using repeated measures ANOVA, followed by a Bonferroni’s post-hoc test. Cell experiments were repeated three times
MiR-140-3p targets KLF5 in MSCs of degenerated IVD, and KLF5 overexpression inhibits MSC migration and differentiation
Using bioinformatic tool ‘starbase’ (http://starbase.sysu.edu.cn/), we identified 4465 putative downstream regulatory genes of miR-140-3p (Table S1). Using ‘TargetScan’ (http://www.targetscan.org/vert_71/), we identified 496 and 365 putative downstream regulatory genes of miR-140-3p in human (Table S2) and (Table S3) rats, respectively. Using the database ‘GeneCards’, we found 641 IDD-related genes (Table S4). The overlap between target and related genes indicated 22 common ‘candidate’ genes (Fig. 3A; Table S5). Genes were classified using the Panther’s website (http://www.pantherdb.org/), and KLF5 was found to act as a transcription regulator (Fig. 3B). Using ‘TargetScan’ for bioinformatics analysis of microRNA, it was predicted that miR-140-3p could target KLF5 and the binding sites were identified (Fig. 3C). KLF5-WT and KLF5-MUT were inserted into luciferase reporter vectors as reporter plasmids, which were co-transfected with miR-140-3p mimic NC and miR-140-3p mimic. The luciferase activity of the miR-140-3p mimic and KLF5-WT plasmid co-transfection was found significantly lower than that of the miR-140-3p mimic NC co-transfection (p < 0.05). MiR-140-3p mimic and KLF5-MUT plasmid co-transfection showed no significant change in luciferase activity versus the NC co-transfection group, indicating that KLF5 mRNA can bind to miR-140-3p (Fig. 3D). The expression of KLF5 mRNA and protein in D-NPMSCs and C-NPMSCs was quantified using qPCR and Western blot assay and was found to be significantly higher in D-NPMSCs (p < 0.05, Figs. 3E and F). However, the mRNA and protein expression of KLF5 in D-NPMSCs was reduced in response to miR-140-3p mimic (p < 0.05, Fig. 3G and H). Compared with the mimic NC group, treatment with miR-140-3p mimic of D-NPMSCs led to significant increase in the expression of miR-140-3p (p < 0.05) (Fig. 3I), while the mRNA and protein expression levels of KLF5 were reduced (p < 0.05) (Fig. 3J and K), the proliferation and migration ability of D-NPMSCs was markedly increased (p < 0.05) (Figures S1A and S1B) and apoptosis was significantly decreased (p < 0.05) (Figure S1C), and the expression of stem-cell specific genes OCT4 and NANOG in D-NPMSCs was increased significantly (p < 0.05) (Figure S1D). Lipid droplet positive cells and calcium nodules increased significantly after adipogenic differentiation was induced (p < 0.05) (Figures S1E and S1F). As compared with miR-140-3p mimic + oe-NC group, when miR-140-3p and KLF5 were simultaneously overexpressed in D-NPMSCs, the expression of miR-140-3p was not significantly different (Fig. 3I). However, the expression of KLF5 mRNA and protein was significantly increased (p < 0.05) (Fig. 3J and K), the proliferation and migration of D-NPMSCs were significantly decreased (p < 0.05) (Figures S1A and S1B), cell apoptosis was significantly increased (p < 0.05) (Figure S1C), and the expression of stem-cell specific genes OCT4 and NANOG in D-NPMSCs was significantly reduced (p < 0.05) (Figure S1D). The Lipid droplet positive cells and calcium nodules were significantly reduced once adipogenic differentiation was induced (p < 0.05) (Figures S1E and S1F). These results indicated that in D-NPMSCs, a high expression of KLF5 could reverse the effect of miR-140-3p and inhibit cell migration and differentiation.
Figure 3.
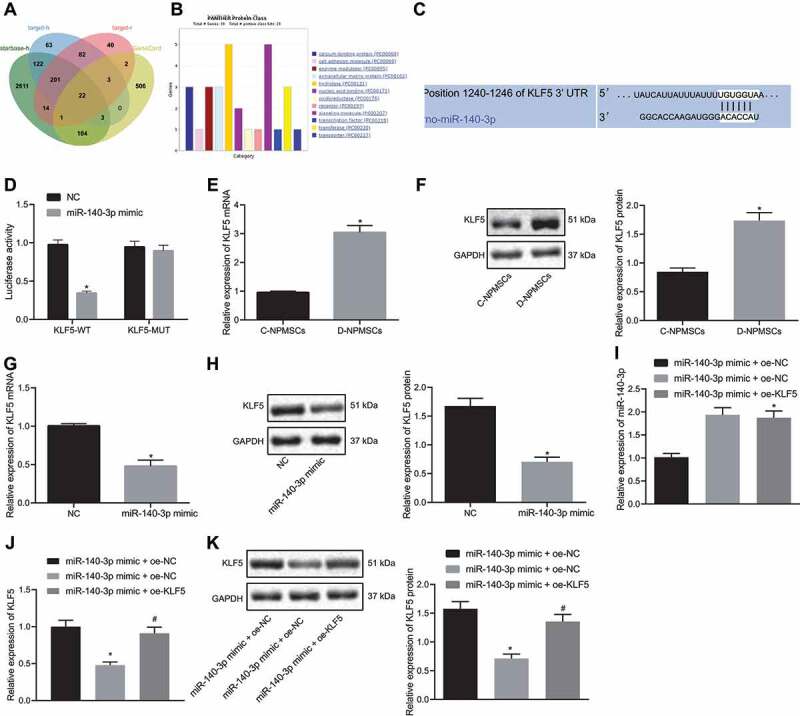
MiR-140-3p targets KLF5 in MSCs of degenerated IVD, and KLF5 overexpression inhibits MSC migration and differentiation. A: Venn plot of intersection of miR-140-3p downstream regulatory genes in ‘starbase’ and ‘TargetScan’ databases with IDD-related genes in ‘GeneCards’ database; B: The result of gene classification using ‘Panther’. X-axis indicates the category, Y-axis indicates the number of genes; C: The binding sites of miR-140-3p and KLF5 mRNA predicted by ‘TargetScan’; D: Dual luciferase report assay to determine whether miR-140-3p binds to KLF5 mRNA in HEK293T cells, * p < 0.05; E-F: qPCR (E) and Western blot assay (F) to detect KLF5 mRNA and protein expression in D-NPMSCs and C-NPMSCs, respectively, * p < 0.05; G-H: qPCR (G) and Western blot assay (H) to detect KLF5 mRNA and protein expression in D-NPMSCs of mimic NC group and miR-140-3p mimic group, * p < 0.05; I: qPCR detection of miR-140-3p expression in D-NPMSCs of mimic NC + oe-NC group, miR-140-3p mimic + oe-NC group and miR-140-3p mimic + oe-KLF5 group, * p < 0.05 compared with mimic NC + oe-NC group, ns p > 0.05 compared with miR-140-3p mimic + oe-NC group; J-K: qPCR (J) and Western blot assay (K) to determine KLF5 mRNA and protein expression in D-NPMSCs of mimic NC + oe-NC group, miR-140-3p mimic + oe-NC group and miR-140-3p mimic + oe-KLF5 group, * p < 0.05 compared with mimic NC + oe-NC group, # p < 0.05 compared with miR-140-3p mimic + oe-NC group. Measurement data were expressed as mean ± standard deviation. Data from two groups were compared using unpaired t-test. Statistical analysis of time-based measurements within each group was performed using repeated measures ANOVA, followed by a Bonferroni’s post-hoc test. Cell experiments were repeated three times
MiR-140-3p-mediated KLF5 downregulation elevates N-cadherin expression and transcriptionally suppresses MDM2 thereby upregulating Slug in MSCs of degenerated IVD
In order to predict the downstream regulatory genes of KLF5, we identified 74 KLF5 interaction proteins using the GeneCards database. Using the STRING web-based resource to analyse the interacting proteins network visualized with Cytoscape 3.5.1, we obtained 26 genes (Fig. 4A) at the core position of the network map (Degree ≥ 28). Lowering the threshold setting, we again queried 751 KLF5 interaction proteins and 487 IDD-related genes using the GeneCards database, and 68 common genes were identified (Fig. 4B). Again using STRING to analyse the interacting protein network visualized with Cytoscape 3.5.1, we obtained 23 genes at the core position of the network map (Degree ≥ 37) (Fig. 4C). We further investigated if miR-140-3p downregulated KLF5 through N-cadherin and MDM2 to affect Slug expression and thus regulated MSCs of degenerated IVD where qPCR and Western blot assays revealed that D-NPMSCs showed significantly diminished N-cadherin mRNA and protein expression, elevated MDM2 mRNA and protein expression, and diminished Slug mRNA and protein expression (p < 0.05, Figs. 4D and S2A). qPCR showed that there was higher expression of MDM2 in the oe-KLF5 transfected D-NPMSCs than that in oe-KLF5 transfected C-NPMSCs (p < 0.05, Fig. 4E). Besides, we found that, in the presence of miR-140-3p mimic, D-NPMSCs showed significantly increased N-cadherin mRNA and protein expression, decreased MDM2 mRNA and protein expression, and increased Slug mRNA and protein expression (p < 0.05, Figs. 4F and S2B). Furthermore, in the presence of miR-140-3p mimic + overexpression (oe)-KLF5, D-NPMSCs showed decreased N-cadherin mRNA and protein expression, increased MDM2 mRNA and protein expression, and decreased Slug mRNA and protein expression versus those with miR-140-3p mimic treatment alone (p < 0.05, Figs. 4Gand S2C). The CHIP assay results showed that KLF5 bound MDM2 promoter in D-NPMSCs was reduced in the presence of miR-140-3p mimic, whereas miR-140-3p mimic + oe-KLF5 increased the KLF5 bound MDM2 promoter in D-NPMSCs, versus miR-140-3p mimic treatment alone (p < 0.05, Fig. 4H).
Figure 4.
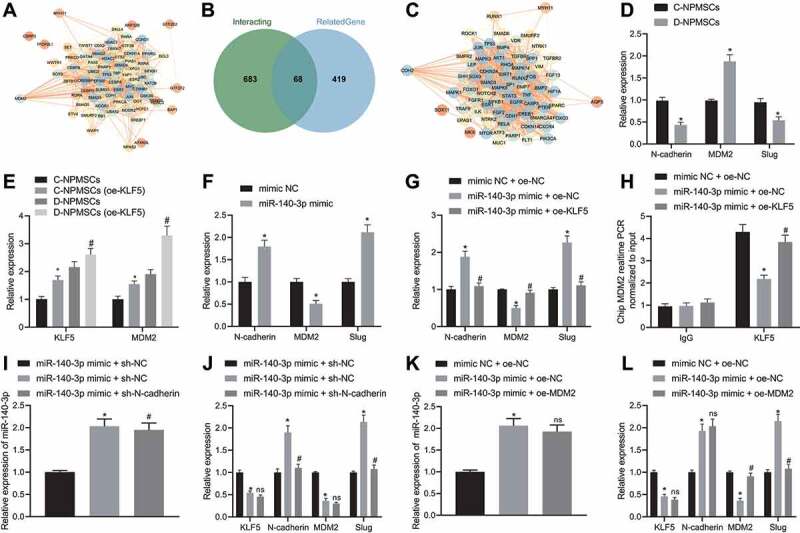
MiR-140-3p-mediated KLF5 downregulation elevates N-cadherin expression and transcriptionally suppresses MDM2, thereby upregulating Slug in MSCs of degenerated IVD. A: Interaction network diagram of 74 KLF5 interaction proteins in the ‘GeneCards’ database. The circle colour changing from orange to blue indicates the gene’s Degree value from low to high. The colour of the line in the middle of the circle changes from orange to blue, and the line from thick to thin, indicating the co-expression relationship between genes; B: Venn diagram of the intersection of KLF5 interaction proteins and IDD-related genes based on the ‘GeneCards’ database; C: Interaction network diagram of 68 intersecting genes. The colour of the circle changing from orange to blue indicates the Degree value of the gene from low to high. The colour of the connecting line in the middle of the circle changing from orange to blue, and the line from thick to thin indicates the co-expression relationship between genes; D: qPCR assay to determine mRNA and protein expression of N-cadherin, MDM2 and downstream Slug in D-NPMSCs and C-NPMSCs, * p < 0.05; E: qPCR assay to determine mRNA and protein expression of KLF5 and MDM2 in D-NPMSCs and C-NPMSCs after overexpressing KLF5, * p < 0.05 compared with C-NPMSCs, # p < 0.05 compared with D-NPMSCs. F: qPCR assay to determine mRNA and protein expression of N-cadherin, MDM2 and downstream Slug in D-NPMSCs of mimic NC group and miR-140-3p mimic group, * p < 0.05; G: qPCR assay to determine mRNA and protein expression of N-cadherin, MDM2 and downstream Slug in D-NPMSCs of mimic NC + oe-NC group, miR-140-3p mimic + oe-NC group and miR-140-3p mimic + oe-KLF5 group, * p < 0.05 compared with mimic NC + oe-NC group, # p < 0.05 compared with miR-140-3p mimic + oe-NC group; H: CHIP assay to validate KLF5 bound MDM2 promoter in D-NPMSCs of mimic NC + oe-NC group, miR-140-3p mimic + oe-NC group and miR-140-3p mimic + oe-KLF5 group, * p < 0.05 compared with mimic NC + oe-NC group, # p < 0.05 compared with miR-140-3p mimic + oe-NC group; I: qPCR detection of expression of miR-140-3p in D-NPMSCs in mimic NC + sh-NC group, miR-140-3p mimic + sh-NC group and miR-140-3p mimic + sh-N-cadherin group, * p < 0.05 compared with mimic NC + sh-NC group, ns p > 0.05 compared with miR-140-3p mimic + sh-NC group; J: qPCR assay to determine mRNA and protein expression of N-cadherin, MDM2 and downstream Slug in mimic NC + sh-NC group, miR-140-3p mimic + sh-NC group and miR-140-3p mimic + sh-N-cadherin group, * p < 0.05 compared with mimic NC + sh-NC group, ns p > 0.05 and # p < 0.05 compared with miR-140-3p mimic + sh-NC group; K: qPCR detection of miR-140-3p expression in D-NPMSCs of mimic NC + oe-NC group, miR-140-3p mimic + oe-NC group and miR-140-3p mimic + oe-MDM2 group, * p < 0.05 compared with mimic NC + oe-NC group, ns p > 0.05 compared with miR-140-3p mimic + oe-NC group; L: qPCR assay to determine mRNA and protein expression of N-cadherin, MDM2 and downstream Slug in mimic NC + oe-NC group, miR-140-3p mimic + oe-NC group and miR-140-3p mimic + oe-MDM2 group, * p < 0.05 compared with mimic NC + oe-NC group, ns p > 0.05 and # p < 0.05 compared with miR-140-3p mimic + oe-NC + group. Measurement data were expressed as mean ± standard deviation. Data from two groups were compared using unpaired t-test. Comparisons between multiple groups were performed using one-way ANOVA with Tukey’s post hoc test. Cell experiments were repeated three times
We continued to treat D-NPMSCs with shRNA (sh)-N-cadherin plasmid and oe-MDM2 plasmid, and then evaluated the expression of miR-140-3p, KLF5, N-cadherin, MDM2, and downstream Slug. Relative to mimic NC + sh-NC treatment, miR-140-3p mimic + sh-NC treatment elevated miR-140-3p expression (p < 0.05, Fig. 4I), reduced mRNA and protein expression of KLF5 and MDM2, and augmented mRNA and protein expression of N-cadherin and Slug (p < 0.05, Figs. 4J and S2D). In comparison with miR-140-3p mimic + sh-NC treatment, miR-140-3p mimic + sh-N-cadherin treatment led to reduced mRNA and protein expression of N-cadherin and Slug in D-NPMSCs, with no significant change in miR-140-3p, KLF5, and MDM2 expression (p > 0.05). Versus mimic NC + oe-NC treatment, miR-140-3p mimic + oe-NC treatment showed an elevation in miR-140-3p expression (p < 0.05, Fig. 4K), and mRNA and protein expression of N-cadherin and Slug, and a reduction in mRNA and protein expression of KLF5 and MDM2 (p < 0.05). Compared with miR-140-3p mimic + oe-NC treatment, miR-140-3p mimic + oe-MDM2 treatment showed an elevation in mRNA and protein expression of MDM2 and a reduction in that of Slug (p < 0.05), with no significant change in the expression of miR-140-3p, KLF5 and N-cadherin (p > 0.05) (Figs. 4L and S2E).
These data indicated that miR-140-3p repressed KLF5 to elevate N-cadherin expression and transcriptionally suppress MDM2, thereby upregulating Slug in MSCs of degenerated IVD.
MiR-140-3p enhances migration and differentiation of MSCs in degenerated IVD by regulating the KLF5/N-cadherin/MDM2/Slug axis
Next, we treated D-NPMSCs with miR-140-3p mimic or sh-Slug to assess cell proliferation, migration, apoptosis, and differentiation capacity. Relative to mimic NC + sh-NC treatment, miR-140-3p mimic + sh-NC treatment in D-NPMSCs resulted in increased expression of miR-140-3p (p < 0.05, Fig. 5A), and decreased expression of KLF5 and MDM2 mRNA and protein (p < 0.05), elevated expression of N-cadherin and Slug mRNA and protein (p < 0.05, Fig. 5B and C), increased cell proliferation (Fig. 5D) and migration (Fig. 5E), repressed cell apoptosis (Fig. 5F), elevated expression of stem cell specific genes (OCT4 and NANOG) (Fig. 5G), along with increased lipid droplet-positive cells after adipogenic differentiation (Fig. 5H), and calcium nodules after osteogenic induction (Fig. 5I), suggesting that the migration and differentiation capacity of D-NPMSCs was augmented. In comparison with miR-140-3p mimic + sh-NC treatment, miR-140-3p mimic + sh-Slug treatment did not cause significant changes in the expression of miR-140-3p, KLF5, N-cadherin and MDM2 in D-NPMSCs, but led to a reduction in mRNA and protein expression of Slug (Fig. 5B and C), suppression in cell proliferation (Fig. 5D) and migration (Fig. 5E), promotion in apoptosis (Fig. 5F), reduction in expression of stem cell genes (OCT4 and NANOG) in D-NPMSCs (p < 0.05, Fig. 5G), lipid droplet-positive cells after adipogenic differentiation (p < 0.05, Fig. 5H), and calcium nodules after osteogenic differentiation (p < 0.05, Fig. 5I), suggesting that the migration and differentiation capacity of D-NPMSCs was impeded. These results indicated that miR-140-3p accelerated the migration and differentiation of MSCs in degenerated IVD by regulating KLF5 and simultaneously affecting the expression of N-cadherin and MDM2, and then regulating the expression of Slug.
Figure 5.
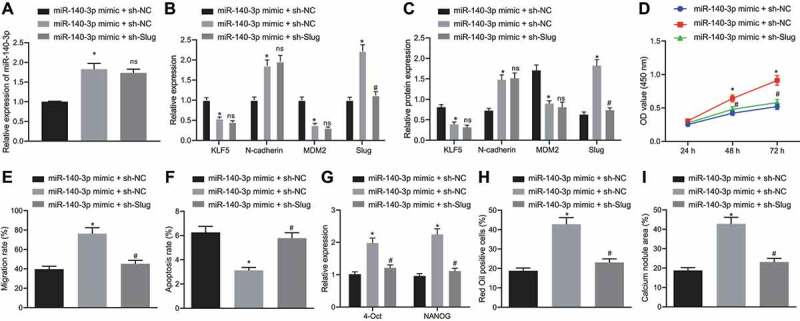
MiR-140-3p promotes the migration and differentiation of MSCs in degenerated IVD by regulating the KLF5/N-cadherin/MDM2/Slug axis. A: qPCR determination of miR-140-3p expression in D-NPMSCs of mimic NC + sh-NC group, miR-140-3p mimic + sh-NC group and miR-140-3p mimic + sh-Slug group; B-C: qPCR (B) and Western blot assay (C) to determine mRNA and protein expression of KLF5, N-cadherin, MDM2 and downstream Slug in D-NPMSCs; D: CCK-8 assay to quantify the proliferation ability of D-NPMSCs in each group; E: Scratch test to assess the migration ability of D-NPMSCs in each group; F: Flow cytometry to detect the apoptosis of D-NPMSCs in each group; G: qPCR to determine the expression of pluripotent stem cell genes (OCT4 and NANOG); H: Oil red O staining to assess the differentiation ability of D-NPMSCs after adipogenic differentiation; I: Alizarin red staining to assess the differentiation ability of D-NPMSCs after osteogenic differentiation. * p < 0.05 compared with mimic NC + sh-NC group, ns p > 0.05 and # p < 0.05 compared with miR-140-3p mimic + sh-NC group. Measurement data were expressed as mean ± standard deviation. Comparisons between multiple groups were conducted by one-way ANOVA with Tukey’s post hoc test. Statistical analysis of time-based measurements within each group was performed using repeated measures ANOVA, followed by a Bonferroni’s post-hoc test. Cell experiments were repeated three times
MiR-140-3p mitigates IDD by regulating the KLF5/N-cadherin/MDM2/Slug axis in vivo
We next validated the results of in vitro studies in in vivo models. In unmodeled rats, the IVD height at Co7-8 was not significantly different at each time point (Fig. 6B), and all rats showed a full and elliptical high-signal area. The NP had a complete oval shape, which was rich in NPCs and extracellular matrix. The upper and lower endplate cartilage lines were intact, and the NP and annulus fibrosus were clearly separated (Fig. 6E and F). Relative to unmodeled rats, the IVD NP tissue of IDD rats receiving PBS injection showed reduced expression of miR-140-3p (p < 0.05, Fig. 6A), reduced IVD height (p < 0.05, Fig. 6B), elevated mRNA and protein expression of KLF5 and MDM2, and decreased mRNA and protein expression of N-cadherin and Slug (p < 0.05, Fig. 6C and D). In addition, almost no complete NP structure could be seen. AF and NP were fused and deformed, the upper and lower endplate cartilage lines were broken, the subchondral bone was significantly damaged, and the extracellular matrix was largely seen as lost (Fig. 6E and F), suggesting obvious IDD. Relative to IDD rats receiving PBS injection, IVD NP tissue of IDD rats receiving mimic NC + sh-NC injection presented with no significant alterations in miR-140-3p expression, degenerated IVD height, IVD signal intensity, IVD score and tissue morphology or in the expression of KLF5, N-cadherin, MDM2 and Slug mRNA and protein. Compared to IDD rats receiving mimic NC + sh-NC injection, IDD rats injected with miR-140-3p mimic + sh-NC showed increased expression of miR-140-3p in the NP (p < 0.05, Fig. 6A), decreased mRNA and protein expression of KLF5 and MDM2, increased mRNA and protein expression of N-cadherin and Slug (p < 0.05, Fig. 6C and D), increased height of degenerated IVD height (p < 0.05, Fig. 6B), as well as improved tissue morphology (Fig. 6E and F), suggesting a significant improvement in IDD. As compared to IDD rats injected with miR-140-3p mimic + sh-NC, there was no difference in the expression of miR-140-3p, KLF5, N-cadherin and MDM2 in IVD NP of IDD rats injected with miR-140-3p mimic + sh-Slug. However, miR-140-3p mimic + sh-Slug led to a reduction in the mRNA and protein expression of Slug (p < 0.05, Fig. 6C and D), the height of degenerated IVD (p < 0.05, Fig. 6B), as well as the reduced signal intensity and exacerbated tissue morphology (Fig. 6E and F), suggesting aggravated IDD. These results indicated that miR-140-3p ameliorated IDD by regulating the KLF5/N-cadherin/MDM2/Slug axis in vivo.
Figure 6.
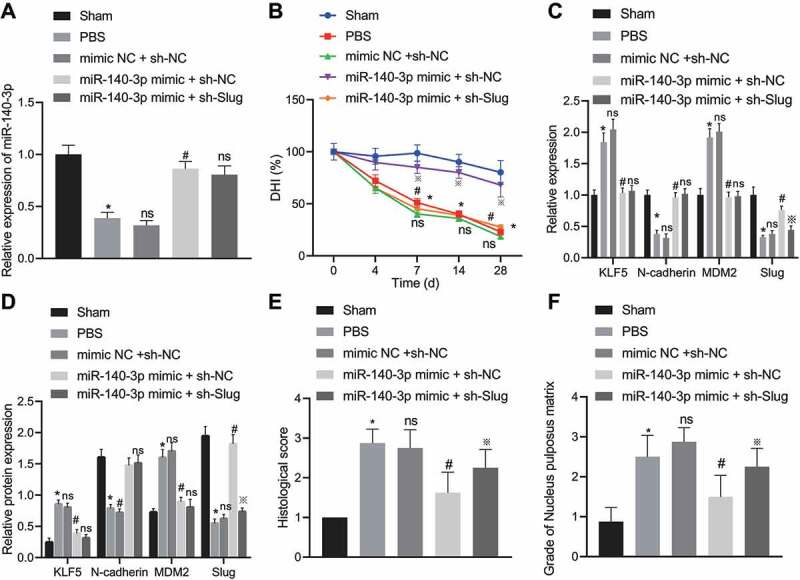
MiR-140-3p mitigates IDD by regulating the KLF5/N-cadherin/MDM2/Slug axis in vivo. A: qPCR determination of the expression of miR-140-3p in the IVD NP of rats in Control group, PBS group, mimic NC + sh-NC group, miR-140-3p mimic + sh-NC group and miR-140-3p mimic + sh-Slug group. * p < 0.05 compared with Control group, ns p > 0.05 compared with PBS group, # p < 0.05 compared with mimic NC + sh-NC group, ※ p < 0.05 compared with miR-140-3p mimic + sh-NC group; B: X-ray examination to observe the changes of IVD height at Co7-8 of rats in each group, * p < 0.05 compared with Control group, ns p > 0.05 compared with PBS group, # p < 0.05 compared with mimic NC + sh-NC group, ※ p < 0.05 compared with miR-140-3p mimic + sh-NC group; C: qPCR assay to determine mRNA and protein expression of KLF5, N-cadherin, MDM2 and downstream Slug in the IVD NP of rats, * p < 0.05 compared with the Control group, ns p > 0.05 compared with the PBS group or miR-140-3p mimic + sh-NC group, # p < 0.05 compared with mimic NC + sh-NC group, ※ p < 0.05 compared with miR-140-3p mimic + sh-NC group; D: Western blot assay to determine mRNA and protein expression of KLF5, N-cadherin, MDM2 and downstream Slug in the IVD NP of rats, * p < 0.05 compared with the Control group, ns p > 0.05 compared with the PBS group or miR-140-3p mimic + sh-NC group, # p < 0.05 compared with mimic NC + sh-NC group, ※ p < 0.05 compared with miR-140-3p mimic + sh-NC group; E and F: HE staining (E) and Safranin O-fast green staining (F) to observe the histological morphology of IVD NP of rats; * p < 0.05 compared with the Control group, ns p > 0.05 compared with the PBS group or miR-140-3p mimic + sh-NC group, # p < 0.05 compared with mimic NC + sh-NC group, ※ p < 0.05 compared with miR-140-3p mimic + sh-NC group; Measurement data were expressed as mean ± standard deviation. Comparisons between multiple groups were conducted by one-way ANOVA with Tukey’s post hoc test. Statistical analysis of time-based measurements within each group was performed using repeated measures ANOVA, followed by a Bonferroni’s post-hoc test. n = 8
Discussion
IDD represents a complicated condition characterized by biochemical alterations in the NP and inner annulus [17]. Current available strategies for IDD, including physiotherapy, pain medication, and surgeries exhibit limited efficacy, while the potential of alternative options such as stem cell therapy and molecular regulators has been proposed to reverse degeneration [2]. Notably, recent work has demonstrated the role of MSCs in regenerating degenerated IVD [7]. Biological methods comprising the use of MSCs for treating IDD could possibly restore function and rescue the degenerated NP and AF [7]. Also, accruing research has documented that deregulation of miRNA molecules results in pathophysiological alterations in the NP, which are implicated in degeneration process of IVD [18,19]. Unlike previous studies of miR-140-3p [11], here, we constructed an IDD model using annulus puncture, treated with miR-140-3p mimic and observed its relieving effect on IDD symptoms. In addition, putative targets of miR-140-3p were predicted and harvested NPCs from IDD tissues were utilized for various biological assays. With these, we demonstrated that miR-140-3p can confer regenerative effects in IDD by targeting the KLF5/N-cadherin/MDM2/Slug axis (Fig. 7). We first verified that miR-140-3p is under-expressed in degenerated IVD NP, and the overexpression of miR-140-3p can alleviate IDD. Previous evidence has identified an association between aberrations of miRNAs with the pathological changes in IVD, which implies the plausible prognostic and therapeutic utility of newly identified miRNA relevant to IDD [20]. The downregulation of miR-140-5p has been highlighted in the NP from IDD, whereas ectopic expression of miR-140-5p was found to ameliorate inflammation and extracellular matrix destruction [11]. A previous in vitro study presented evidence that miR-140-5p overexpression exercised an alleviatory effect on extracellular matrix degradation by diminishing IL-1β and TNF-α [21]. Notably, Lehmann et al. have reported that MSCs could augment the expression of IDD-downregulated miR-140 in NPCs and thus alleviate IDD [22]. Corroborating findings were reported in our study, which demonstrated that miR-140-3p enhanced the migration and differentiation of MSCs in degenerated IVD NP.
Figure 7.
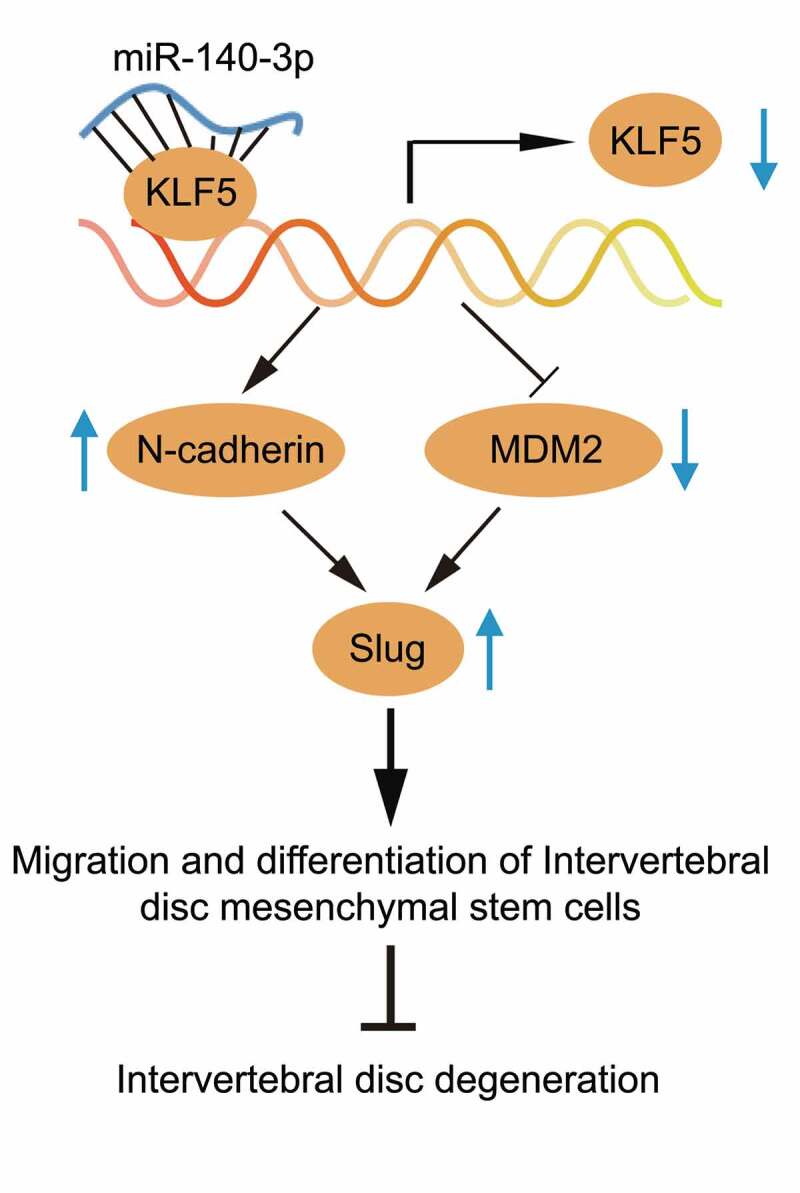
Schematic illustration of the role of miR-140-3p in MSCs from NP of degenerated IVD. miR-140-3p represses KLF5 to elevate N-cadherin expression and transcriptionally suppresses MDM2, thereby upregulating Slug to enhance migration and differentiation of MSCs
Next, we explored the relevant underlying mechanisms and found that miR-140-3p targeted KLF5 in MSCs of degenerated IVD, while KLF5 overexpression inhibited MSC migration and differentiation. We used database-based miR target detection programs to predict the potential target genes of miR-140-3p, and the KLF5 was predicted as a core candidate target of miR-140-3p, which was further confirmed by dual-luciferase reporter assay” into “We confirmed through dual-luciferase reporter assay that KLF5 was a core candidate target of miR-140-3p. KLF5 is a pivotal transcription factor modulating cell activities [23]. Prior evidence has suggested that in IL-1β-induced IDD, the inhibition of KLF5 could suppress the degenerative process and restore IVD metabolism, thus may bear therapeutic potential in IDD [13].
In addition, this study explored the mechanisms related to the putative role of miR-140-3p/KLF5 in IDD, and showed that miR-140-3p-mediated KLF5 downregulation elevated N-cadherin expression and transcriptionally suppressed MDM2, thereby upregulating Slug in MSCs from degenerated IVD. The modulatory role of KLF5 has been associated with N-cadherin in epithelial cells, where knockdown of KLF5 was found to stimulate N-cadherin expression and trigger the epithelial-mesenchymal transition process [14]. Degenerated IVD has been shown to exhibit a loss of N-cadherin expression and damaged NPCs, and upregulated N-cadherin reportedly restores the health of NPCs in IVD [24]. In addition, in a study by Morimoto et al., both KLF5 and MDM2 were found directly bound to and repressed by miR-4711-5p, and the expression of these two factors was positively correlated [25]. In the context of IDD, suppressed MDM2 has been found to intensify proliferation and to impede the senescence of NPCs [26]. In addition, MDM2 can reportedly modulate the degradation of Slug, thereby repressing Slug expression and accumulation in cells [16]. Slug, a zinc-finger transcription factor, also plays a pivotal role in MSC self-renewal during health and diseases [27]. Our observations also validated that miR-140-3p accelerated the migration and differentiation of MSCs in degenerated IVD by regulating the KLF5/N-cadherin/MDM2/Slug axis in vivo.
Conclusion
Our results showed that the expression of miR-140-3p was very low in IDD NP tissues. However, when IDD model rats received miR-140-3p mimic injection, the tissue morphology showed significant improvement, and IDD was found effectively alleviated. miR-140-3p could promote the migration and differentiation of D-NPMSCs, and down-regulate KLF5 to promote N-cadherin expression and transcriptionally inhibit MDM2 to up-regulate Slug expression. In conclusion, miR-140-3p was identified as a miRNA that regulated the MSCs in degenerated IVD through direct targeting of KLF5 and the interaction with the N-cadherin/MDM2/Slug axis, thus suggesting that therapeutic overexpression of miR-140-3p may be an efficient anabolic strategy for IDD. However, IDD develops relatively slowly. Therefore, it may be difficult to obtain a sufficient number of clinical trial subjects in a short time by compounding the challenges in clinical studies of IDD. There are some modifiable factors, such as animal age, investigational products, genetic factors, mechanical activities and systemic complications, which can affect the validity of these experimental results. In addition, we can only use the experimental animal model to control single variables such as age, gender, weight, feeding environment, and other possible factors. The major advantage of our experimental animal model of IDD is the accelerated process of IDD. Our protocol also avoided any differences caused by cells. The results of the in-vitro and animal experiments suggest a potential molecular pathway relevant to IDD, which could be of diagnostic or therapeutic value.
Materials and methods
Bioinformatics Analysis
The downstream regulatory genes of miR-140-3p were predicted using the bioinformatics online resource ‘starbase’ (http://starbase.sysu.edu.cn/) and ‘TargetScan’ (http://www.targetscan.org/vert_71/). Genes related to IDD were identified using the ‘GeneCards’ database (https://www.genecards.org/). The intersection of the target genes and the related genes was obtained using the ‘jvenn’ tool (http://jvenn.toulouse.inra.fr/app/example.htmL). To further screen genes, we classified genes using the ‘Panther’ website (http://www.pantherdb.org/) and selected genes serving as transcriptional regulators for further analysis. The ‘TargetScan’ database (http://www.targetscan.org/vert_71/) was used to predict the targets of miR-140-3p. To predict the downstream regulatory genes of transcription factors, we queried gene interaction proteins through the ‘GeneCards’ database, and utilized the ‘STRING’ website (https://string-db.org/) to analyse the interaction protein network relationships. The network relationship was visualized in Cytoscape 3.5.1, and the intersection of core genes with IDD-related genes was screened again using the ‘jvenn’ tool.
Establishment and grouping of IDD models
A total of 64 three-month-old SPF male SD rats (Shanghai Slac Laboratory Animal Co. Ltd., Shanghai, China) weighing 210 ~ 260 g were used to establish the IDD model using annulus needle puncture. The animal experimental protocols were approved by the Ethnic Committee of The First Hospital of Jilin University and conducted in strict accordance to the standard of the Guide for the Care and Use of Laboratory Animals. All efforts were made to minimize the numbers and suffering of the included animals.
Rats were deprived of food for 12 h and deprived of water for 4 h before surgery, and anesthetized with an intraperitoneal injection of 3.5 mL/kg of 10% chloral hydrate. The needle was inserted obliquely, inward from the right lower abdomen, just to break through the peritoneum, so as to avoid intestinal obstruction after anaesthesia caused by injection into the bowel, where the depth of the needle insertion was about 1 cm. Before the operation, an X-ray was used to locate and mark the 7–8th coccyx (Co7-8) of the rat. A 21 G needle (inner diameter = 0.51 mm and outer diameter = 0.81 mm) was applied to penetrate vertically through the Co7-8 intervertebral space. The needle was rotated for 5 s and stayed for 30 s and then pulled out. Rats were placed in cages without food or water deprivation and observed for infection.
Eight SD rats were not modelled in Co7-8, and included as the control group (also as the sham group), and 8 IDD model rats were not treated with injection. Forty-eight IDD model rats (8 rats per group) were injected with the following agents or lentiviruses: PBS, mimic negative control (NC), miR-140-3p mimic, mimic NC + shRNA (sh)-NC, miR-140-3p mimic + sh-NC, and miR-140-3p mimic + sh-Slug.
The rat IDD models established in this study were evaluated according to Masuda’s method of histopathological scoring of intervertebral discs [28].
X-ray examination and image analysis
X-ray examinations were performed on eight rats from each group at 4 days, 7 days, 14 days and 28 days after puncture modelling [29]. All X-ray examination images were analysed with medical image analysis software (DICOM3.0, Neusoft® PACS/RIS, Neusoft). The disc height and the height of the upper and lower vertebral bodies were measured with blinding, and the disc height index (DHI) was calculated. The DHI (%) was applied to represent the changing trend of the disc segments at different time points.
RNA extraction and qRT-PCR
Total RNA was extracted from tissues and cells using the TRIzol method, and the concentration and purity of the extracted total RNA was measured by a nanodrop2000 micro ultraviolet spectrophotometer (1011 U, nanodrop, USA). RNA integrity was assessed using 10 g RNA sample. 2.5 µL formaldehyde and 5 µL deionized formamide were mixed and heated at 65°C for 5 min to denature. After removal and cooling on ice, 1.2% agar sugar gel was electrophoresed and stained with hexyl bromide, and a gel imaging system was used to image the integrity of RNA. For the RNA stability test, the extracted RNA was stored at room temperature (about 20°C) for 24 h and 48 h, and agarose gel electrophoresis was performed. Some samples were stored at – 20°C for 1 d, 3 d, 5 d, 8 d, 16 d, 20 d, and tested using agarose gel electrophoresis. Using TaqMan MicroRNA Assays Reverse Transcription primer (4,427,975, Applied Biosystems, USA)/PrimeScript RT reagent Kit (RR047A, Takara, Japan), RNA was reverse transcribed to generate cDNA. The primers were synthesized by TaKaRa (Table 1). Real-time PCR was performed using an ABI7500 quantitative PCR instrument (7500, ABI, USA). U6 or GAPDH was used as the internal reference gene, and the relative quantitative 2−ΔΔCT method was applied to calculate the relative expression levels of genes to be tested. The relative transcription level of the target gene was calculated: ΔΔCt = ΔCt experimental group – ΔCt control group, and ΔCt = Ct target gene – Ct internal reference. Each experiment was repeated three times.
Table 1.
Primer sequences for qRT-PCR
| Name | Sequence |
|---|---|
| miR-140-3p | F: 5′-GGGCTACCACAGGGTAGAA-3′ |
| R: 5′-GTGCAGGGTCCGAGGT-3′ | |
| KLF5 | F: 5′-AGCCACCAGAGCGAATCC-3′ |
| R: 5′-GCCAGCCATAGAGACATTAAGG-3′ | |
| N-cadherin | F: 5′-TGTTGCTGAAGAAAACCAAG-3′ |
| R: 5′-TGTTGCTGAAGAAAACCAAG-3′ | |
| MDM2 | F: 5′-CCGAGCGAAATGGTCTCTCA-3′ |
| R: 5′-CTGCAGACCGCTGCTACTC-3′ | |
| Slug | F: 5′-AGACTCCAGCCCAAGCTTTC-3′ |
| R: 5′-GCTTTTCCCCAGTGTGTGTTC-3′ | |
| OCT4 | F: 5′-CCACTTCACCACACTCTACT-3′ |
| R: 5′-GTCACCGCATGTTAGAAGAC-3′ | |
| NANOG | F: 5′-GTCTGCTACTGAGATGCTCT-3′ |
| R: 5′-ATCTGCTGGAGGCTGAGGTA-3′ | |
| U6 | F: 5′-CTCGCTTCGGCAGCACA-3′ |
| R: 5′-AACGCTTCACGAATTTGCGT-3′ | |
| GAPDH | F: 5′-CAAGGTCATCCATGACAACTTTG-3′ |
| R: 5′-GTCCACCACCCTGTTGCTGTAG-3′ |
F, forward; R, reverse.
Tissue processing and paraffin embedding
At 28 days after modelling, the experimental animals were sacrificed by overdose anaesthesia of 10% chloral hydrate (10 mL/kg) after examination by X-ray and MRI. The rat tail was traversed with a surgical blade from the IVDs of Co6-7 and Co8-9, and the tail segment of the middle segment of the Co7-8 disc segment was harvested. The epidermis was peeled off, but intact discs, vertebral bodies, and muscle ligaments were preserved. The specimen was soaked in 10% formalin solution for 48 h, and then immersed in 10% neutral EDTA solution to decalcify until the specimen could be punctured with a needle without obstruction, and paraffin embedding was performed. The samples were dehydrated with gradient alcohol, cleared with xylene, and immersed in wax for 3 h, and then embedded in paraffin. The specimens were sectioned into cross sections with a thickness of 5 μm using a Leica LM2300 paraffin microtome.
Haematoxylin-eosin (HE) staining and safranin O-fast green staining
HE staining and safranin O-fast green staining were used to observe the histological morphology of NP tissue of IVD in rats. For HE staining [30], paraffin sections were stained with haematoxylin and then stained with Eosin. For safranin O-fast green staining [31], paraffin sections were stained with haematoxylin and then stained with fast green followed by safranin O staining. The sections were dehydrated with gradient alcohol, cleared with xylene, sealed with neutral gum, and examined under a light microscope.
Isolation and culture of rat nucleus pulposus MSCs (NPMSCs)
The excised NP tissue from degenerated IVD was minced and centrifuged at 2000 rpm and the supernatant was discarded. The tissue was next incubated with 0.05% type II collagenase at 37°C for 2 h, and 10 mL of DMEM/F12 complete medium was added to stop the reaction. The tissue was centrifuged again at 2000 rpm, discarding the supernatant. Tissues were then resuspended in 20% foetal bovine serum medium, and the medium was changed after 5 ~ 7 days of culture at 37°C and 5% CO2, and the solution was changed every 2 days thereafter. Cells were passaged until 80% confluence was reached, and continued to be cultured until passage 2 (P2) for use.
Flow cytometric detection of surface antigen expression
The cells to be identified were digested with trypsin at 37°C, centrifuged at 1000 rpm, and the supernatant was discarded. Cells were fixed with 4% paraformaldehyde for 30 min, washed with PBS, centrifuged at 1000 rpm, and the supernatant was discarded. The cells were incubated with 0.1% Triton-100 at room temperature, and counted after resuspending in PBS. The cells to be tested were adjusted to a density of 1 × 10⁶ cells/mL per group. Cells were incubated with diluted fluorescein-labelled antibodies (APC-labelled mouse anti-human CD29 monoclonal antibody, PE-labelled mouse anti-human CD44 monoclonal antibody, and FITC-labelled mouse anti-human CD73 monoclonal antibody) on ice for 30 min. After centrifugation at 1000 rpm, the supernatant was discarded. The cells were added with cold PBS and gently pipetted, placed in a flow tube, and detected at 4°C in the dark.
Cell treatment and grouping
Nucleus pulposus mesenchymal stem cells of rat degenerative IVD (D-NPMSCs) were cultured in RPMI 1640 medium containing 10% foetal bovine serum at 37°C with 5% CO2. When cells were in the logarithmic growth phase, they were digested with 0.25% trypsin and seeded into a six-well plate. After 24 h, the cells were transfected with plasmid that was transiently transfected into the degenerated IVD of the rat under the guidance of lipofectamine2000 (Invitrogen, USA). The cells were transfected with mimic NC (negative control of miR-140-3p mimic), miR-140-3p mimic, mimic NC + overexpression (oe) NC (overexpression control of KLF5/oe-MDM2), miR-140 mimic + oe-NC, miR-140 mimic + overexpression plasmid of KLF5 (oe-KLF5); mimic NC + oe-NC + sh-NC (control of knockdown N-cadherin/Slug), miR-140 mimic + oe-NC + sh-NC, miR-140 mimic + oe-NC + shRNA targeting N-cadherin (sh-N-cadherin), miR-140 mimic + sh-NC + overexpression plasmid of MDM2 (oe-MDM2), mimic NC + sh-NC, miR-140 mimic + sh-NC, and miR-140 mimic + shRNA targeting Slug (sh-Slug). The target sequences for shRNA were listed as follows: sh NC: 5ʹ-AATTCTCCGAACGTGTCACGT-3ʹ; Sh-Slug: 5ʹ-CAGACCCATTCTGATGTAAAG-3ʹ; sh-N-cadherin: 5ʹ-GGAUGUGCAGGAAGGACAG-3ʹ. MicroRNA mimics and microRNA sequences were from sanger miRNA database (http://microrna.sanger.ac.uk/sequences), microRNA Inhibitors were obtained from sanger miRNA database (http://microrna.sanger.ac.uk), and then synthesized by Sino biological (Beijing, China). Transfection plasmids were synthesized by Sino biological. The cells were exchanged for 6 h after transfection, and collected for subsequent experiments after 48 h of culture.
CCK-8 assay and scratch test
CCK-8 assay [32] was used for the assessment of cell viability. The D-NPMSCs with a confluence of about 80% were digested with 0.25% trypsin to make a single-cell suspension. Cells were seeded (3 × 10³ ~ 6 × 10³ cells/well) in a 96-well plate with a volume of 200 μL per well. Each group of experiments was repeated in six wells. The cells were removed from the culture plates at 24 h, 48 h, and 72 h. Then, 10 μL of CCK-8 (Sigma, USA) was added to each well and incubation was continued for 2 h. The optical density (OD) value of each well at 450 nm was determined by an ELISA microplate reader. Scratch test [33] was applied for the assessment of cell migration. The D-NPMSCs, 48 h after transfection of plasmids, were seeded into 6-well plates at 5 × 10⁵ cells/well. After the cells were completely adherent, a 2 mm cell scratch was scratched in the middle of each well, and cultured for 24 h. Images were taken at 0 h and 24 h after cell scratches, and the scratch healing rate was calculated using Image-Pro plus 6.0. Each group was represented by at least three independent biological replicates.
Flow cytometric detection of apoptosis
Apoptosis was assessed using AnnexinV-FITC/PI double staining method by flow cytometry (BD FACSCalibur). D-NPMSCs were seeded into 6-well plates at 2 × 10⁵ cells/well. After 72 h of transfection, the cells were trypsinized and collected in a centrifuge tube, followed by centrifugation at 800 g to discard the supernatant. An Apoptosis Detection Kit (AnnexinV-FITC Apoptosis Detection Kit) was used according to standard instructions, and cells were resuspended in the binding buffer, and incubated with 5 μL FITC and 5 μL PI for 15 min.
Adipogenic induction and Oil Red O staining
D-NPMSCs at a confluence of about 80% were seeded in a petri dish at 8 × 10³ cells/cm2 after trypsinization, followed by incubation at 37°C, 5% CO2. When cell confluence reached 60%, the culture medium was removed, and the cells were added with adipogenic induction medium. The same batch of cells was cultured with a conventional medium as a control group. The induction solutions of the experimental group and the control group were changed every three days. When a large number of transparent lipid droplets were seen in the monolayer of cells under the microscope, oil red O staining [34] was performed. The adipogenic induction medium was discarded, and the cells were fixed at room temperature by adding 4% paraformaldehyde solution. Finally, freshly prepared 0.6% oil red O working solution was added for staining. If the transparent lipid droplets were stained well, 60% isopropanol was supplemented to discolour the background. The cells were then observed and photographed under a microscope.
Osteogenic induction and alizarin red staining
D-NPMSCs with a confluence of about 80% were seeded in a petri dish at 8 × 10³ cells/cm2 after trypsinization, followed by incubation at 37°C, 5% CO2. When the cell confluence reached 60%, the culture medium was removed, and the cells were added with osteogenic induction medium. The same batch of cells was cultured with a conventional medium as a control group. The induction solutions of the experimental group and the control group were changed every three days without light exposure. After 2 ~ 3 weeks of culture, the appearance of white nodules was observed in monolayer cells under an inverted microscope, and then alizarin red staining [35] was performed. The osteogenic induction medium was discarded, and the cells were fixed at room temperature by adding 4% paraformaldehyde solution. Freshly prepared 1% Alizarin Red Dye Solution was then supplemented for staining. If white nodules on most cell surfaces were stained, the staining solution was discarded. Cells were washed three times with ultrapure water and observed and photographed under a microscope.
Luciferase activity assay
The predicted binding site fragment and mutant of KLF5 mRNA and miR-140-3p were inserted into the luciferase reporter vector as reporter plasmids KLF5-WT and KLF5-MUT. MiR-140-3p mimic NC and miR-140-3p mimic were co-transfected with KLF5 mRNA luciferase reporter plasmid into HEK293T cells (Oulu Biotecnology, China) to test whether miR-140-3p can bind to 3ʹ-UTR of KLF5 mRNA. Cells were collected and lysed 48 h after transfection. The luciferase reporter assay was performed using the luciferase detection kit (K801-200, Biovision), and the dual luciferase reporter gene analysis system (Promega, USA). Renilla luciferase was employed as an internal reference, and the degree of activation of the target reporter gene was compared based on the ratio of the firefly luciferase RLU divided by the Renilla luciferase RLU.
Western blots
D-NPMSCs were lysed by RIPA lysis buffer (Beyotime Biotechnology, China) and centrifuged at 14,000 rpm, 4°C to obtain the supernatant. The protein extract was measured by BCA method (Pierce, USA). The separated proteins were electrophoresed and transferred to a PVDF membrane. Then, the PVDF membrane was blocked in 5% skimmed milk powder for 1 h at room temperature. The blots were probed with primary antibodies (anti-rabbit KLF5, 1:500 ~ 1:3000; anti-rabbit N-cadherin, 1:1000; anti-rabbit MDM2, 1:1000; anti-rabbit Slug, 1:500 ~ 1:1000; Abcam, USA) at 4°C overnight. The membrane was washed with PBST at room temperature and incubated with horseradish peroxidase (HRP) labelled goat anti-rabbit IgG secondary antibody (Santa Cruz, USA) for 1 h at room temperature. ECL reaction images were acquired and observed (Bio-Rad ChemiDoc ™ imaging system). GAPDH (anti-mouse, Santa Cruz, USA) was adopted as an internal reference, and protein band images were analysed with ImageJ2x software. Each group was confirmed by at least three independent biological replicates.
ChIP assay
The D-NPMSCsat density of 1 × 10⁶ cells/10 cm dish were fixed in 1% formaldehyde solution. The cells were washed in PBS and centrifuged to obtain cell pellets. Cells were resuspended in SDS lysis buffer, cross-linked on ice, and chromatin DNA was sonicated. Centrifugation at 14,000 rpm/4°C was performed to harvest the supernatant. After the supernatant was diluted with a CHIP dilution buffer containing a protease inhibitor, the blocking solution was added and incubated at 4°C for 30 min. Centrifugation at 1000 rpm/4°C was performed and a small amount of supernatant was taken as Input. One part of the remaining supernatant was incubated with KLF5 antibody (anti-Rabbit, Abcam, China), and the other part was incubated with negative control IgG (anti-Rabbit, Abcam, China) at 4°C overnight. Cross-link agarose was employed for incubation at 4°C for 1 h to collect antibody/transcription factor complexes. Centrifugation at 1000 rpm/4°C was carried out and the supernatant was discarded. After sufficient washing, the pellet was eluted with elution buffer. The eluted supernatant and Input DNA were respectively added with 20 μL of 5 mol/L NaCl, and then water-bathed at 65°C for 4 h to de-crosslink. Proteinase K digestion was performed to remove protein, purify, and recover DNA. MDM2 expression was measured using qPCR with the recovered DNA as a template.
Statistical analysis
The data were processed using SPSS 21.0 statistical software (IBM SPSS Statistics, Chicago, IL, USA). Measurement data were expressed as mean ± standard deviation. Unpaired data in compliance with normal distribution and homogeneity between two groups were compared using unpaired t-test. Comparisons between multiple groups were conducted with one-way analysis of variance (ANOVA) with Tukey’s post hoc test. Statistical analysis of time-based measurements within each group was performed using repeated measures ANOVA, followed by a Bonferroni’s post-hoc test. A value of p< 0.05 indicated significant difference.
Supplementary Material
Funding Statement
This study was supported in part by grant from National Science Foundation (81670221 to YGZ).
Disclosure statement
No potential conflict of interest was reported by the authors.
Supplementary material
Supplemental data for this article can be accessed here.
References
- [1].Frapin L, Clouet J, Delplace V, et al. Lessons learned from intervertebral disc pathophysiology to guide rational design of sequential delivery systems for therapeutic biological factors. Adv Drug Deliv Rev. 2019;149-150:49–71. [DOI] [PubMed] [Google Scholar]
- [2].Blanquer SB, Grijpma DW, Poot AA.. Delivery systems for the treatment of degenerated intervertebral discs. Adv Drug Deliv Rev. 2015;84:172–187. [DOI] [PubMed] [Google Scholar]
- [3].Hodgkinson T, Shen B, Diwan A, et al. Therapeutic potential of growth differentiation factors in the treatment of degenerative disc diseases. JOR Spine. 2019;2:e1045. [DOI] [PMC free article] [PubMed] [Google Scholar]
- [4].Xu WN, Zheng HL, Yang RZ, et al. Mitochondrial NDUFA4L2 attenuates the apoptosis of nucleus pulposus cells induced by oxidative stress via the inhibition of mitophagy. Exp Mol Med. 2019;51:1–16. [DOI] [PMC free article] [PubMed] [Google Scholar]
- [5].Clouet J, Fusellier M, Camus A, et al. Intervertebral disc regeneration: from cell therapy to the development of novel bioinspired endogenous repair strategies. Adv Drug Deliv Rev. 2019;146:306–324. [DOI] [PubMed] [Google Scholar]
- [6].Sakai D, Andersson GB.. Stem cell therapy for intervertebral disc regeneration: obstacles and solutions. Nat Rev Rheumatol. 2015;11:243–256. [DOI] [PubMed] [Google Scholar]
- [7].Longo UG, Papapietro N, Petrillo S, et al. Mesenchymal stem cell for prevention and management of intervertebral disc degeneration. Stem Cells Int. 2012;2012:921053. [DOI] [PMC free article] [PubMed] [Google Scholar]
- [8].Zhang H, Zhang M, Meng L, et al. Investigation of key miRNAs and their target genes involved in cell apoptosis during intervertebral disc degeneration development using bioinformatics methods. J Neurosurg Sci. 2020. doi: 10.23736/S0390-5616.20.04773-6. [DOI] [PubMed] [Google Scholar]
- [9].Ji ML, Jiang H, Zhang XJ, et al. Preclinical development of a microRNA-based therapy for intervertebral disc degeneration. Nat Commun. 2018;9:5051. [DOI] [PMC free article] [PubMed] [Google Scholar]
- [10].Ye D, Dai L, Yao Y, et al. miR-155 inhibits nucleus pulposus cells’ degeneration through targeting ERK 1/2. Dis Markers. 2016;2016:6984270. [DOI] [PMC free article] [PubMed] [Google Scholar]
- [11].Zhang Q, Weng Y, Jiang Y, et al. Overexpression of miR-140-5p inhibits lipopolysaccharide-induced human intervertebral disc inflammation and degeneration by downregulating toll-like receptor 4. Oncol Rep. 2018;40:793–802. [DOI] [PubMed] [Google Scholar]
- [12].Taniguchi Ishikawa E, Chang KH, Nayak R, et al. Klf5 controls bone marrow homing of stem cells and progenitors through Rab5-mediated beta1/beta2-integrin trafficking. Nat Commun. 2013;4:1660. [DOI] [PMC free article] [PubMed] [Google Scholar]
- [13].Xie Z, Jie Z, Wang G, et al. TGF-beta synergizes with ML264 to block IL-1beta-induced matrix degradation mediated by Kruppel-like factor 5 in the nucleus pulposus. Biochim Biophys Acta Mol Basis Dis. 2018;1864:579–589. [DOI] [PubMed] [Google Scholar]
- [14].Zhang BDJT. Abstract 1491: downregulation of KLF5 contributes to TGF-β- and EGF-induced EMT by reducing miR-200s. Cancer Res. 2013;73:1491.23338609 [Google Scholar]
- [15].Wang P, Lu YC, Li YF, et al. Advanced glycation end products increase MDM2 expression via transcription factor KLF5. J Diabetes Res. 2018;2018:3274084. [DOI] [PMC free article] [PubMed] [Google Scholar]
- [16].Wang SP, Wang WL, Chang YL, et al. p53 controls cancer cell invasion by inducing the MDM2-mediated degradation of Slug. Nat Cell Biol. 2009;11:694–704. [DOI] [PubMed] [Google Scholar]
- [17].Adams MA, Roughley PJ. What is intervertebral disc degeneration, and what causes it? Spine (Phila Pa 1976). 2006;31:2151–2161. [DOI] [PubMed] [Google Scholar]
- [18].Liu W, Zhang Y, Feng X, et al. Inhibition of microRNA-34a prevents IL-1beta-induced extracellular matrix degradation in nucleus pulposus by increasing GDF5 expression. Exp Biol Med (Maywood). 2016;241:1924–1932. [DOI] [PMC free article] [PubMed] [Google Scholar]
- [19].Tao B, Yi J, Huang C, et al. microRNA96 regulates the proliferation of nucleus pulposus cells by targeting ARID2/AKT signaling. Mol Med Rep. 2017;16:7553–7560. [DOI] [PubMed] [Google Scholar]
- [20].Zhou X, Chen L, Grad S, et al. The roles and perspectives of microRNAs as biomarkers for intervertebral disc degeneration. J Tissue Eng Regen Med. 2017;11:3481–3487. [DOI] [PubMed] [Google Scholar]
- [21].Yang S, Li L, Zhu L, et al. Aucubin inhibits IL-1beta- or TNF-alpha-induced extracellular matrix degradation in nucleus pulposus cell through blocking the miR-140-5p/CREB1 axis. J Cell Physiol. 2019;234:13639–13648. [DOI] [PubMed] [Google Scholar]
- [22].Lehmann TP, Jakub G, Harasymczuk J, et al. Transforming growth factor beta mediates communication of co-cultured human nucleus pulposus cells and mesenchymal stem cells. J Orthop Res. 2018;36:3023–3032. [DOI] [PubMed] [Google Scholar]
- [23].Oishi Y, Manabe I, Tobe K, et al. Kruppel-like transcription factor KLF5 is a key regulator of adipocyte differentiation. Cell Metab. 2005;1:27–39. [DOI] [PubMed] [Google Scholar]
- [24].Hwang PY, Jing L, Chen J, et al. N-cadherin is key to expression of the nucleus pulposus cell phenotype under selective substrate culture conditions. Sci Rep. 2016;6:28038. [DOI] [PMC free article] [PubMed] [Google Scholar]
- [25].Morimoto Y, Mizushima T, Wu X, et al. miR-4711-5p regulates cancer stemness and cell cycle progression via KLF5, MDM2 and TFDP1 in colon cancer cells. Br J Cancer. 2020;122:1037–1049. [DOI] [PMC free article] [PubMed] [Google Scholar]
- [26].Jin LZ, Lu JS, Gao JW. Silencing SUMO2 promotes protection against degradation and apoptosis of nucleus pulposus cells through p53 signaling pathway in intervertebral disc degeneration. Biosci Rep. 2018;38(3):BSR20171523. doi: 10.1042/BSR20171523. [DOI] [PMC free article] [PubMed] [Google Scholar] [Retracted]
- [27].Tang Y, Weiss SJ. Snail/Slug-YAP/TAZ complexes cooperatively regulate mesenchymal stem cell function and bone formation. Cell Cycle. 2017;16:399–405. [DOI] [PMC free article] [PubMed] [Google Scholar]
- [28].Masuda K, Aota Y, Muehleman C, et al. A novel rabbit model of mild, reproducible disc degeneration by an anulus needle puncture: correlation between the degree of disc injury and radiological and histological appearances of disc degeneration. Spine (Phila Pa 1976). 2005;30:5–14. [DOI] [PubMed] [Google Scholar]
- [29].Zhang Y, He F, Chen Z, et al. Melatonin modulates IL-1beta-induced extracellular matrix remodeling in human nucleus pulposus cells and attenuates rat intervertebral disc degeneration and inflammation. Aging (Albany NY). 2019;11:10499–10512. [DOI] [PMC free article] [PubMed] [Google Scholar]
- [30].Wang F, Nan LP, Zhou SF, et al. Injectable hydrogel combined with nucleus pulposus-derived mesenchymal stem cells for the treatment of degenerative intervertebral disc in rats. Stem Cells Int. 2019;2019:8496025. [DOI] [PMC free article] [PubMed] [Google Scholar]
- [31].Jiang C, Guo Q, Jin Y, et al. Inhibition of EZH2 ameliorates cartilage endplate degeneration and attenuates the progression of intervertebral disc degeneration via demethylation of Sox-9. EBioMedicine. 2019;48:619–629. [DOI] [PMC free article] [PubMed] [Google Scholar]
- [32].Yan H, Gao Y, Ding Q, et al. Exosomal micro RNAs derived from dermal papilla cells mediate hair follicle stem cell proliferation and differentiation. Int J Biol Sci. 2019;15:1368–1382. [DOI] [PMC free article] [PubMed] [Google Scholar]
- [33].Kim S, Yao J, Suyama K, et al. Slug promotes survival during metastasis through suppression of Puma-mediated apoptosis. Cancer Res. 2014;74:3695–3706. [DOI] [PMC free article] [PubMed] [Google Scholar]
- [34].Shi JH, Zuo KY, Zhang YY, et al. NANOG alleviates the damage of human hair follicle mesenchymal stem cells caused by H2O2 through activation of AKT pathway. Biomed Environ Sci. 2019;32:272–280. [DOI] [PubMed] [Google Scholar]
- [35].Spalletta S, Flati V, Toniato E, et al. Carvacrol reduces adipogenic differentiation by modulating autophagy and ChREBP expression. PLoS One. 2018;13:e0206894. [DOI] [PMC free article] [PubMed] [Google Scholar]
Associated Data
This section collects any data citations, data availability statements, or supplementary materials included in this article.