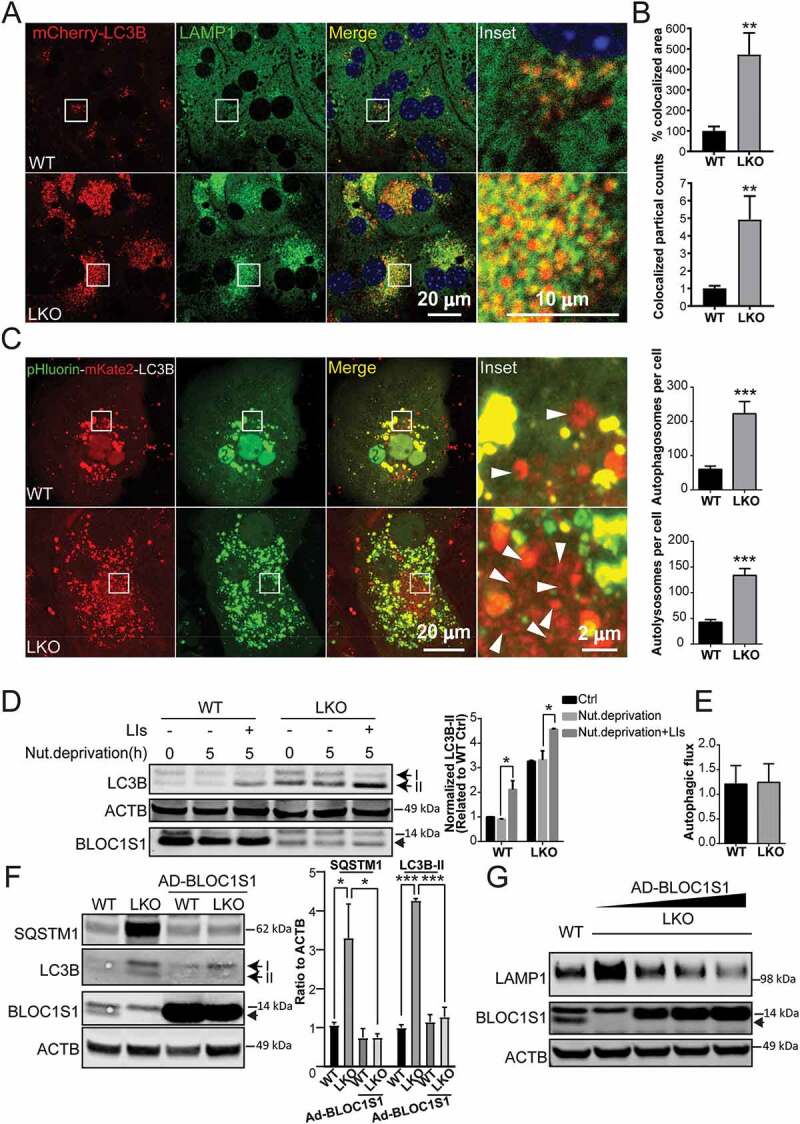
Figure 2.

LKO hepatocyte maintain autophagic flux despite impaired clearance of autophagosomes. (A) Confocal microcopy showing autolysosome accumulation in LKO hepatocytes. The autolysosomes were visualized after transfection with transfected with mCherry-LC3B (red) and compared to the endogenous lysosome enriched protein LAMP1 (green). The overlaid puncta (yellow) represent ALs. DNA was visualized with DAPI staining (blue). (B) The colocalized area (yellow) and colocalized puncta (red-green-positive puncta) were determined in whole cell. n > 5 cells from each group were analyzed. (C) Confirmatory confocal microscopy using pHluorin-mKate2, tandem fluorescent protein-tagged LC3B showed accumulation of both autophagosomes (yellow) and acidified (red – mKate2) ALs in LKO hepatocytes in response to 5 h of nutrient deprivation. The arrowhead indicated the formation of autolysosome (red puncta). (D) Biochemical analysis showing equivalent autophagic flux as shown by the accumulation of LC3B-II in both genotypes in response to the combination of nutrient deprivation and LIs (leupeptin and pepstatin A, 20 µM each). Cell lysates were immunoblotted with antibodies targeting LC3B, BLOC1S1, and ACTB. The intensity of LC3B-II bands was normalized to ACTB and expressed as a ratio relative to WT Ctrl (*p < 0.05, n = 4 experiments). (E) Autophagic flux in WT and LKO hepatocytes was calculated by using the normalized intensity of LC3B-II with LIs minus the intensity of LC3B-II without LIs after 5 h starvation and expressed as a ratio relative to WT Starvation.(F) Representative immunoblot analysis showing restoration of autophagic turnover in LKO hepatocytes following the rescue of BLOC1S1 levels by the measurement of autolysosome substrates SQSTM1 and LC3B-II (n = 3). (G) Immunoblot analysis showing the BLOC1S1-dose responsive dissipation of LAMP1 levels in LKO hepatocytes in response to increasing amounts of Ad-BLOC1S1 transduction (n = 3). Endogenous BLOC1S1 immunoblot expression is depicted with a solid arrowhead
