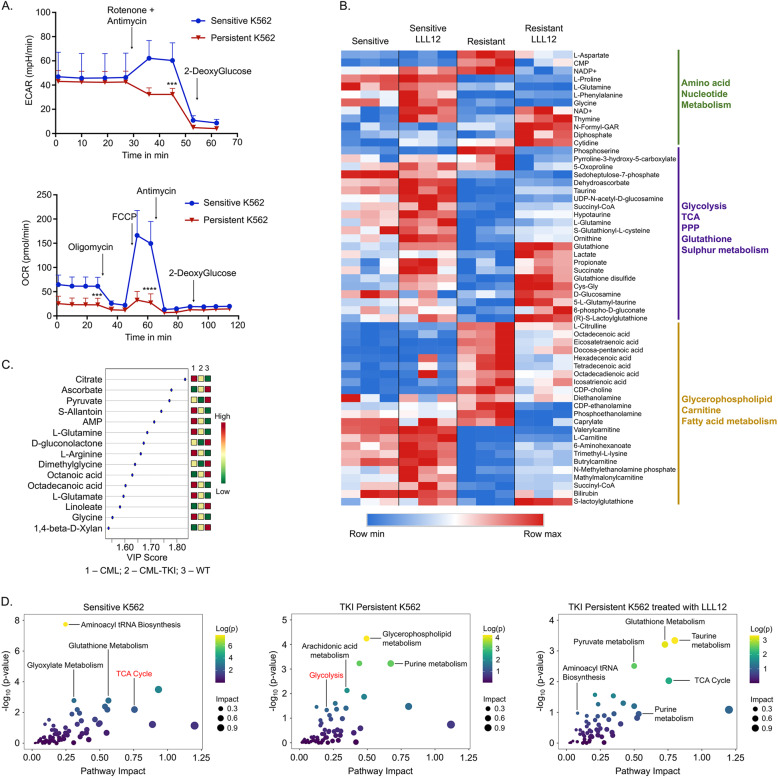
Fig. 4. STAT3 contributes to altered metabolism in TKI-persistent CML cells.
A ECAR (top) from glycolysis rate assay (GRA) and OCR (bottom) from mitochondrial stress test (MST) of 75,000 sensitive and IM-persistent K562 measured by seahorse. B Heatmap for the top 50 differentially expressed metabolites between IM-persistent K562 and those treated with LLL12 (1 µM) with a p value ≤0.05. Raw values were used to generate the heatmap. C VIP plot for component 1 of the PLS-DA comparing WT HSCs, CML LSCs, IM-persistent CML LSCs. The VIP score indicates the contribution of the metabolite to the clustering pattern. D Scatter plots obtained from integration of the K562 metabolic profile with the K562 RNA-seq data. All figures are mean ± SD of a representative data of at least 2–3 independent experiments. Unpaired student t test. was used to determine statistical significance with Tukey’s multiple comparison. p values < 0.05 were considered statistically significant. *p < 0.05, **p < 0.01, ***p < 0.001, ****p < 0.0001; ns = not significant.

