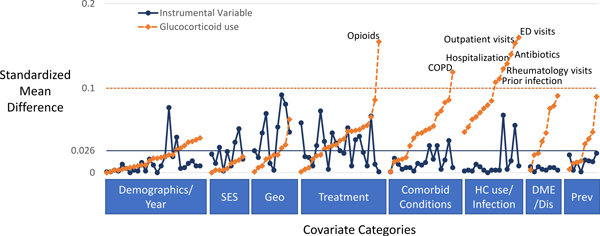
Figure 2: Standardized differences for covariates across the proposed IV (blue) or across the exposure (glucocorticoids, orange).
Each dot represents a dichotomous variable or category of a categorical variable (for specific values see eTable 4). Horizontal lines represent cut-offs for potentially importance standardized differences (0.1 for differences across the exposure and a more stringent 0.026 for differences across the proposed instrumental variable based on the complier rate times 0.2). SES = socioeconomic status, Geo = geography, HC use = healthcare use, DME/Dis = durable medical equipment/disability; Prev = preventive treatment (screening, immunizations)

