

Abstract
Background
Triage is a critical first step in appropriately caring for patients in the emergency department (ED). Patients’ assumptions of the care they will receive can be established in triage. Interruptions to this process can disrupt patient flow, cause errors and lead to patient dissatisfaction.
Objective
The purpose of this study was to determine how the frequency and duration of interruptions during triage are associated with errors, patient satisfaction and patient’s perception of the care they received.
Methods
Prospective, observational, cohort study conducted in the ED of a Level 1 trauma center. Interruptions were measured using time-and-motion observations of triage interviews performed by nurses and physicians. Patients were surveyed immediately after triage interviews were complete.
Results
Surveys were completed for 178 observations. In total, 62.9% of the observations were interrupted between 1 and 5 times. While interruptions did not significantly influence patient satisfaction directly, interruptions positively influenced triage duration, which was negatively associated with patient satisfaction. Increased errors were associated with increasing frequency of triage interruptions. Triage interruptions were not associated with either patient satisfaction or perceived caregiver competence. Overall, the majority (76.6%) of patients were satisfied with their care; patient satisfaction was associated with the perceived competency of caregivers but was not associated with errors.
Conclusion
Interruptions are associated with increased errors and delays in patient care. Although increased triage duration adversely affected patient satisfaction, patients’ perceptions were not influenced by interruptions. While patient satisfaction is essential, a lack of association between patient satisfaction and errors suggests that using patient satisfaction as a measure of care quality may omit important safety information.
Keywords: triage, interruption, patient satisfaction, perception of care, quality
Background
‘You never have a second chance to make a first impression’. Because satisfaction is broadly used as a prominent quality measure [1], a patient’s first impression of their hospital experience is important. Triage is the critical first step in the treatment of patients entering an emergency department (ED). During triage, nurses conduct an interview to determine the reason for seeking care. Triage interviews are typically conducted by a nurse assigning an acuity score for each patient. An accurate and efficient triage process is important to delivering time-sensitive and safe care. Interruptions to this process can disrupt patient flow, introduce errors and harm and/or dissatisfy patients [2].
Interruptions can be a source of error and inefficiency in the triage process [3, 4]. Defined as a break in the performance of an activity [5], interruptions can contribute to catastrophic errors in healthcare [6]. ED volumes are unpredictable by nature, owing to the ability for patients to ‘walk in’ for care (as opposed to by appointment or referral) with varying acuity levels. Interruptions tend to occur more frequently in the ED work environment compared with other care settings [7].
A patient seeking treatment may have a triage interview interrupted for myriad reasons, often for reasons unrelated to patient care [8]. Such interruptions in the triage process can generate challenges in the present and future care of the patient, including distracting nurses from collecting appropriate data; lower-quality or inaccurate triage decisions (e.g. due to a missed symptom identification or incomplete assessment); rework for nurses due to forgetting [9]; delays in care [10]; and potential increases in morbidity or mortality [6].
There is a compelling need to understand how triage interruptions affect patient satisfaction and perceptions of care. Several studies have examined the effects of interruptions on specific tasks or persons [10–12] but have yet to fully evaluate their impact on patients’ satisfaction and their perceptions of care quality. While some studies found links between interruptions and decreased patient satisfaction [11], others [13] found that associations between interruptions and patient perception of overall ED quality were based on the source and reason for the interruption. However, none of the studies looking at patient perceptions of care were based on the triage interview. Therefore, the aim of this study was to identify how the frequency and duration of interruptions during triage affect patient satisfaction and the patient’s perception of the care they received.
Methods
Design
A prospective, observational, cohort study design was used to examine the effect of triage interruptions on patient care. Local Institutional Review Board approval was obtained. We conducted time-and-motion observations of both nurse triage interviews and initial physician assessments as they occurred in the ED. Prior to conducting observations, consent was obtained from emergency care providers and then these providers each completed a questionnaire. Immediately following each observation, patients were approached to complete a survey about their triage experience and to permit the research team to review their medical records after their discharge. Each provider and patient participant were assigned a unique identifier at time of consent. The data collector recorded provider’s and patient’s identifier at the time of data collection on all data collection instruments. Consistency of data extraction was verified on every tenth record by the first author.
Study setting and participants
Data collection occurred in a 728 bed, academic, Level 1 trauma center located in the midwestern USA with 55 ED beds seeing approximately 75 000 adult patients per year. ED nurses, physicians and patients were invited to participate. Patients were excluded if they were (i) a member of a vulnerable population (i.e. under age 18, incarcerated, cognitive impairment), (ii) assigned an Emergency Severity Index (ESI) of 1 (high acuity), (iii) non-English speakers or (iv) declined to participate.
Data collection instruments
Provider Questionnaires were completed by nurses, physicians, physician’s assistants and nurse practitioners during times when patient care was not occurring (beginning of shift, at the nurse’s station, in the breakroom). The questionnaire included demographic questions, work experience, ED role and provider’s perceptions of the effect of interruptions on patient care.
The Triage Interruptions Assessment Tool (TIAT) was used to measure interruptions [14]. This 66-item instrument with eight subscales is used to measure interruptions in clinical practice and facilitates recording of (i) source of interruption (person initiating interruption); (ii) cause of interruption (mechanism of interrupting); (iii) task interrupted; (iv) provider’s reaction to the interruption; (v) potential impact of interruption on patient outcomes; (vi) errors (vii) duration of triage; and (viii) duration of interruption. This information was collected for every interruption that occurred during the triage interview. The TIAT has strong content validity (CVI = 0.91) and interrater reliability (Cohen’s kappa = 0.773) and has been validated in adult EDs for triage interviews occurring in a designated triage interview area or stretcher-side [14].
Triage duration
It was the amount of time from the start of the triage interview until the provider ended the interview, either by dismissing the patient or by providing a closing statement to the patient (e.g. ‘the physician will be in to see you soon.’). This variable was calculated from data collected on the TIAT.
Errors
Errors include mistakes in assigning correct triage category [15, 16], actual medication errors, adverse events and missed or incorrect documentation [15, 16]. These errors were recorded by observation during the triage interviews and initial assessments [14] and by reviewing (i) incident reports and (ii) the electronic health record (EHR). The following elements of the EHR were searched: discharge summaries; procedure notes; physician progress notes; laboratory reports; physician orders; and nursing/multidisciplinary progress notes. Missed documentation included failure of the triage nurse to obtain and document any medications, medical history, symptoms or complaints. Error data were collected by manually reviewing each section of the triage assessment to identify missing areas or incorrect notes. We developed a case report form to document medications, orders and other activities. Each patient record was reviewed by a research assistant trained to use the form to identify errors. Consistency of data extraction was assessed by the first author for every record where an error was identified.
Patient Survey developed by the research team, was used to measure patient satisfaction and perceptions of care. Surveys included questions on the number and duration of interruptions the patient recalled experiencing during their triage and initial assessment. Patients were also asked to provide feedback on their satisfaction with their experiences, if they perceived any lack of care, and how they perceived the clinical competence of the nurse and physician. Face validity of the surveys was verified by two emergency nurses, two emergency physician, an ED educator and a statistician.
Patient satisfaction
Five-point Likert scales (e.g. 1 = extremely satisfied and 5 = not satisfied) were used to assess satisfaction with the following dimensions of the triage experience: communication with triage nurse/physician; courtesy of nurse/physician; and concern the nurse/physician showed for questions and worries. This information was collected on the patient survey. Prior to the beginning of the study, patient surveys were reviewed by emergency nurses and physicians to help ensure face validity.
Patient perceptions of caregiver competence
These perceptions were measured using questions specific to perceptions of the triage process and the perceived effects of interruptions on triage. Similar to the Consumer Assessment of Healthcare Providers and Systems (CAHPS) survey, the assessment of perceptions of care included questions about communication of physicians and nurses, responsiveness of staff, pain management and willingness to recommend the hospital to others. One component not included in CAHPS surveys is the patient’s assessment of the providers’ clinical competency. We asked participants to rate the competency of care received from each provider using a five-point Likert scale (e.g. 1 = excellent and 5 = poor) to capture perceptions of nurse/physician competence. This information was collected on the patient survey.
Data analysis
Descriptive analysis was conducted with Spearman’s rho correlations used to evaluate the strength of the association between triage and interruption duration (continuous variables collected on the TIAT) and satisfaction and competency (both rank-order variables collected from the Patient Survey). ANOVA was used to compare the triage duration between interrupted and uninterrupted triage interviews (collected on the TIAT), which is appropriate and preferable to Kruskall–Wallis given the homogeneous variances and mild lognormality of the triage durations less any interruption durations [17]. Independence of observations was assumed given the median number of triage sessions per provider was one, and no provider contributed more than five of the 178 triage observations included in analysis. ANOVA was also used to compare patient reported lack of care and satisfaction, caregiver competence (collected from the Patient Survey) and errors (collected from TIAT and chart review). Kendall’s tau was used to evaluate the association between the rank-order variables of patient satisfaction, perception of caregiver competence and errors. Chi-square tests were used to assess associations between patient perception of interruptions (collected from the Patient Survey) and the source and cause of observed interruptions (both collected on the TIAT).
Results
Demographics
Patients
Surveys were completed for 178 observations of 106 providers by 133 patients. Forty-five patients completed surveys on both their nurse triage and the physician-first-assessment encounters. Ten patients and two providers declined to participate. Patient ages ranged 18–82 years (mean = 48.0, SD = 16.51) with 51.6% being female. Patient acuity levels included ESI of 2 (30.7%), 3 (61.4%) and 4 (7.9%).
Providers
Of the 106 providers, 51 (48.1%) were nurses and 55 (51.9%) were physicians. Gender was nearly evenly split with 55 (51.9%) identifying as female. The providers’ ethnicity was primarily white (n = 99; 93.4%), with four (3.8%) being Black and three (2.8%) identifying themselves as other. The age of the providers ranged from 23 to 67 (mean 33.99, SD = 9.57) with years of ED experience ranging from less than 1 year to 38 years (mean 6.36, SD = 9.09).
Interruptions and triage duration
In total, 112 (62.9%) out of the 178 observations (patient triage interviews) were recorded by the study observer as being interrupted. Each interrupted interview experienced from 1 to 5 interruptions (See Figure 1). Interruptions were caused most frequently by other nurses (n = 39, 35%) and physicians (n = 23, 20%). Interruptions caused by other staff members (n = 19, 17%) and patient or family member (n = 14, 12%) were less common. Fourteen interruptions (13%) occurred when the person conducting the interview interrupted themselves (such as remembering to finish a task for a previous patient). Most interruptions occurred through face-to-face interactions (n = 79, 70%). Phone calls and overhead pages/announcements also contributed to interruptions (n = 14, 13%).
Figure 1.

Frequency of interruptions.
The median interruption duration was 55 s (IQR = 18–180 s) and ranged from 2 s to 15.4 min. The median overall triage duration was 7.0 min (IQR = 4.3–10.39 min) and ranged from 0.9 to 74.2 min. As shown in Table 1, we found a negative correlation between triage duration and satisfaction with providers. We also found significant positive correlations between the triage duration and (a) the total interruption time (r = 0.535, P < 0.001) and (b) the number of interruptions (r = 0.277, P < 0.001). ANOVA revealed a significant difference in triage duration between interrupted (median 7.43 min; IQR 5.3–11.9) and uninterrupted (median 5.9 min; IQR 3.0–8.0) triage interviews, F[177] = 4.201, P = 0.042). To determine if the interruption was the cause of the longer triage duration, we subtracted the interruption duration from the triage duration (7.58 min) and compared this estimate of total triage duration to the triage durations for uninterrupted triage interviews (7.19 min). The resulting 14.5 s difference between groups was not statistically significant (t(176) = −0.194, P = 0.846) suggesting that interrupted triage sessions ran longer on average primarily, if not exclusively, because they were interrupted.
Table 1.
Correlations
| Interruption duration | Number of triage interruptions | Perceived provider competency | Satisfaction with providers | |
|---|---|---|---|---|
| Triage duration | 0.535** | 0.365** | −0.110 | −0.195* |
| Interruption duration | 0.372** | −0.105 | −0.101 | |
| How many times was triage interrupted | −0.058 | −0.066 | ||
| Rate the competency of care from provider | 0.640** |
Spearman’s Rho correlations.
P < 0.01
P < 0.05.
Patient-reported interruptions vs. observed interruptions
To determine how often patients identified interruptions when they occurred, we compared the number of patient-reported interruptions obtained from Patient Surveys to the number of observed interruptions recorded on the TIAT (see Table 2). A total of 82 (46%) of the 178 completed patient surveys contained feedback on MD interactions and 96 (54%) RN interactions. A total of 138 (78%) patients reported that their interview was not interrupted; this contrasts with the 62.9% of interviews experiencing an interruption as recorded by a study observer. Of the 40 (22%) patients who reported an interruption, the number of interruptions ranged from 1 to 4 with 62.5% reporting only 1 interruption. In aggregate, patients substantially underreported interruptions.
Table 2.
Frequency of interruptions
| Number of interruptions per encounter | Number of patient perceived interruptions (%) | Number of observed interruptions (%) |
|---|---|---|
| None | 128 (71.9) | 66 (37.1) |
| 1 | 25 (14) | 49 (27.5) |
| 2 | 7 (3.9) | 30 (16.9) |
| 3 | 6 (3.4) | 26 (14.6) |
| 4 | 2 (1.1) | 5 (2.8) |
| 5 | 0 (0) | 2 (1.1) |
A relationship was observed between the patients perceiving an interruption had occurred and the source of the interruptions (χ2 = 18.654, P = 0.017) but did not have a significant relationship with the cause of the interruption (χ2 = 8.3, P = 0.081). The source of the interruption observed by the researchers was a nurse 34.8% of the time. Similarly, patients reported that 35% of the interruptions they perceived were initiated by a nurse. Face-to-face communication caused 72.4% of the interruptions and patients reported that 74.1% of the interruptions they perceived were done face-to-face. Eighty percent (32/40) of the patients that perceived an interruption reported that they felt the interruption was necessary.
Relationship of quality measures and triage interruptions
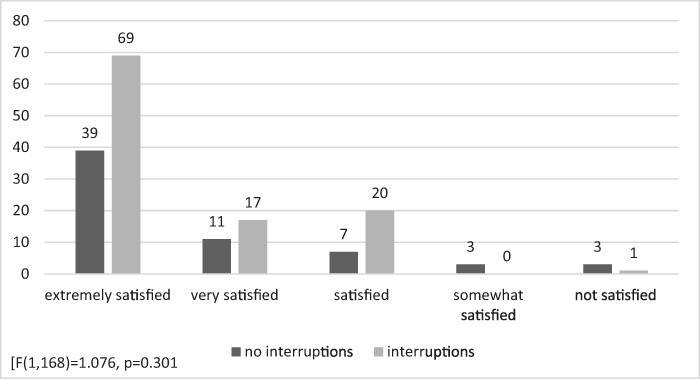
We explored if there was a relationship between triage interruptions and our quality measures of satisfaction, perceived caregiver competence and errors. Satisfaction scores were obtained for 170 (96%) patients and caregiver competence scores were obtained for 167 (94%) patients. Figures 2 and 3 display the frequencies for satisfaction scores and perceived caregiver competency scores for both interrupted and uninterrupted interactions. The association between patient-perceived provider competency and patient satisfaction was strong (Spearman’s rho = 0.640, P = < 0.001).
Figure 2.

Satisfaction scores.
Figure 3.
Perceived caregiver competence.
Errors were observed in twelve triage interviews (n = 11 nurse triage; n = 1 physician), and each occurred when the provider was interrupted. The errors observed include five occurrences of missing acuity score documentation, two acuity score calculation errors and four occurrences of chief complaint inaccuracies. Identification of these errors were verified through chart review by a second researcher. We found no correlation between the number of interruptions and patient satisfaction and no correlation between the number of interruptions and the perception of caregiver competence (Table 3). A significant positive relationship between the number of interruptions and observed errors was identified.
Table 3.
Relationship of the number of interruptions with outcomes
| Patient satisfaction | Perceived caregiver competence | Errors | |
|---|---|---|---|
| Number of interruptions | Kendall’s tau = 0.046 (P = 0.497) | Kendall’s tau = 0.051 (P = 0.445) | Kendall’s tau = 0.207 (P = 0.017)** |
p < 0.05.
In total, 23.4% of patients reported that they perceived a lack of care during their triage interviews. However, there was no significant relationship between perceived lack of care and errors F(1, 98) = 0.002, P = 0.964 or perceived provider competence, F(1, 153) = 0.026, P = 0.871. The relationship between perceived lack of care and patient satisfaction was not significant (F(1, 154) = 2.80, P = 0.158).
Discussion
Statement of principal findings
We sought to identify how triage interruptions affect patient satisfaction and the patient’s perception of care. We found significant differences in triage times between interrupted (median 7.4 min; IQR 5.3–11.9) and uninterrupted (median 5.9 min; IQR 3.0–8.0) triage interviews. Although a nearly 3 min difference in triage duration may not seem clinically significant, repeated delays can cause backlogs, prevent a system from functioning efficiently and introduce more opportunities for error. Process-improvement experts who examine assembly line efficiency frequently find that delays accumulate, exacerbating already busy production systems [18]. As such delays can increase wait times, it is to be expected that satisfaction will be adversely affected.
Interpretation within the context of the wider literature
In our study, all of the observed errors occurred when triage interviews were interrupted. Aligning with current research, we found a positive relationship between the number of interruptions and observed errors. However, patients did not recognize when an error occurred because most errors were found in documentation. Witman et al. [19] reported that 98% of patients wanted to be informed of even minor errors. By not recognizing the error, the patient cannot be part of the process of correcting it nor can they integrate that information into their perceptions of the quality of care they receive, demonstrating the insufficiency of using the patient’s grading of care quality based on service quality.
Triage is often the first interaction patients have with healthcare providers during their ED experience. As such, first impressions are important. Experiences during this triage interview set the tone and the expectation for the rest of the ED visit. This study is the first to look at the relationship of triage interruptions and patient satisfaction. Neither patient satisfaction nor patients’ perception of caregiver competence were influenced by the number of interruptions. However, it is unclear why these relationships were not found to be significant. Previous work by Berg et al. [20] found that negative perceptions of interruptions increased when it was perceived as unnecessary or disturbed the work process. Perhaps a similar phenomenon happens with patients when they perceive the interruption as necessary or unavoidable. This agrees with our results that found that 80% of our population that recognized an interruption felt that it was necessary and did not impact their satisfaction scores. More exploration is needed into this relationship.
Our study found a strong connection between perceptions of caregiver competence and patient satisfaction. This mirrors previous work that found that patient perceptions of the quality of care are influenced by providers’ technical competence [21, 22], and patients describe technical care as the foundation of competent nursing practice [23]. Similarly, a 2002 study by Goldwag et al. [24] found that the four most powerful predictors of dissatisfaction with the ED included the patient perception of physician competence and attitudes.
Relationships were observed between perceived lack of care and satisfaction (negative), but not perceived provider competence or observed errors. Satisfaction is an important outcome measure in our competitive healthcare system. In 1985, Donabedian [25] wrote that satisfaction is a multidimensional expression of the patient’s assessment of quality based on the settings and amenities of care, interpersonal care and the consequences of this care. Satisfaction encompasses many factors, so it has often been used to measure quality. However, this particular dimension of quality is perceptual. In our study, increases in patients’ perceived lack of care trended towards dissatisfaction. It is interesting that there was no relationship between perceived lack of care and caregiver competence. Many ED providers have reported that there is a disconnect between patient satisfaction measures and quality of care. This idea needs to be further explored to determine if patients believe their caregivers are competent because of their healthcare provider role/title, or perhaps patients perceive a lack of care as a choice the caregiver made.
Strengths and limitations
This study was conducted in an adult ED setting, so results should not be generalized to pediatric EDs. Additionally, ED-level crowding during this data collection period was not collected due to the relatively short duration of triage. To control for this, data collection occurred during all shifts and times of day. Future studies could account for seasonal variation of ED occupancy, to explore potential interactions. Fourth, long-term patient outcomes (e.g. death or readmission) were not measured to align with the focus on encounter-level patient satisfaction and perceptions. We surveyed patients immediately after the interaction to ensure we captured their perceptions of the triage experience and not the entire ED stay. Additionally, because convenience sampling was employed, generalizability is limited.
Finally, a potential limitation is that data observers may have been an interruption to the triage process. The observational study of interruptions in the ED always has the potential to add the possibility of introducing more interruptions into the process. While our data collectors are experienced in interruptions research, and do not engage with patients during the triage process, their presence could have been distracting to the patients or providers. To minimize this risk, data collectors observed triage from outside of the patient’s line of sight. When this could not be accomplished, the triage nurse or physician would explain that data were being collected about the triage process. Two occurrences of interruptions (2/178, 1%) were related to a patient interrupting the triage process to ask about a data collector, and these events are classified as interruptions.
Implications for policy, practice and research
Triage is the important initial assessment where acuity is assigned to a patient. Interruptions during this process can cause delays and interfere with providing safe and efficient patient care. Interruptions during this time increase the process time for triage, can cause system delays and lead to errors and patient dissatisfaction. Although patient satisfaction is an important metric, it is not sufficient by itself to measure the quality of care. It is essential that we more fully understand the implications of interruptions in all aspects of care delivery, and this study extends our knowledge in the important context of patient triage.
Conclusions
Interruptions are associated with increased errors and patient care delays. Patients’ perceptions were not influenced by interruptions. While patient satisfaction is essential, the lack of association between satisfaction and errors suggest that using it as a measure of quality may omit important quality components.
Acknowledgements
None declared.
Contributor Information
Kimberly D Johnson, College of Nursing, University of Cincinnati, (UC) 3110 Vine St Cincinnati, Cincinnati, OH 45221, USA.
Christopher J Lindsell, Department of Biostatistics, Vanderbilt University Medical Center, (vanderbilt) 2201 West End Ave, Nashville, TN 37235, USA.
Craig Froehle, Department Head—Operations, Business Analytics & Information Systems, UC Lindner College of Business, Cincinnati, OH 45221, USA; Department of Emergency Medicine, UC College of Medicine, Cincinnati, OH 45221, USA.
Gordon Lee Gillespie, Graduate Occupational Health Nursing Program, University of Cincinnati College of Nursing, Cincinnati, OH 45221-0038, USA.
Funding
This work is supported by the National Institute of Health KL2 Mentored Career Development Award through the CCTST at the University of Cincinnati [Grant number 5KL2TR001426].
Contributorship
The first author is the principle investigator of this project and was involved in the conceptualization, data collection, data management, data analysis and manuscript creation, revision and submission.
The second author is the first author’s research mentor and provided substantial contribution in the conceptualization of this work and significantly contributed to the drafting of this document. Additionally, the second author provided guidance on the statistical analysis.
The third author was involved in the conceptualization of this project and contributed to the drafting and editing of this document and provided significant intellectual content.
The fourth author was involved in the conceptualization of this project and contributed to the revision of this manuscript.
Ethics and other permissions
This project was approved through the Institutional Review Board at the University of Cincinnati. No other permissions were needed.
Data availability
Data can be made available through written request to the corresponding author.
References
- 1. Prakash B. Patient satisfaction. J Cutan Aesthet Surg 2010;3:151–5. [DOI] [PMC free article] [PubMed] [Google Scholar]
- 2. Weigl M, Müller A, Holland S et al. Work conditions, mental workload and patient care quality: a multisource study in the emergency department. BMJ Qual Saf 2016;25:499–508. [DOI] [PubMed] [Google Scholar]
- 3. Källberg A-S, Göransson KE, Florin J et al. Contributing factors to errors in Swedish emergency departments. Int Emerg Nurs 2015;23:156–61. [DOI] [PubMed] [Google Scholar]
- 4. Alkahtani M, Aziz T, Ahmad A et al. Multitasking in healthcare systems. In IIE Annual Conference. Proceedings. Nashville tennessee: Institute of Industrial and Systems Engineers (IISE). 2015, 2146. [Google Scholar]
- 5. Brixey JJ, Robinson DJ, Johnson CW et al. A concept analysis of the phenomenon interruption. ANS Adv Nurs Sci 2007;30:E26–42. [DOI] [PubMed] [Google Scholar]
- 6. Johnson M, Sanchez P, Langdon R et al. The impact of interruptions on medication errors in hospitals: an observational study of nurses. J Nurs Manag 2017;25:498–507. [DOI] [PubMed] [Google Scholar]
- 7. Chisholm CD, Dornfeld AM, Nelson DR et al. Work interrupted: a comparison of workplace interruptions in emergency departments and primary care offices. Ann Emerg Med 2001;38:146–51. [DOI] [PubMed] [Google Scholar]
- 8. Johnson KD, Motavalli M, Gray D et al. Causes and occurrences of interruptions during ED triage. J Emerg Nurs 2014;40:434–9. [DOI] [PubMed] [Google Scholar]
- 9. Froehle CM, White DL. Interruption and forgetting in knowledge-intensive service environments. Prod Oper Manag 2014;23:704–22. [Google Scholar]
- 10. Westbrook JI, Raban MZ, Walter SR et al. Task errors by emergency physicians are associated with interruptions, multitasking, fatigue and working memory capacity: a prospective, direct observation study. BMJ Qual Saf 2018;27:655–63. [DOI] [PMC free article] [PubMed] [Google Scholar]
- 11. Jeanmonod R, Boyd M, Loewenthal M et al. The nature of emergency department interruptions and their impact on patient satisfaction. Emerg Med J 2010;27:376–9. [DOI] [PubMed] [Google Scholar]
- 12. Westbrook JI, Coiera E, Dunsmuir WTM et al. The impact of interruptions on clinical task completion. BMJ Qual Saf 2010;19:284–9. [DOI] [PubMed] [Google Scholar]
- 13. Schneider A, Wehler M, Weigl M. Provider interruptions and patient perceptions of care: an observational study in the emergency department. BMJ Qual Saf 2019;28:296–304. [DOI] [PubMed] [Google Scholar]
- 14. Johnson KD, Gillespie GL, Vance K. The triage interruptions assessment tool: an instrument development. Adv Emerg Nurs J 2016;38:308–19. [DOI] [PubMed] [Google Scholar]
- 15. Mackway-Jones K, Marsden J, Windle J (eds). Emergency Triage: Manchester Triage Group. 3rd edn. 978-1-118-29906-7. West Sussex: John Wiley & Sons, Ltd, 2014. [Google Scholar]
- 16. Johnson KD, Gillespie GL, Vance K. Effects of interruptions on triage process in emergency department: a prospective, observational study. J Nurs Care Qual 2018;33:375–81. [DOI] [PMC free article] [PubMed] [Google Scholar]
- 17. Liu H, Comparing Welch’s ANOVA, a Kruskal-Wallis test and traditional ANOVA in case of heterogeneity of variance (thesis). Virginia Commonwealth University, 2015.doi: 10.25772/BWFP-YE95. [DOI] [Google Scholar]
- 18. Seth D, Seth N, Dhariwal P. Application of value stream mapping (VSM) for lean and cycle time reduction in complex production environments: a case study. Prod Plan Control 2017;28:398–419. [Google Scholar]
- 19. Witman AB, Park DM, Hardin SB. How do patients want physicians to handle mistakes? A survey of internal medicine patients in an academic setting. Arch Intern Med 1996;156:2565–9. [PubMed] [Google Scholar]
- 20. Berg LM, Källberg A-S, Göransson KE et al. Interruptions in emergency department work: an observational and interview study. BMJ Qual Saf 2013;22:656–63. [DOI] [PubMed] [Google Scholar]
- 21. Johansson P, Oléni M, Fridlund B. Patient satisfaction with nursing care in the context of health care: a literature study. Scand J Caring Sci 2002;16:337–44. [DOI] [PubMed] [Google Scholar]
- 22. Johansen ML. Conflicting priorities: emergency nurses perceived disconnect between patient satisfaction and the delivery of quality patient care. J Emerg Nurs 2014;40:13–9. [DOI] [PubMed] [Google Scholar]
- 23. Calman L. Patients’ views of nurses’ competence. Nurse Educ Today 2006;26:719–25. [DOI] [PubMed] [Google Scholar]
- 24. Goldwag R, Berg A, Yuval D et al. Predictors of patient dissatisfaction with emergency care. Isr Med Assoc J 2002;4:603–6. [PubMed] [Google Scholar]
- 25. Donabedian A. The methods and findings of quality assessment and monitoring: an illustrated analysis. J Healthcare Qual 1985;7:15. [Google Scholar]
Associated Data
This section collects any data citations, data availability statements, or supplementary materials included in this article.
Data Availability Statement
Data can be made available through written request to the corresponding author.