

Summary
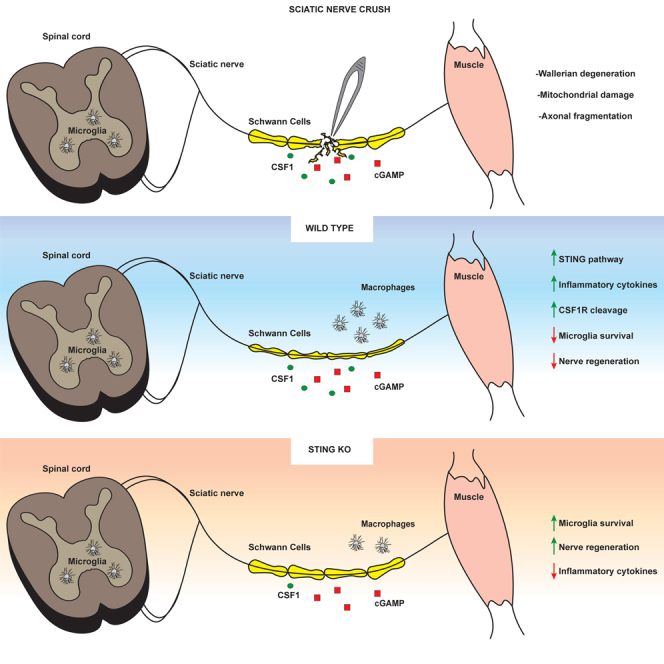
Inflammatory responses are crucial for regeneration following peripheral nerve injury (PNI). PNI triggers inflammatory responses at the site of injury. The DNA-sensing receptor cyclic GMP-AMP synthase (cGAS) and its downstream effector stimulator of interferon genes (STING) sense foreign and self-DNA and trigger type I interferon (IFN) immune responses. We demonstrate here that following PNI, the cGAS/STING pathway is upregulated in the sciatic nerve of naive rats and dysregulated in old rats. In a nerve crush mouse model where STING is knocked out, myelin content in sciatic nerve is increased resulting in accelerated functional axon recovery. STING KO mice have lower macrophage number in sciatic nerve and decreased microglia activation in spinal cord 1 week post injury. STING activation regulated processing of colony stimulating factor 1 receptor (CSF1R) and microglia survival in vitro. Taking together, these data highlight a previously unrecognized role of STING in the regulation of nerve regeneration.
Subject areas: Molecular biology, Neuroscience, Immunology, Cell biology
Graphical abstract
Highlights
-
•
The cGAS/STING pathway is upregulated in sciatic nerve post nerve injury and in aging
-
•
STING ablation increases myelin content and accelerates functional axon recovery
-
•
STING KO mice reduces macrophage number in sciatic nerve and microglia activation post injury
Molecular biology; Neuroscience; Immunology; Cell biology
Introduction
Peripheral nerve injury (PNI) occurs in ∼2.8% of trauma patients. This results in loss of motor and sensory functions and, ultimately, in decreased quality of life and severe and permanent disabilities (Wojtkiewicz et al., 2015). There are no effective therapies available, and recovery after PNI is often poor and inadequate, especially in aging (Hussain et al., 2020). The regenerative potential of the peripheral nerve system (PNS) decreases with age; repair becomes slow, incomplete, and in some cases non-functional (Poss, 2010). Soon after injury, a retrograde signal is sent to the soma of injured neurons and proximal axons prepare for growth. Distal to the site of injury, nerve axons undergo the complex series of molecular and cellular changes of Wallerian degeneration (WD). A critically associated aspect of WD is Schwann cell dedifferentiation from axon-supporting states (myelinating or Remak bundles) into a proliferative and repair phenotype that cooperates with macrophages to clear distal fiber and myelin debris and enable axon regrowth (Faroni et al., 2015). Because of immune cell infiltration, secretion of inflammatory mediators by Schwann cells, and axon degeneration, WD is considered as a form of sterile inflammation (Gaudet et al., 2011; Stoll et al., 2002). Degeneration at the distal stump is a source of damage-associated molecular patterns (DAMPs), mainly derived from axon fragmentation and myelin sheath breakdown (Karanth et al., 2006; Kato and Svensson, 2015). Axon degeneration results in mitochondrial damage and release of mitochondrial DAMPs (mt DAMPs), such as mtDNA and formylated peptides, which are recognized by pattern recognition receptors (PRRs) (Meylan et al., 2006; Takeuchi and Akira, 2010; Zhang et al., 2010b). In the neuromuscular system, PPRs are primarily expressed by macrophages and microglia, the latter being the tissue-resident macrophages of the central nervous system (CNS) (Husemann et al., 2002; Kigerl et al., 2014). MtDNA is recognized primarily by the cytosolic DNA sensor cyclic GMP-AMP synthase (cGAS). In addition to being involved in innate immunity by detecting increases in pathogen double stranded DNA, cGAS also senses changes of self-DNA in the cytosol. cGAS converts GTP and ATP into the cyclic dinucleotide 2′-3′-cGAMP that binds and activates stimulator of interferon genes (STING), a membrane protein localized in the ER(Ishikawa and Barber, 2008). STING activation leads to a type I interferon (IFN) response and recruitment of inflammatory cells (Ishikawa et al., 2009).
In this study, we employed a PNI model to study the role of STING in nerve regeneration in adult and aged mice. We demonstrate for the first time that genes controlled by the cGAS/STING pathway are upregulated in sciatic nerve following nerve injury and with advanced age. Genetic ablation of STING increases myelin content and accelerates functional axon regeneration in mice subjected to sciatic nerve crush (SNC). Genetic inhibition of STING reduces macrophage number in sciatic nerve and microglia activation in the spinal cord following nerve injury. Lastly, we show that STING activation regulates CSF1R processing and leads to microglia death in vitro. These results provide important insights into the role of STING during nerve degeneration/regeneration and may inform novel therapeutic strategies for the treatment of PNI.
Results
The cGAS/STING pathway is activated in neuromuscular tissues in aging and PNI
Cellular damage induced by mechanical trauma results in perturbation of cellular homeostasis and release of DAMPs such as mtDNA that leads to activation of innate immunity (Zhang et al., 2010a, 2010b). To investigate the molecular changes associated with PNI and their evolution with age, we subjected young (2 months) and old rats (19 months) to SNC and performed temporal transcriptomic profiling on the distal nerve stump before injury and during the recovery phase. Statistical differential expression analysis revealed a profound and sustained effect of SNC on gene expression levels (Table S1), and gene set enrichment analysis (GSEA) identified marked downregulation and upregulation of diverse biological processes following injury, predominantly linked to cell cycle and DNA replication, to immune cell activation and signaling, and to metabolic processes (Figure 1A and Table S2). Strikingly, one day post SNC, we observed a significant upregulation of genes involved in inflammation (GO:0,006,954) and innate immune response (GO:0,045,087) (Figure 1B) in young rats compared to the non-crushed contralateral nerve. In young rats, these genes showed a progressive decrease of expression over time, returning to baseline levels 21 days post injury, suggesting a resolution of the inflammation and associated immune system activities. In older rats, however, the levels of these transcripts remained elevated 21 days post SNC, indicating a lack or delay of inflammation resolution. We observed the same overall trend in gene expression, albeit in the opposite direction, for a group of genes linked to ensheathment of neurons (GO:0,007,272) (Figure 1B). Importantly, many members of this ontology pathway are core myelination genes including Egr2, Fah2, Mag, Mal, Mpz, Prx, and Pmp22, which all have been previously described to undergo massive downregulation in studies investigating transcriptional responses to SNC injury in mice (Arthur-Farraj et al., 2012; Barrette et al., 2010). Consistent with the expression dynamics of genes from these three gene ontology pathways, a closer survey of the cGAS/STING pathway showed that several members of the pathway including STING displayed first an upregulation very early at day 1 post SNC which was followed by resolution in young animals but persisted in older animals (Figure 1C). To substantiate these findings, we analyzed STING protein levels in sciatic nerve of mice subjected to SNC. As shown in Figure S1A, STING was significantly upregulated in sciatic nerve one day post SNC.
Figure 1.

Differentially expressed pathways in young and old rats following sciatic nerve crush
Gene expression in the distal nerve stump was assessed at day 1, 7, 14, and 21 after subjecting young and old adult rats (2 and 19 months, respectively) to sciatic nerve crush injury. Gene expression levels in the uninjured, contralateral nerve at day 7 were used as control.
(A) Volcano plots depicting significantly enriched gene ontology pathways at day 1 and 7 in distal vs. contralateral nerve, as determined by GSEA. Highlighted are three gene sets linked to inflammation (GO:0006954), innate immune response (GO:0045087), and ensheathment of neurons (GO:0007272). Statistical significance was defined as BH-adjusted pvalue below or equal to 0.05 (dotted horizontal line). Dot size reflects gene set size.
(B and C) Longitudinal gene expression changes for genes in the three highlighted ontology gene sets, and the cGAS/STING pathway reveals a resolution of injury-induced effect by day 21 in young animals, contrasting the sustained injury effect and differential gene expression in old rats. Gene expression values (log2 transformed rpkm) were normalized to mean expression level in the contralateral nerve. Heatmap rows and columns are representing distinct genes and individual animals at different time points post SNC, respectively.
We further explored the impact of aging on this pathway by measuring its expression level in neuromuscular tissues in young and aged animals. Building on a compendium of previously published transcriptomic studies (Barrette et al., 2010; Giorgetti et al., 2019b; Ibebunjo et al., 2013), we derived the expression profile of the pathway in gastrocnemius muscle, sciatic nerve, spinal cord, and microglia of young and old mice and rats. In all three tissues, the expression of several downstream proinflammatory genes and STING (Tmem173) itself, was increased in old than that in young animals (Figures S1B–S1E). Taken together, these data show that PNI is associated with changes of cGAS/STING regulated genes in the sciatic nerve of animals subjected to SNC and that these genes are differentially expressed with age in neuromuscular tissues suggesting that the cGAS/STING pathway might contribute to the regeneration/repair process after nerve injury and its dysregulation in aging.
STING KO mice show faster functional recovery after injury
To investigate the role of STING in injury recovery, we performed a longitudinal nerve injury study in STING KO animals. We subjected young and old wild-type C57BL/6 (WT) and C57BL/6J-Tmem173gt/J mice (STING KO) to SNC and measured functional readouts including the compound muscle action potential (CMAP) and toe spread (TS) over time (Figure 2A). We confirmed STING protein ablation by immunoblotting analysis of protein extracts of the gastrocnemius muscle. STING protein levels were upregulated in the gastrocnemius muscle of the leg subjected to SNC compared with the contralateral leg in WT mice (Figure 2B). STING protein was not detected in the gastrocnemius of STING KO mice (Figure 2B). We did not find significant difference in baseline CMAP values in STING KO versus WT or in young versus old animals (Figures 2C and 2D). As previously described (Giorgetti et al., 2019a), SNC induced a drastic reduction in CMAP values in both STING KO and WT mice one week post injury regardless of age as a consequence of loss of muscle innervation caused by the injury. CMAP recovery after injury is delayed in aged mice (Giorgetti et al., 2019a). Strikingly, STING KO mice recovered faster than WT animals and had CMAP values significantly increased at day 21 post injury. This effect was remarkably more pronounced in old than in young mice (Figures 2C and 2D). We also performed TS analysis to assess motor function after SNC. TS dramatically decreased in the first week after crush (score 0), recovered faster in old STING KO mice than WT mice starting from day 18 post SNC with 33% of the STING KO mice reaching the highest score (score 2) compared with 16.6% of WT animals. At day 28 post SNC, 100% of the old STING KO mice had reached score 2 compared with 83% of WT mice (Figure 2D). TS recovery followed a different pattern in younger animals. At day 7 post SNC, all WT mice scored 0 versus 75% of STING KO and 100% of STING KO reached full recovery at day 35 compared with 75% of WT mice (Figure 2C). Taken together, these data show that the rate of recovery of CMAP and TS after injury is increased in STING KO mice and that it is more pronounced in aged mice.
Figure 2.

Absence of STING accelerates nerve recovery in mice subjected to sciatic SNC
Young and old C57BL/6J-Tmem173gt/J (STING KO) and C57BL/6J (WT) mice were subjected to SNC.
(A) Schematic representation of in-vivo studies' design. We performed toe spread analysis and CMAP measurement at the indicated time points after SNC. Mice were sacrificed at day 7, 35, and 56 post SNC. Sciatic nerves and gastrocnemius muscles were excised for RNA and protein extraction.
(B) Ablation of STING was confirmed by immunoblotting in gastrocnemius muscle 1 week post SNC. GAPDH was used as loading control. The graph shows the quantification of immunoreactive bands by densitometry. (∗p < 0.05, ∗∗p < 0.001, two-way ANOVA).
(C and D) Toe spread and CMAP analysis was performed as indicated in A in young (C) and old animals (D). Blue and red values around the boxes indicate percentage of mice at each score. Toe spread scores were 0 - no spreading, 1 - intermediate spreading, 2 - full toe spreading. ∗∗p < 0.01, ∗∗∗p < 0.001, ∗∗∗∗p < 0.0001 versus contralateral leg that had a score of 2 at all-time points (Mann-Whitney test). CMAP data are mean amplitude ± SEM; the dotted line corresponds to baseline measurements performed one week before SNC. Six mice/group for 16-month-old mice (C),and eight mice/group for 14-week-old mice (D). ∗p < 0.05, ∗∗∗p < 0.001 (two-way ANOVA).
Histological analysis of sciatic nerve shows that myelin degeneration recovers faster in STING KO mice
To understand the mechanisms underlying the faster functional recovery in STING KO mice, we performed histological analysis of sciatic nerves. The nerve was sub-divided in three regions (Figure 3A) named R1 (distal, at and after the branching point into tibial and peroneal nerves), R2/R3 (middle region), and R4 (proximal region to the lumbar vertebrae L4). The nerve crush site was defined as the R2/R3 boundary. Axons were labeled using an antibody to the neurofilament 200 protein (NF200), whereas myelin was visualized using an antibody to myelin basic protein (MBP), a marker of myelinating Schwann cells. We detected no differences in myelin content, axon number, and size in intact nerves of the contralateral leg of WT and STING KO mice (Figures 3B–3D). As expected, one week after crush injury in WT mice, we observed a dramatic loss of both myelin rings and neurofilament-stained axons, as well as accumulation of myelin debris. In contrast, nerves from STING KO mice showed maintenance of several myelin rings and a more intense myelin immunostaining (Figure 3B). Quantification of this finding showed significantly more intact myelin sheaths and increased myelin content in STING KO nerves than in WT mice (Figure 3C). In contrast, we detected a significant but comparable decrease in axon number, area, and axon area distribution in injured nerves of WT and STING KO mice one week after SNC (Figures 3B, 3D, and S2). At four weeks after crush, myelin and axons had recovered and resembled those present in intact nerves of both WT and STING KO mice.
Figure 3.

Ablation of STING increases the expression of the myelin marker MBP
C57BL/6J-Tmem173gt/J (STING KO) and C57BL/6J (WT) mice were subjected to SNC.
(A) Schematic representation of sciatic nerve, with segments proximal (R4) and distal (R1) to the crush site and respective sectioning points. The crush site is indicated in yellow in the mid segment (R2/R3).
(B) Representative images of WT and STING KO sciatic nerve cross sections stained with anti-NF200 (axons, in green) and anti-MBP (myelin, in red) antibodies in region R2/R3 of the sciatic nerve at 1 or 4 weeks post SNC. The R2/R3 region of the contralateral non-crushed sciatic nerve is included for comparison. Fluorescent microscope images were taken at 20× magnification and scale bars are 50 μm.
(C) Quantification of myelin fluorescent signal intensity. Only myelin associated with an axon was evaluated. Data represent myelin intensity (% of WT) ± SEM. # p<0.05 versus KO, Brown-Forsythe, and Welch ANOVA. (D) Quantification of axon number and area. Five mice/group and genotype. Mice were 6 months old at the beginning of the experiment. Data represent the mean ± SEM. ∗∗p<0.01, ∗∗∗p<0.001, ∗∗∗∗p<0.0001, one-way ANOVA.
Macrophages play a central role during regeneration after traumatic nerve injury (Kiefer et al., 2001). Upon injury, macrophages readily invade injured nerves and contribute to myelin and axonal debris clearance and regeneration (Cattin et al., 2015; Wang et al., 2020). To analyze macrophage number at the site of nerve injury, we visualized macrophages by immunostaining using an antibody to ionized calcium-binding adapter molecule 1 (Iba1), a marker of macrophages and microglia. As expected, a low number of resident macrophages were detected in intact nerves of WT and STING KO mice (Figures 4A and 4B). We confirmed that injury induces a significant increase in the number of macrophages in the nerve one week after SNC. Interestingly, we detected a lower number of macrophages in STING KO than in WT mice (Figures 4A and 4B). Upon nerve damage, Schwann cells and resident macrophages are known to rapidly induce signaling molecules that are responsible for macrophage recruitment from the circulation and their expansion and activation (Chen et al., 2015; Martini et al., 2008). One of such molecules is CSF1 which binds the CSF1R and triggers a signaling cascade that induces proliferation and activation of macrophages and microglia via the CSF1R (Damani et al., 2011; Guan et al., 2016; Hefendehl et al., 2014). We therefore analyzed the expression of Csf1 transcript in sciatic nerve of WT and STING KO mice after SNC by quantitative RT-PCR (qRT-PCR). We found a significant downregulation of Csf1 in the sciatic nerve of STING KO than in WT mice (Figure 4C). Taken together, these data suggest that STING regulates the expression of Csf1 at the transcriptional level as well as the number of macrophages in the damaged nerve one week after injury.
Figure 4.

STING KO decreases macrophage number in sciatic nerve and microglia activation in spinal cord following nerve crush
C57BL/6J-Tmem173gt/J (STING KO) and C57BL/6J (WT) mice were subjected to SNC.
(A and D) Representative images of Iba1 immunostaining of WT and STING KO sciatic nerve (A) and spinal cord (D) at 1 or 4 weeks post SNC. Scale bars are 200 μm in A and 20 μm in D; n = five mice/group and genotype.
(B and E) Mice were 6 months old at the beginning of the experiment. Quantitative analysis of Iba1+ cells at the R2/R3 region in sciatic nerve (B) and spinal cord (lumbar region L5-L6) (E).
(F) The microglia activation index is the ratio of the distal area and the soma plus the proximal area. Five mice/group. Data represent the mean ± SEM.
(C) mRNA abundance of Csf1 was analyzed by qRT-PCR in sciatic nerve from 16-month-old mice subjected to SNC. Data represent mean fold increase of WT animals ±SEM, n = 6. ∗p<0.05, ∗∗p<0.01, ∗∗∗p<0.001, ∗∗∗∗p < 0.0001; (C) t test and (B, E, and F) two-way ANOVA. ∗No crush versus crush: #WT versus STING KO.
STING ablation attenuates microglia activation in the dorsal horn of the spinal cord
Microglia are the tissue resident macrophages of the brain and spinal cord. Microglia survey their microenvironment and display dynamic behavior in response to different stimuli, including nerve injury, which leads to changes in their morphology, number, gene expression, and activation (Davis et al., 1994; Lawson et al., 1990; Lehrmann et al., 1997). Chronic activation of microglia has detrimental effects and results in prolonged release of proinflammatory mediators and toxins which are thought to cause neuropathic pain and neurodegeneration (Inoue and Tsuda, 2018). Upon nerve damage, dorsal root ganglia sensory neurons (DRGs) rapidly induce signaling molecules that are responsible for microglia proliferation and activation. To investigate whether STING ablation affected microglia number and activation after SNC, we visualized microglia in the spinal cord with an antibody to Iba1. We did not find significant differences in microglia number between WT and STING KO mice prior to injury (Figures S3A and S3B) and one and four weeks after SNC (Figures 4D and 4E). However, STING KO mice showed altered microglia morphology one week post injury, which was reminiscent of the resting phenotype (Figure 4D). Quantification of the activation index (distal area divided by the sum of soma and proximal area) confirmed that a larger number of microglia cells in WT mice were activated comparedwith STING KO mice (Figure 4F). We did not find significant difference in the microglia activation index between WT and STING KO mice four weeks post SNC (Figure 4F) or prior to injury (Figures S3A–S3C). Our data suggest that STING contributes to chronic microglia activation in response to SNC.
cGAMP induces markers of microglia activation in anSTING-dependent manner in BV2 cells
Recently, Yu et al. reported the presence of mtDNA in the cytoplasm of ALS patient iPSC-derived motor neurons as well as the presence of cGAMP in spinal cord and serum samples of an ALS mouse model (Yu et al., 2020). Therefore, it is plausible that cGAMP is generated by damaged sensory neurons in injured sciatic nerves and transported to the spinal cord where it could stimulate the STING pathway and induce microglia activation. Furthermore, damaged motorneurons could also be a source of cGAMP in the spinal cord. To investigate further the role of STING in microglia cells (BV2), we generated BV2 Tmem173 CRISPR Cas9 KO cells (BV2 STING KO). Ablation of STING protein expression in these cells was confirmed by immunoblotting (Figure S4A). As expected, cGAMP treatment of BV2 CTRL cells for 6 and 24 h induced STING degradation and an increase in TBK1 and NF-κB phosphorylation at both time points (Figures S4A and S4B) (Tanaka and Chen, 2012). Conversely, we could not detect any increase in the phosphorylation of either TBK1 or NF-κB in BV2 STING KO cells confirming previous observations that STING is required for the activation of these molecules in response to cGAMP (Fang et al., 2017). To examine the effects of cGAMP on microglia activation, we treated BV2 CTRL and BV2 STING KO cells for 6 and 24 h and analyzed the mRNA expression of marker of microglia activation by qPCR. cGAMP treatment induced a significant upregulation of the proinflammatory cytokines Cxcl10, Il1β, Tnfα, and Il6 in BV2 CTRL cells. However, the expression and upregulation of these proinflammatory genes were impaired in BV2 STING KO cells at both analyzed time points (Figures 5A and 5B). Importantly, we confirmed the upregulation of proinflammatory cytokines (CXCL10, IL1β, TNFα, and IL6) in human-induced pluripotent stem cells (iPSC)-derived microglia treated with 50 μM of cGAMP for 6 and 24h (Figure S5). Similarly, Tnfα, Il1α, and Nos, markers of microglia activation (Lively and Schlichter, 2018; Madeddu et al., 2015), were upregulated by cGAMP in iPSC-derived microglia (Figure S5) and BV2 CTRL but not in BV2 STING KO cells (Figure 5B). In contrast, the expression of the anti-inflammatory gene Arg1 (Munder, 2009) was decreased by cGAMP treatment in BV2 CTRL cells but not in STING KO cells (Figure 5B). Arg1 and Nos were not expressed in iPSC-derived microglia and therefore we could not analyze the effect of cGAMP on these genes. Taken together, these data indicate that STING is required for the transcriptional regulation of markers of microglia activation and inflammatory cytokines in response to cGAMP. When treating BV2 cells with cGAMP, we noticed that control cells (BV2 CTRL) were more susceptible to cell death. To investigate the impact of cGAMP on microglia survival, we treated BV2 cells with different concentrations of cGAMP for 24 h and evaluated cell number by DAPI staining (Figure 5C). cGAMP induced a significant decrease in the number of BV2 CTRL cells compared to vehicle control but had no effect on BV2 STING KO cells (Figure 5D). Low concentrations (5 and 12 μM) of cGAMP were sufficient to decrease the number of BV2 CTRL cells by 60% with stronger effects at higher concentrations. To understand the mechanism conducive to a decrease in cell number, we investigated whether cGAMP induced apoptosis by monitoring cleaved Caspase 3 expression. BV2 CTRL cells underwent apoptosis shortly after treatment with cGAMP as evaluated by Caspase 3 staining (Figures 5C and 5D). However, BV2 STING KO cells were resistant and we could not detect any significant difference in Caspase 3 staining compared to vehicle control (Figures 5C and 5D).
Figure 5.

cGAMP-induced apoptosis and activation of BV2 microglial cells is STING dependent
(A and B) BV2 STING KO and control (CTRL) cells were treated with the indicated concentrations of cGAMP or DMSO for 6 and 24 h. Analysis of inflammatory cytokines (A) or markers of microglia activation (B) was performed by qRT-PCR.
(C) Representative immunofluorescence images are shown.
(D) Cell number and cell death were evaluated by DAPI and cleaved caspase-3 staining (D), respectively. Scale bars are 400 μm. The experiment was repeated 3 times, and the data are expressed as means ± SEM (∗p < 0.05, ∗∗p<0.01, ∗∗∗p < 0.001, ∗∗∗∗p<0.0001; two-way ANOVA).
(A and B) Data represent means ± SEM. ∗p < 0.05, ∗∗p<0.01, ∗∗∗p < 0.001, ∗∗∗∗p<0.0001 versus. ∗ DMSO versus cGAMP treatment. # BV2 CRISPR CTRL versus CRISPR BV2 STING KO.
Microglia are dependent on CSF1R signaling for their survival and proliferation. CSF1R is a transmembrane glycoprotein consisting of a ligand-binding extracellular domain, a short transmembrane segment and the intracellular kinase domain. CSF1R undergoes regulated intramembrane proteolysis (Brown et al., 2000) which results in downregulation and shedding of the ectodomain (Wilhelmsen and van der Geer, 2004). Because of the effect of cGAMP on microglia survival, we monitored the protein levels of CSF1R by immunoblotting after cGAMP treatment of naive BV2 cells and iPSC-derived microglia cells. We found that cGAMP treatment for 24 h decreased significantly the protein levels of the receptor (Figures 6A and 6B). cGAMP effect on CSF1R processing was confirmed in BV2 CTRL cells treated for 6 and 24 h (Figure 6C). In contrast, genetic inhibition of STING prevented CSF1R proteolytic processing (Figure 6C). Taken together, the data suggest that by regulating CSF1R processing STING could potentially inhibit the pro-survival effect of CSF1R on microglia.
Figure 6.

cGAMP downregulates CSF1R expression in microglial cells via STING
(A and B) BV2 cells (A) and iPSC-derived microglia (B) were treated with 50 μM cGAMP or DMSO for 24 h. CSF1R protein expression was analyzed by immunoblotting. The graph shows the quantification of the different immune-reactive bands of CSF1R by densitometry. GAPDH and tubulin were used as loading controls. The experiment was repeated 3 times. Data are mean band intensity ±SEM. ∗p<0.05, ∗∗p < 0.01, ∗∗∗p < 0.001, ∗∗∗∗p < 0.0001 (two-way ANOVA).
(C) STING ablation prevents CSF1R proteolysis induced by cGAMP treatment. BV2 STING KO and control (CTRL) cells were treated with 50 μM cGAMP for the indicated time. The graph shows the quantification of the different immunoreactive bands of CSF1R by densitometry. GAPDH was used as a loading control. Data are mean band intensity ±SEM. ∗p<0.05, ∗∗p < 0.01, ∗∗∗p < 0.001, ∗∗∗∗p < 0.0001, (two-way ANOVA).
Discussion
Cellular damage induced by trauma results in perturbation of cellular homeostasis and release of DAMPs such as mtDNA that leads to activation of innate immune responses. Inflammation in response to nucleic acids is triggered by DNA sensors such as cGAS. However, the role of the cGAS/STING pathway in PNI has not been described. Here, we report that aging and PNI upregulate the expression and activation of the cGAS/STING pathway in sciatic nerve and spinal cord of naive animals and of rats subjected to PNI. We show for the first time that STING deficiency in mice boosts myelin content and promotes a faster functional recovery after SNC. The increase in myelin content in STING KO mice precedes the functional recovery and coincides with decreased expression of proinflammatory cytokines in sciatic nerve compared with WT mice. Soon after injury, Schwann cells acquire a dedifferentiated phenotype and initiate myelin degradation and axon debris removal at the distal stump of the damaged nerve. This process is initially performed in concert with resident macrophages and later supported by infiltrating macrophages (Liu et al., 2019; Mueller et al., 2003). Thus, macrophages are key for the degeneration/regeneration program. M1 macrophages are essential for WD since ablation of several M1-inducing factors delays WD and consequently the regeneration process (Zigmond and Echevarria, 2019). On the other hand, there is evidence that M2 macrophages are involved in nerve regeneration (Zigmond and Echevarria, 2019). We found a decreased number of macrophages in the sciatic nerve of STING KO mice one week post injury. Therefore, it is possible that impaired recruitment and activation of macrophages in STING KO mice leads to inefficient myelin degradation and/or delayed removal of damaged axons at the site of injury resulting in the higher CMAP values observed three-week post injury. However, this is unlikely since we did not find differences in the number of axons or axon area between WT and KO mice at all the examined time points. Alternatively, STING ablation, might prevent a strong and persistent hyperinflammatory state that is known to interfere with the repair process especially in old mice (Buttner et al., 2018). Indeed, it is well known that activation of the cGAS/STING pathway results in the secretion of highly inflammatory cytokines like IFNα/β, IL6, TNFα, and others (Buttner et al., 2018). Furthermore, we found a significant decrease in the expression of Csf1 in sciatic nerve of STING KO mice one week after injury. In peripheral nerve, endoneurial fibroblasts and Schwann cells secrete CSF1 (Groh et al., 2012), a key factor for macrophage proliferation, differentiation, and survival (Zigmond and Echevarria, 2019). Interestingly, Lee at al. found that PLX5622, an inhibitor of CSF1R, caused a decrease in M1 macrophages when administered before partial sciatic nerve ligation (Lee et al., 2018). Therefore, STING could potentially regulate the M1/M2 macrophage population via CSF1, and boost remyelination and nerve functional recovery.
In this study, we found that microglia activation was attenuated in the spinal cord of STING KO mice. Following PNI, microglia cells are activated, proliferated, and accumulated in areas of damaged neurons and produce a variety of chemokines that are thought to exacerbate neurodegeneration and contribute to neuropathic pain (Inoue and Tsuda, 2018). Several factors, including CSF1, have been implicated in microglia activation and neuropathic pain following nerve injury (Inoue and Tsuda, 2018). Guan et al. have shown that CSF1 is transported along the injured sensory axons to the spinal cord (Guan et al., 2016); a similar transport mechanism in response to PNI could apply to cGAMP and explain the reduced microglia activation found in spinal cord of STING KO mice.
In vitro treatment of mouse microglia and human iPSC-derived microglia with cGAMP resulted in fast (6 h post treatment) elevation of markers of microglia activation. However, this was associated with a dramatic decrease in mouse microglia cell number and viability that required STING. Emerging evidence indicate that ER stress associated with STING activation induces apoptosis via the proapoptotic molecules BAK/BAX and release of cytochrome c (Murthy et al., 2020). It remains to be determined whether a similar mechanism is responsible for the cell death induced by cGAMP in our study. Microglia cells are dependent on the CSF1R for their proliferation and survival (Inoue and Tsuda, 2018). In this study, we describe for the first time that cGAMP induces CSF1R proteolytic processing in microglia. A PKC-dependent CSF1R ectodomain shedding has been reported in response to macrophage activators including IFN γ, LPS, IL-2, and IL-4 (Baccarini et al., 1992; Damoiseaux et al., 1989; Retini et al., 1996). The physiological relevance of such shedding is not clear. A soluble CSF1R containing the ligand binding domain could function as a decoy thus decreasing functional effects of CSF1 (Damoiseaux et al., 1989). On the other end, it could affect the microglia “phenotype” as described for macrophage maturation (Palucka et al., 1998) or their survival. Therefore, lack of STING could protect resident cells like microglia from becoming strongly activated by DAMPS released from damaged cells at the site of injury and in spinal cord. The combination of less inflammation at the site of injury mediated by recruited cells and the better survival of the resident cells, might allow faster recovery from the nerve injury observed in the STING KO animals. Future investigations on these hypotheses are required and could stem from the findings described in this study.
The current study not only unravels a previously unrecognized role for STING in nerve regeneration and microglia activation but also suggests potential therapeutic strategies for the treatment of PNI.
Limitation of the study
In the study presented here, we provide comprehensive evidence for the upregulation of the cGAS/STING pathway after sciatic nerve crush and that STING KO mice show faster recovery after injury. A limitation of the work is that it was not possible to directly measure cytosolic DNA or cGAMP in sciatic nerve of mice subjected to SNC or sham-operated animals. Detection of cytosolic DNA in small tissue samples and measurements of cGAMP in a complex biological matrix is still a significant challenge in the field. For future research, it will be important to develop assays for cGAMP measurement that combine high sensitivity and low susceptibility to the so called matrix effect. Another limitation of this study is that the downstream mechanisms underlying how STING signaling regulates preservation of myelin and microglia activation remain to be further elucidated.
STAR★Methods
Key resources table
| REAGENT or RESOURCE | SOURCE | IDENTIFIER |
|---|---|---|
| Antibodies | ||
| GAPDH (6C5), Mouse, mAbs | Ambion | Cat# AM4300, RRID:AB_437392 |
| M-CSF Receptor, Rabbit, pAbs | Cell Signaling Technology | Cat# 3152, RRID:AB_2085233 |
| NF-κB p65 (D14E12) XP®, Rabbit mAbs | Cell Signaling Technology | Cat# 8242, RRID:AB_10859369 |
| NF-κB p65 (Phospho Ser536) (93H1), Rabbit, mAbs | Cell Signaling Technology | Cat# 3033, RRID:AB_331284 |
| TBK1/NAK (Phospho Ser172) (D52C2) XP® Rabbit, mAbs | Cell Signaling Technology | Cat# 5483, RRID:AB_10693472 |
| STING (D1V5L), Rabbit, mAbs | Cell Signaling Technology | Cat# 50494, RRID:AB_2799375 |
| Tubulin-α (DM1A), Mouse, mAb | Sigma-Aldrich | Cat# T6199, RRID:AB_477583 |
| Chemicals, peptides, and recombinant proteins | ||
| cGAMP | Novartis Pharma AG | NVP-LXV902-AV26 |
| Deposited data | ||
| Transcriptomic analysis: rat sciatic nerve crush study | This paper | PRJNA690705 |
| Comparison between adult and aged mice spinal cord and microglia | (Giorgetti et al., 2019a, 2019b) | GEO: GSE122116 |
| Genomic profiling of rat sarcopenic muscle | (Ibebunjo et al., 2013) | GEO:GSE118825 |
| Transcriptomic analysis: mice sciatic nerve crush study | (Barrette et al., 2010) | GSE22291 |
| Experimental models: Cell lines | ||
| BV2: mouse microglia cells | KCB | KCB 200770YJ, RRID:CVCL_0182 |
| iPSCs | This paper | NA |
| iMACS | This paper | NA |
| Experimental models: Organisms/strains | ||
| C57BL/6J Mus musculus | The Jackson Laboratories | IMSR Cat# JAX:000664, RRID:IMSR_JAX:000664 |
| C57BL/6J-STING1gt/J Mus musculus | The Jackson Laboratories | IMSR Cat# JAX:017537, RRID:IMSR_JAX:017537 |
| Hsd:Sprague Dawley® SD® Rattus norvegicus | Envigo | NA |
| Oligonucleotides | ||
| Arg1 -Taqman Gene Expression Assay | Thermo Fisher Scientific | Mm00475988_m1 |
| Csf1 -Taqman Gene Expression Assay | Thermo Fisher Scientific | Mm00432688_m1 |
| Cxcl10 -Taqman Gene Expression Assay | Thermo Fisher Scientific | Mm00445235_m1 |
| CXCL10 | Thermo Fisher Scientific | Hs99999049_m1 |
| Gapdh-Taqman Gene Expression Assay | Thermo Fisher Scientific | Mm99999915_g1 |
| GAPDH- | Thermo Fisher Scientific | Hs99999905_m1 |
| Hprt-Taqman Gene Expression Assay | Thermo Fisher Scientific | Mm03024075_m1 |
| Il1α -Taqman Gene Expression Assay | Thermo Fisher Scientific | Mm00439620_m1 |
| IL1α | Thermo Fisher Scientific | Hs00174092_m1 |
| Il1β -Taqman Gene Expression Assay | Thermo Fisher Scientific | Mm00434228_m1 |
| IL1 β | Thermo Fisher Scientific | Hs01555410_m1 |
| Il6 -Taqman Gene Expression Assay | Thermo Fisher Scientific | Mm00446190_m1 |
| IL6 | Thermo Fisher Scientific | Hs00174131_m1 |
| Nos2 -Taqman Gene Expression Assay | Thermo Fisher Scientific | Mm00440502_m1 |
| Rplp0-Taqman Gene Expression Assay | Thermo Fisher Scientific | Mm00725448_s1 |
| RPLP0 | Thermo Fisher Scientific | Hs99999902_m1 |
| Tnfα -Taqman Gene Expression Assay | Thermo Fisher Scientific | Mm00443258_m1 |
| TNF α | Thermo Fisher Scientific | Hs00174128_m1 |
| Mm.Cas9.TMEM173.1.AD – Guide RNA | IDT technologies | This paper |
| Mm.Cas9.TMEM173.1.AG – Guide RNA | IDT technologies | This paper |
| Tracer RNA | IDT technologies | IDT#1072534 |
| mTMEM173_Fwd - PCR primer | IDT technologies | This paper |
| mTMEM173_Rev - PCR primer | IDT technologies | This paper |
| mTMEM173_Fwd_long - PCR primer | IDT technologies | This paper |
| mTMEM173_Rev_long - PCR primer | IDT technologies | This paper |
| Software and algorithms | ||
| Fiji | Open source | RRID:SCR_002285 |
| GraphPad Prism 8 | GraphPad Software | RRID:SCR_002798 |
| FastQC | FastQC | RRID:SCR_014583 |
| R | R Project for Statistical Computing | RRID:SCR_001905 |
| EnsDb.Rnorvegicus.v79 2.99.0 R package | (Rainer, 2017) | http://bioconductor.org/packages/release/data/annotation/html/EnsDb.Rnorvegicus.v79.html |
| Genefilter 1.72.0 R package | (Gentleman et al., 2020) | https://bioconductor.org/packages/release/bioc/html/genefilter.html |
| Limma 3.40.6 R package | (Ritchie et al., 2015) | https://bioconductor.org/packages/release/bioc/html/limma.html |
| HALO | HALO, Indica Labs | RRID:SCR_018350 |
| HCS Studio Cell Analysis software | Thermo Fisher Scientific | HCS Studio Cell Analysis software, RRID:SCR_016787 |
| TIBCO Spotfire Analyst | TIBCO Software Inc. Spotfire | Spotfire, RRID:SCR_008858 |
| Microsoft Office 2016 | Microsoft | N/A |
Resource availability
Lead contact
Requests and information for recourses should be directed to the lead contact, Mara Fornaro (mara.fornaro@novartis.com).
Materials availability
This study did not generate new unique reagents.
Experimental model and subject details
Animals
Animal handling, care, and experimental use were in line with the Swiss federal laws for animal protection. The studies described in this report were approved by the Cantonal Veterinary Authorities of Basel, Switzerland (licenses BS-2557 and BS-2804).
We used mice at different age: 12-14 week (young), 6 month (adult) or 16 month (old) old. Male C57BL/6J-Tmem173gt/J mice (STING KO) and male C57BL/6J (WT) were purchased from Jackson Laboratory. Animals were allowed to adapt for seven days prior to the start of an experiment. They were housed in standard conditions (temperature 20–24°C, humidity minimum 40%, light/dark cycle 12 h) in IVC (Individually Ventilated) racks (max. 4 animals/cage) with access to standard food (Kliba Nr. 3893.025; Kliba-Provimi, Kaiseraugst, Switzerland) and water ad libitum. Male Hsd:Sprague Dawley® SD® rats (Envigo) rats used were at different age: 2 or 19 month old. Animals were housed in Type 2000 cages racks with a light/dark cycle of 12 h and free access to diet (Kliba Nr. 3893.025; Kliba-Provimi, Kaiseraugst, Switzerland) and water ad libitum.
Cells
Mouse microglial cells
BV2 cells were grown in RPMI (Gibco #31870) supplemented with 10% FBS (Sigma #F2442), 1% glutamine and 1% Penicillin-Streptomycin (Sigma #P0781) and maintained at 37°C and 5% CO2. Cells were detached by Accutase and treated with cGAMP 24 hours after seeding to induce the cGAS-STING pathway.
Human induced pluripotent stem cells (hiPSC) generation and maintenance
The iPSC line WT29 was derived from cell line AG09429 obtained by the NIA Aging Cell Repository at the Coriell Institute for Medical Research by using the CytoTune-iPS Reprogramming Kit (Invitrogen). Cells had a normal karyotype and pluripotency was confirmed by the expression of standard markers. iPS cells were cultured on laminin 521 (Biolamina LN521) coated dishes in mTeSR plus (Stem Cell Technologies #05825) supplemented with 1% penicillin/streptomycin (Gibco). Cells were dissociated with TrypLE (Gibco) every 3-4 days and plated at the density 20000/cm2 in the presence of 10 μM ROCK inhibitor. The medium was replaced every other day.
Human induced pluripotent stem cell (hiPSC)-derived microglia
Human iPSC-derived macrophages (iMACs) were generated as described in (Buchrieser et al.,2017). Briefly, embryo bodies (EBs) are generated from approx. 5000-7000 iPSCs per well in ultra-low adherent 96 well plates and maintained in mTesR medium (STEMCELL Technologies, 85870) supplemented with 50 ng/ml hBMP4 (Peprotech, 120-05ET-100), 20 ng/ml SCF (Peprotech, 300-07-10) and 50 ng/ml VEGF (Peprotech,100-20-100) and 10 μM Y-27632 was added per well. After 4 days, EBs are transferred to 10 cm dish coated with 0.1% gelatin (EB size: 500-700μM) in DMEM (Thermo Fischer Scientific, 41966029) containing 10% FBS (Gibco, 10270-106), GlutaMAX supplement (Thermo Fischer Scientific, 35050-038, diluted 1/100), 0.055 mM β-mercaptoethanol (Gibco, 21985-023), 1% penicillin/streptomycin, 1x MEM Non-Essential Amino Acids Solution (Gibco, 11140-035), supplemented with 25 ng/ml IL-3 (Peprotech, 200-03-100) and 100 ng/ml m-CSF (Peprotech, 300-25-100). After 3 days, medium was replaced by X-VIVO-15 (Lonza, BE02-053Q), supplemented with GlutaMAX, 0.055 mM β-mercaptoethanol, 1% penicillin/streptomycin, 100 ng/mL m-CSF and 25 ng/mL IL-3. After 15-20 days iMACS grown in suspension can be collected weekly for further differentiation up to three month. For microglia differentiation, 3-5 x 10⁶ iMACS were plated onto a 6 cm dish and were cultivated for three weeks in Neurobasal medium (Gibco #21103049) containing B27 supplement (Gibco #17504-044), N2 supplement (Gibco #17502-048), 1% penicillin/streptomycin (Gibco #15070-063), 10 ng/ml m-CSF, 100 ng/ml IL-34 (Peprotech #200-34), 50 ng/ml TGFβ (Peprotech #100-21), 10 ng/ml BDNF (Peprotech #450-02), 10 ng/ml GDNF (Peprotech #450-10) and 10 ng/ml NT3 (Peprotech #450-03). Medium was replaced every second day.
Method details
Sciatic nerve crush surgery in mice and rats
Animals were anesthetized using 4% isoflurane (Abbott, Cham, Switzerland) and then maintained by continuous inhalation of 1.5–2% isoflurane on a heated surface (approximately 15 min). The skin was incised posterior and parallel to the left femur, left sciatic nerve was exposed at mid-thigh and then crushed for 15 seconds (proximal to its branching) using a Dumont 5 forceps (Bridge et al., 1994). Site of crush was marked by using powered charcoal. After the crush, the nerve was repositioned and dissolvable suture (0.7 gauge) was used to close the muscle and the skin incision was closed with wound closure clips. Animals were allowed to recover from the anesthesia before placing them back in their cages.
Carprofen (Rimadyl, Pfizer, Zurich, Switzerland, 5 mg/kg) or Metacam (Boehringer Ingelheim Vetmedica GmbH, Ingelheim/Rhein Germany) were administered subcutaneously for peri- (0.5 to 1 hour before surgery) and post-operative pain control (1 to 3 days after surgery depending on the status of the animal).
CMAP assessment
Electrophysiological measurements were performed following the procedure described by Arnold et al. (Arnold et al., 2015) on isoflurane-anesthetized animals using a recording unit of ADInstruments (Oxford, UK). Briefly, the sciatic nerve was stimulated with monopolar needle electrodes placed intramuscularly in the left gluteal region. A recording (active) monopolar electrode was placed in the ventral region of the left leg gastrocnemius. A non-active, monopolar electrode was placed in the heel of the left hind limb. Initially, a single pulse of 0.5 ms was applied to the nerve and current (in mA) was increased regularly to achieve maximum CMAP (I-max).
TS assessment
The toe spread (TS) reflex was scored by holding mice from the tail for the observation of the toe spread in the hind paws. The toe spread reflex scoring values were assigned accordingly to Ma et al. (Ma et al., 2011): 0 - no spreading, 1 - intermediate spreading, 2 - full toe spreading.
Sample collection for SNC RNA-seq analysis
To investigate the transcriptional changes associated with peripheral nerve injury and regeneration, we performed RNA-sequencing of samples obtained from the rat sciatic nerve crush experiment. Distal and contralateral nerves were harvested at day 1, 7, 14 and 21 post SNC and at day 7 post SNC, respectively. Nerve samples were snap frozen in liquid nitrogen and stored at 80°C until further processing.
Library preparation and high-throughput sequencing
The RNA libraries were prepared using the Illumina TruSeq Stranded mRNA Sample Preparation protocol and sequenced using the Illumina HiSeq2500 platform following the manufacturer’s protocol. Samples were sequenced in paired-end mode to a length of 2x76bp base-pairs. Images from the instrument were processed using the manufacturer’s software to generate FASTQ sequence files. Read quality was assessed by running FastQC on the FASTQ files. Sequencing reads showed excellent quality, with a mean Phred score higher than 30 for all base positions. Raw reads were aligned to the rat genome (Rattus norvegicus, build Rnor_6) and genes annotated by Ensembl v6.0.87 for gene expression quantification using the exon quantification pipeline (Schuierer and Roma, 2016). Raw reads are available at the NIH Sequence Read Archive (SRA) with the following ID: PRJNA690705.
Data preprocessing and statistical analyses
Preprocessing of the gene raw counts and subsequent statistical analyses were carried out in R (R Core Team, 2020) using a customized analysis pipeline. Briefly, the EnsDb.Rnorvegicus.v79 R package (Rainer, 2017) was used to retrieve gene annotations and only protein-coding genes were retained for subsequent analyses, thereby reducing the initial data set to 19,457 genes. Raw counts were scaled using TMM normalization (Robinson and Oshlack, 2010) and the genefilter R package (Gentleman et al., 2020) used to remove lowly expressed features (below minimum threshold of 0.5 rpkm in at least 3 samples), leaving 13,852 genes in the filtered data set. The expression data was transformed using voom (Law et al., 2014) followed by differential gene expression analysis using limma linear modelling (Ritchie et al., 2015). The camera algorithm (Wu and Smyth, 2012) was used to perform competitive gene set enrichment analysis (GSEA), using as reference gene sets the gene ontology (GO) Biological Process collection from the Molecular Signature Database (accessed January 14th 2021) (Subramanian et al., 2005). For both differential expression analysis and GSEA, statistical significance was pronounced at a Benjamini-Hochberg (Benjamini and Hochberg, 1995) adjusted p-value threshold of < 0.05.
RNA-Seq data sets from public domain
Two further RNA-Seq datasets analyzed in this study have been described in (Ibebunjo et al.,2013; Giorgetti et al., 2019b) and (Barrette et al., 2010). Gene expression data for these studies were accessed from GEO as normalized expression values (accession ids GSE118825, GSE122116 and GSE22291).
CRISPR-Cas9 editing using electroporation
Two gRNA were designed on a DNA sequence flanking an exon and an intron using the GPP sgRNA Designer (Broad Institute, webtool) for CRISPR KO BV2 cells and listed in Table S3. Guides were obtained from Integrated DNA Technologies (IDT) by combination of crRNA (CRISPR RNA), Mm_Cas9_TMEM173_1_AD (IDT#223411367) and Mm_Cas9_TMEM173_1_AG (IDT#223411368), and tracrRNA (transactivating CRISPR RNA) (IDT #1072534) in equimolar amount, for 5 minutes at 95°C, cooled down to RT before storage at -20°C. A negative control gRNA was purchased from IDT (Alt-R® CRISPR-Cas9 Negative Control crRNA #1). The combination of crRNA and tracrRNA was mixed with Alt-R® S.p. HiFi Cas9 Nuclease V3 (IDT#1081060) in a ratio of 2:1 and incubated 10 min at RT. Sample preparation for transfection was performed using the Neon® Transfection System 100 μL Neon® Tips (ThermoScientific, cat#MPK10025). Cells were collected and suspended in Buffer R (ThermoScientific) at 2.7 × 10⁷ cells/ml and mixed with the crRNA/tracrRNA/Cas9 for 2–3 min Transfection was performed using the Neon transfection system (ThermoScientific, cat#MPK5000) at the following condition: 1700 Volts, 20 ms and 1 pulse.
Genomic DNA from cells was isolated using the QuickExtract DNA extraction solution (Epicentre #QE09050) following manufacturer’s instructions and quantified using NanoDrop ND-1000 Spectrophotometer. DNA was diluted to 100 ng/μl, and PCR reaction were performed containing a final concentration of 500 ng of DNA. GoTaq hot start Green master PCR mix (Promega #M5122) was used together with 100 μM of each PCR primer in a volume of 25 μl (Table S3).
Gene expression
Tissue and cells were lysed in TRIzol reagent (15596018, Thermo Fisher Scientific). Total RNA was isolated using Direct-zol RNA MiniPrep (Zymo Research) or manual isolation according to the manufacturer’s instructions. RNA was quantified using NanoDrop ND-1000 Spectrophotometer and RNA (500 ng) was then reverse transcribed to cDNA using the High-Capacity cDNA Reverse Transcription Kit (Thermo Fisher Scientific). TaqMan® qPCR experiments were performed in 384-well plates and run with the QuantuStudio System using the default cycling method (50°C for 2 minutes, 95°C for 10 minutes followed by 40 cycles at 95°C for 15 seconds and 60°C for 1 minutes) provided by the software. The reaction volume in each well was 5 μl and the mixture included 1X assay probe (containing specific primers and probes, Table 1), 1X TaqMan® universal master mix (containing PCR buffer, nucleotides and taq DNA polymerase) and cDNA template (12 ng). Data analysis was performed using the software qPCR Data Analysis, data were expressed as Ct values and used for the relative quantification of targets with the ΔΔCt calculation to give N-fold differences. Data were transformed through the equation 2−ΔΔCt. Gene-specific primers with FAM-labeled probes were from Thermo Fisher Scientific are reported in Table S4.
Immunoblotting
Sciatic nerves and gastrocnemius muscles were excised for protein extraction at the indicated point after SNC. Distal and contralateral nerves and muscle were harvested at day 1 post SNC and were snap frozen in liquid nitrogen and stored at -80°C until further processing. Sciatic nerve tissue was lysed in T-PER Tissue Protein Extraction Reagent (Thermo Scientific #78510) with Protease & Phosphatase inhibitor Cocktail (Thermo Scientific #1861282). Cells were scraped with into RIPA buffer (Pierce #89901) supplemented with 1% Halt Protease & Phosphatase inhibitor Cocktail (Thermo Scientific #1861282). Cell and tissue homogenates were kept at 4°C for 15 minutes on an orbital plate shaker before centrifugation (10 minutes at 13,000 rpm at 4°C). Protein concentrations were determined by BCA Protein Assay Kit (Pierce). SDS – polyacrylamide gel electrophoresis (SDS-PAGE) sample buffer was added to samples and equal amounts of protein proteins were separated using 4 - to 20% SDS – polyacrylamide gels (NuPAGE Novex 4-12% Bis-Tris gels from Invitrogen) and transferred onto nitrocellulose membranes by using Trans-Blot® Turbo™ Transfer System (Bio-Rad). Membranes were blocked in tris-buffered saline with 0.1% Tween 20 (TBS-T) and 5% (w/v) milk powder or 5% BSA. Primary and secondary antibodies were incubated in TBS-T and 5% milk or 5% BSA. Immunoreactive bands were as detected by enhanced chemiluminescence (50% Amersham ECL Prime Peroxide solution 50% Amersham ECL Prime Luminol Enhancer solution) and captured by Fusion FX (Vilber). Protein bands intensity was quantitated by densitometry with Fiji software. A list of antibodies is provided in Table S5.
Histology of spinal cord and sciatic nerve
Animals were euthanized with an overdose of isoflurane. L1-L3 spinal segments (with the corresponding vertebrae) of lumbar spinal cord were fixed in 10% neutral buffered formalin solution (NBF, Sigma-Aldrich, HT501128) for 48 hours at RT. Sciatic nerve samples were fixed in NBF for 24 hours at RT. Additional de-calcification in Immunocal reagent (StatLab Medical Products, 1414-32) was performed for 72 hours at RT for spinal cord samples. Dehydration and paraffin infiltration were performed on a Tissue-Tek VIP 6 Vacuum Infiltration Processor (Sakura Finetek Europe, Alphen aan den Rijn, the Netherlands). Before paraffin embedding, sciatic nerves were cut in three parts and embedded separately: R1, the branching point into the tibialis muscle, R2/R3, the crush site and R4, the proximal part. Following paraffin embedding 5 μm-thick sections of tissues were mounted on Superfrost Plus Adhesion Microscope Slides (Thermo Fisher Scientific, J1800AMNT). After 48-72 hours at 37°C slides were stored at RT.
Sciatic nerve and spinal cord
Antigen retrieval was performed in 0.1% Trypsin solution (Trypsin, ScyTek, TSS310) for 30 min at 37°C after deparaffinization/rehydration from xylene to distilled water. Sections were then blocked with PBS containing 5% Bovine Serum Albumin (BSA, Miltenyi Biotec, 130-091-376) and 2.5% Triton X-100 (X100, Sigma-Aldrich) for one hour at RT. After washing with PBS-T (phosphate buffered saline with Tween 20) sections were incubated with the primary antibodies for NF200 (Anti-Neurofilament 200 kDa Antibody, clone NE14, Alexa Fluor 555 Conjugate, Merck Millipore, MAB5256A5, 1/500 dilution) and MBP (Anti-Myelin Basic Protein, BioRad, MCA409S, 1/100) in PBS containing 1.5% BSA in 1.5% Triton overnight at 4°C. Incubation with secondary antibody, DyLightTM 650-Donkey anti-Rat IgG (ThermoScientific SA5-10029, 1/500), was performed at RT for 2 h, after washing with TBS-T. Sections were then counterstained with DAPI (Molecular Probe, 5 mg/mL, 1/10000) in PBS for 10 min at RT. After rinsing in PBS, slides were mounted in Mowiol 4-88 according to manufacturer’s recommendations (Merck Millipore, 475904-M). Fluorescently labeled slides were scanned with an Olympus VS-120 Virtual-Slide-Microscope scanner (Olympus Schweiz AG, Volketswil) with a 40 X objective.
The microglial marker Iba-1 was detected by automated immunohistochemistry applied in Discovery Ventana Ultra (Roche, Tucson, AZ) following the manufacturer recommendations. Antigen antigen retrieval was performed in cell conditioning #1 buffer (CC1, Roche, 950-124) for 24 minutes after the deparaffinization with 3 cycle of 8 minutes at 69°C in Discovery Wash Buffer (Ventana, 950-510) and fixation in glutaraldehyde 0.05% in 0.9 NaCl for 8 min (Merk, 8.20603.2500). Washing steps were performed in Reaction Buffer (Ventana, 950-300) and sections were incubated with the primary antibodies for Iba-1 (Rabbit IgG anti-IBA1, Wako 019-19741, dilution 1:2000 in the antibody diluent buffer from Roche, ADB250) for 1 hour. After a secondary antibody goat anti-rabbit IgG-biotin (Vector Labs, BA-1000) was incubated for 32 min at RT (1/1000 dilution) in the antibody diluent buffer. DABMap kit (Ventana, 760-124) was used to detect the specific signal. Sections were counterstained with Hematoxylin II (Ventana, 190-2208) for 4 minutes. Slides were incubated with the Bluing Reagent (Ventana, 760-2037) for 4-8 min before washing. Dehydration and clearing in xylene was completed before permanently mounting the slides with Tissue Tek Glas Mounting Media (Sakura Finetek Europe, AJ Alphen aan den Rijn, NL).
Quantification and statistical analysis
Imaging analysis
Olympus VS-120 Virtual-Slide-Microscope scanner (Olympus Schweiz AG, Volketswil) with a 40x objective was used to scan sciatic nerve and spinal cord slides. The regions of the nerves and of the spinal cord to be analyzed were outlined manually. Within the manual outline, nerve fiber bundle regions and the grey matter (dorsal and ventral horns) were subsequently detected using specifically trained neural networks (HALO, version 3.1, with DenseNet pixel classifier, Indica Labs, Albuquerque, NM, USA). These classifiers have been trained on a small random subset of images (approximately 5%).
Sciatic nerve
Axon and myelin quantification was performed using HALO image analysis software (Version 3.1, Indica Labs, Albuquerque, NM, USA). Axons were analyzed in the classified “bundle” regions using the ‘‘CytoNuclear FL v1.4’’ algorithm (Indica Labs). Individual axons were identified and their outlines were expanded forming a ring around each detected axon as the region of interest for evaluating myelin content. The number of NF200 positive areas and the area of the nerve tissue bundles were measured. The sum of the axon areas was normalized to the bundle area. In addition, the mean area of axons was computed, and the values are provided in μm2. Myelin fluorescent signal intensity was computed in all the ring areas, representing total myelin content. The total area of myelin ring regions of interest has been used for normalization of the fluorescent intensity, resulting in an estimate of the mean myelin content per axon. Myelin not associated with an axon has not been evaluated. In addition, Dapi positive nuclei have been detected and counted in the nerve bundle areas.
Spinal cord
The quantitative evaluation of microglia numbers and activation state has been performed using HALO image analysis platform (HALO v. 3.1 including AI toolbox, Indica Labs, Albuquerque, NM, USA) and combining readouts from several machine learning DenseNet networks individually trained. The implementation using HALO follows closely the approach extensively described in Beckmann et al. (Beckmann et al., 2018). Briefly, three DenseNet networks have been set-up and trained to detect soma alone, soma plus proximal processes (processes around and connected to a soma) and soma plus all processes (proximal and distal processes; distal processes have no visible connection to a soma). Distal process areas have been computed as the difference of soma plus all processes minus soma plus proximal areas. Activation of the microglia has subsequently been computed as the soma plus proximal process areas divided by the respective distal process areas.
Caspase 3 staining
BV2 cells were fixed with 4% paraformaldehyde (Electron Microscopy Sciences #15714) for 15 minutes at room temperature after 24 h treatment with specified concentration of cGAMP. Cells were then permeabilized with 0.2% Triton® X-100 (Sigma T8787) and blocked with 10% goat serum (Invitrogen #50-062Z). Caspase-3, cleaved (Asp175) (clone: 5A1E) (Cell Signaling #9664) antibody was diluted in PBS (1:1000) and cells were incubated for 1 h. Subsequently secondary antibody, Alexa Fluor 488 (Invitrogen # A11034) and DAPI solution (Promokine #707-40043) were diluted respectively 1:750 and 1:500 in PBS and used to incubate cells for 1 h. Caspase 3 positive cells was determined using CellInsight Technology (CellInsight CX5, HCS Studio Cell analysis software). The data are expressed as mean ± standard error of the mean (SEM) and it was calculated as the percentage of Caspase 3 – positive cells over the total number of nuclei.
Statistical analysis
Prism 8 (GraphPad Software, La Jolla, CA) was used for statistical analysis. Gene expression, densitometric, histology and electrophysiology data were analyzed using multiple unpaired two-tailed Student’s t test, one-way ANOVA, two-way ANOVA with Dunnett’s or Tukey’s multiple comparisons test or non-parametric Mann-Whitney tests. Statistical significance was considered at p≤0.05.
Acknowledgments
We would like to thank Nathalie Accart Gris and Pascale Brebbia for supporting the histology effort, Elisa Giorgetti for helpful discussions, and Brigitte Fournier for input to the rat sciatic nerve crush study design. This work was supported by Novartis Pharma AG Basel, Switzerland. G.M. is the recipient of aNIBR postdoctoral fellowship.
Author contributions
Conceptualization, G.M. and M.F.; Methodology, F.M. and M.B.; Investigation, G.T., K.W., V.P.U., P.K., C.L., M.O., V.R., M.P., I.G., M.M., and D.S., J.K.; Resources, N.B. and G.R.; Formal Analysis, A.D., Y.Z., K.D., J.R., and S.B.; Data Curation, J.R., K.D.L., C.G.K., and S.B.; Writing – Original Draft, G.M.; Writing – Review & Editing, A.D., M.B., F.M., G.R., S.B., D.G., C.G.K., and M.F.; Visualization, J.R. and G.M.; Supervision, M.F.
Declaration of interests
All authors are employees and some are shareholders of Novartis.
Published: December 17, 2021
Footnotes
Supplemental information can be found online at https://doi.org/10.1016/j.isci.2021.103434.
Contributor Information
Giulio Morozzi, Email: morozzigiulio@gmail.com.
Frederic Morvan, Email: frederic.morvan@novartis.com.
Mara Fornaro, Email: mara.fornaro@novartis.com.
Supplemental information
Data and code availability
-
•
Transcriptomic analysis of rat sciatic nerve crush study analyzed in this paper can be found online. Raw reads are available at the NIH Sequence Read Archive (SRA) with the following ID: PRJNA690705. R code used for statistical analyses is available upon request. Data regarding the comparison between adult and aged mice spinal cord and microglia can be found in Giorgetti et al., 2019b and in GEO database under the dataset number: GSE122116. Genomic profiling of rat sarcopenic muscle data are available in Ibebunjo et al., 2013 and in GEO: GSE118825. The transcriptomic analysis of mice sciatic nerve crush study from Barrette et al., 2010 is available in GEO: GSE118825.
-
•
All original code has been deposited at SRA and is publicly available as of the date of publication. DOIs are listed in the key resources table.
-
•
Any additional information required to reanalyze the data reported in this paper is available from the lead contact upon request
References
- Arnold W.D., Sheth K.A., Wier C.G., Kissel J.T., Burghes A.H., Kolb S.J. Electrophysiological motor unit number estimation (MUNE) measuring compound muscle action potential (CMAP) in mouse hindlimb muscles. J. Vis. Exp. 2015 doi: 10.3791/52899. [DOI] [PMC free article] [PubMed] [Google Scholar]
- Arthur-Farraj P.J., Latouche M., Wilton D.K., Quintes S., Chabrol E., Banerjee A., Woodhoo A., Jenkins B., Rahman M., Turmaine M., et al. c-Jun reprograms Schwann cells of injured nerves to generate a repair cell essential for regeneration. Neuron. 2012;75:633–647. doi: 10.1016/j.neuron.2012.06.021. [DOI] [PMC free article] [PubMed] [Google Scholar]
- Baccarini M., Dello Sbarba P., Buscher D., Bartocci A., Stanley E.R. IFN-gamma/lipopolysaccharide activation of macrophages is associated with protein kinase C-dependent down-modulation of the colony-stimulating factor-1 receptor. J. Immunol. 1992;149:2656–2661. [PubMed] [Google Scholar]
- Barrette B., Calvo E., Vallieres N., Lacroix S. Transcriptional profiling of the injured sciatic nerve of mice carrying the Wld(S) mutant gene: Identification of genes involved in neuroprotection, neuroinflammation, and nerve regeneration. Brain Behav. Immun. 2010;24:1254–1267. doi: 10.1016/j.bbi.2010.07.249. [DOI] [PubMed] [Google Scholar]
- Beckmann N., Giorgetti E., Neuhaus A., Zurbruegg S., Accart N., Smith P., Perdoux J., Perrot L., Nash M., Desrayaud S., et al. Brain region-specific enhancement of remyelination and prevention of demyelination by the CSF1R kinase inhibitor BLZ945. Acta Neuropathol.Commun. 2018;6:9. doi: 10.1186/s40478-018-0510-8. [DOI] [PMC free article] [PubMed] [Google Scholar]
- Benjamini Y., Hochberg Y. Controlling the false discovery rate: Apractical and powerful approach to multiple testing. J.R.Stat.Soc.B. 1995;57:12. [Google Scholar]
- Bridge P.M., Ball D.J., Mackinnon S.E., Nakao Y., Brandt K., Hunter D.A., Hertl C. Nerve crush injuries-a model for axonotmesis. Exp.Neurol. 1994;127:284–290. doi: 10.1006/exnr.1994.1104. [DOI] [PubMed] [Google Scholar]
- Brown M.S., Ye J., Rawson R.B., Goldstein J.L. Regulated intramembrane proteolysis: A control mechanism conserved from bacteria to humans. Cell. 2000;100:391–398. doi: 10.1016/s0092-8674(00)80675-3. [DOI] [PubMed] [Google Scholar]
- Buchrieser J., James W., Moore M.D. Human induced pluripotent stem cell-derived macrophages share ontogeny with MYB-independent tissue-resident macrophages. Stem Cell Rep. 2017;8:334–345. doi: 10.1016/j.stemcr.2016.12.020. [DOI] [PMC free article] [PubMed] [Google Scholar]
- Buttner R., Schulz A., Reuter M., Akula A.K., Mindos T., Carlstedt A., Riecken L.B., Baader S.L., Bauer R., Morrison H. Inflammaging impairs peripheral nerve maintenance and regeneration. Aging Cell. 2018;17:e12833. doi: 10.1111/acel.12833. [DOI] [PMC free article] [PubMed] [Google Scholar]
- Cattin A.L., Burden J.J., Van Emmenis L., Mackenzie F.E., Hoving J.J., Garcia Calavia N., Guo Y., McLaughlin M., Rosenberg L.H., Quereda V., et al. Macrophage-induced blood vessels guide Schwann cell-mediated regeneration of peripheral nerves. Cell. 2015;162:1127–1139. doi: 10.1016/j.cell.2015.07.021. [DOI] [PMC free article] [PubMed] [Google Scholar]
- Chen P., Piao X., Bonaldo P. Role of macrophages in Wallerian degeneration and axonal regeneration after peripheral nerve injury. Acta Neuropathol. 2015;130:605–618. doi: 10.1007/s00401-015-1482-4. [DOI] [PubMed] [Google Scholar]
- Damani M.R., Zhao L., Fontainhas A.M., Amaral J., Fariss R.N., Wong W.T. Age-related alterations in the dynamic behavior of microglia. Aging Cell. 2011;10:263–276. doi: 10.1111/j.1474-9726.2010.00660.x. [DOI] [PMC free article] [PubMed] [Google Scholar]
- Damoiseaux J.G., Dopp E.A., Neefjes J.J., Beelen R.H., Dijkstra C.D. Heterogeneity of macrophages in the rat evidenced by variability in determinants: Two new anti-rat macrophage antibodies against a heterodimer of 160 and 95 kd (CD11/CD18) J. Leukoc. Biol. 1989;46:556–564. doi: 10.1002/jlb.46.6.556. [DOI] [PubMed] [Google Scholar]
- Davis E.J., Foster T.D., Thomas W.E. Cellular forms and functions of brain microglia. Brain Res.Bull. 1994;34:73–78. doi: 10.1016/0361-9230(94)90189-9. [DOI] [PubMed] [Google Scholar]
- Fang R., Wang C., Jiang Q., Lv M., Gao P., Yu X., Mu P., Zhang R., Bi S., Feng J.M., et al. NEMO-IKKbeta are essential for IRF3 and NF-kappaB activation in the cGAS-STING pathway. J. Immunol. 2017;199:3222–3233. doi: 10.4049/jimmunol.1700699. [DOI] [PubMed] [Google Scholar]
- Faroni A., Mobasseri S.A., Kingham P.J., Reid A.J. Peripheral nerve regeneration: Experimental strategies and future perspectives. Adv. Drug Deliv. Rev. 2015;82-83:160–167. doi: 10.1016/j.addr.2014.11.010. [DOI] [PubMed] [Google Scholar]
- Gaudet A.D., Popovich P.G., Ramer M.S. Wallerian degeneration: Gaining perspective on inflammatory events after peripheral nerve injury. J. Neuroinflammation. 2011;8:110. doi: 10.1186/1742-2094-8-110. [DOI] [PMC free article] [PubMed] [Google Scholar]
- Gentleman, R., Carey, V., Huber, W., Hahne, F. (2020) genefilter: genefilter: Methods for filtering genes from high-throughput experiments. R package version 1.72.0.
- Giorgetti E., Obrecht M., Ronco M., Panesar M., Lambert C., Accart N., Doelemeyer A., Nash M., Bidinosti M., Beckmann N. Magnetic resonance imaging as a biomarker in rodent peripheral nerve injury models reveals anage-related impairment of nerve regeneration. Sci. Rep. 2019;9:13508. doi: 10.1038/s41598-019-49850-2. [DOI] [PMC free article] [PubMed] [Google Scholar]
- Giorgetti E., Panesar M., Zhang Y., Joller S., Ronco M., Obrecht M., Lambert C., Accart N., Beckmann N., Doelemeyer A., et al. Modulation of microglia by voluntary exercise or CSF1R inhibition prevents age-related loss of functional motor units. Cell Rep. 2019;29:1539–1554.e7. doi: 10.1016/j.celrep.2019.10.003. [DOI] [PubMed] [Google Scholar]
- Groh J., Weis J., Zieger H., Stanley E.R., Heuer H., Martini R. Colony-stimulating factor-1 mediates macrophage-related neural damage in a model for Charcot-Marie-Tooth disease type 1X. Brain. 2012;135(Pt 1):88–104. doi: 10.1093/brain/awr283. [DOI] [PMC free article] [PubMed] [Google Scholar]
- Guan Z., Kuhn J.A., Wang X., Colquitt B., Solorzano C., Vaman S., Guan A.K., Evans-Reinsch Z., Braz J., Devor M., et al. Injured sensory neuron-derived CSF1 induces microglial proliferation and DAP12-dependent pain. Nat. Neurosci. 2016;19:94–101. doi: 10.1038/nn.4189. [DOI] [PMC free article] [PubMed] [Google Scholar]
- Hefendehl J.K., Neher J.J., Suhs R.B., Kohsaka S., Skodras A., Jucker M. Homeostatic and injury-induced microglia behavior in the aging brain. Aging Cell. 2014;13:60–69. doi: 10.1111/acel.12149. [DOI] [PMC free article] [PubMed] [Google Scholar]
- Husemann J., Loike J.D., Anankov R., Febbraio M., Silverstein S.C. Scavenger receptors in neurobiology and neuropathology: Their role on microglia and other cells of the nervous system. Glia. 2002;40:195–205. doi: 10.1002/glia.10148. [DOI] [PubMed] [Google Scholar]
- Hussain G., Wang J., Rasul A., Anwar H., Qasim M., Zafar S., Aziz N., Razzaq A., Hussain R., de Aguilar J.G., Sun T. Current status of therapeutic approaches against peripheral nerve injuries: Adetailed story from injury to recovery. Int. J. Biol. Sci. 2020;16:116–134. doi: 10.7150/ijbs.35653. [DOI] [PMC free article] [PubMed] [Google Scholar]
- Ibebunjo C., Chick J.M., Kendall T., Eash J.K., Li C., Zhang Y., Vickers C., Wu Z., Clarke B.A., Shi J., et al. Genomic and proteomic profiling reveals reduced mitochondrial function and disruption of the neuromuscular junction driving rat sarcopenia. Mol. Cell. Biol. 2013;33:194–212. doi: 10.1128/MCB.01036-12. [DOI] [PMC free article] [PubMed] [Google Scholar]
- Inoue K., Tsuda M. Microglia in neuropathic pain: Cellular and molecular mechanisms and therapeutic potential. Nat. Rev. Neurosci. 2018;19:138–152. doi: 10.1038/nrn.2018.2. [DOI] [PubMed] [Google Scholar]
- Ishikawa H., Barber G.N. STING is an endoplasmic reticulum adaptor that facilitates innate immune signalling. Nature. 2008;455:674–678. doi: 10.1038/nature07317. [DOI] [PMC free article] [PubMed] [Google Scholar]
- Ishikawa H., Ma Z., Barber G.N. STING regulates intracellular DNA-mediated, type I interferon-dependent innate immunity. Nature. 2009;461:788–792. doi: 10.1038/nature08476. [DOI] [PMC free article] [PubMed] [Google Scholar]
- Karanth S., Yang G., Yeh J., Richardson P.M. Nature of signals that initiate the immune response during Wallerian degeneration of peripheral nerves. Exp. Neurol. 2006;202:161–166. doi: 10.1016/j.expneurol.2006.05.024. [DOI] [PubMed] [Google Scholar]
- Kato J., Svensson C.I. Role of extracellular damage-associated molecular pattern molecules (DAMPs) as mediators of persistent pain. Prog. Mol. Biol. Transl. Sci. 2015;131:251–279. doi: 10.1016/bs.pmbts.2014.11.014. [DOI] [PubMed] [Google Scholar]
- Kiefer R., Kieseier B.C., Stoll G., Hartung H.P. The role of macrophages in immune-mediated damage to the peripheral nervous system. Prog.Neurobiol. 2001;64:109–127. doi: 10.1016/s0301-0082(00)00060-5. [DOI] [PubMed] [Google Scholar]
- Kigerl K.A., de Rivero Vaccari J.P., Dietrich W.D., Popovich P.G., Keane R.W. Pattern recognition receptors and central nervous system repair. Exp. Neurol. 2014;258:5–16. doi: 10.1016/j.expneurol.2014.01.001. [DOI] [PMC free article] [PubMed] [Google Scholar]
- Law C.W., Chen Y., Shi W., Smyth G.K. voom: Precision weights unlock linear model analysis tools for RNA-seq read counts. Genome Biol. 2014;15:R29. doi: 10.1186/gb-2014-15-2-r29. [DOI] [PMC free article] [PubMed] [Google Scholar]
- Lawson L.J., Perry V.H., Dri P., Gordon S. Heterogeneity in the distribution and morphology of microglia in the normal adult mouse brain. Neuroscience. 1990;39:151–170. doi: 10.1016/0306-4522(90)90229-w. [DOI] [PubMed] [Google Scholar]
- Lee S., Shi X.Q., Fan A., West B., Zhang J. Targeting macrophage and microglia activation with colony stimulating factor 1 receptor inhibitor is an effective strategy to treat injury-triggered neuropathic pain. Mol. Pain. 2018;14 doi: 10.1177/1744806918764979. 1744806918764979. [DOI] [PMC free article] [PubMed] [Google Scholar]
- Lehrmann E., Christensen T., Zimmer J., Diemer N.H., Finsen B. Microglial and macrophage reactions mark progressive changes and define the penumbra in the rat neocortex and striatum after transient middle cerebral artery occlusion. J. Comp. Neurol. 1997;386:461–476. [PubMed] [Google Scholar]
- Liu P., Peng J., Han G.H., Ding X., Wei S., Gao G., Huang K., Chang F., Wang Y. Role of macrophages in peripheral nerve injury and repair. Neural Regen. Res. 2019;14:1335–1342. doi: 10.4103/1673-5374.253510. [DOI] [PMC free article] [PubMed] [Google Scholar]
- Lively S., Schlichter L.C. Microglia responses to pro-inflammatory stimuli (LPS, IFNgamma+TNFalpha) and reprogramming by resolving cytokines (IL-4, IL-10) Front.Cell.Neurosci. 2018;12:215. doi: 10.3389/fncel.2018.00215. [DOI] [PMC free article] [PubMed] [Google Scholar]
- Ma C.H.E., Omura T., Cobos E.J., Latrémolière A., Ghasemlou N., Brenner G.J., Van Veen E., Barrett L., Sawada T., Gao F., et al. Accelerating axonal growth promotes motor recovery after peripheral nerve injury in mice. J.Clin. Invest. 2011;121:4332–4347. doi: 10.1172/JCI58675. [DOI] [PMC free article] [PubMed] [Google Scholar]
- Madeddu S., Woods T.A., Mukherjee P., Sturdevant D., Butchi N.B., Peterson K.E. Identification of glial activation markers by comparison of transcriptome changes between astrocytes and microglia following innate immune stimulation. PLoS One. 2015;10:e0127336. doi: 10.1371/journal.pone.0127336. [DOI] [PMC free article] [PubMed] [Google Scholar]
- Martini R., Fischer S., Lopez-Vales R., David S. Interactions between Schwann cells and macrophages in injury and inherited demyelinating disease. Glia. 2008;56:1566–1577. doi: 10.1002/glia.20766. [DOI] [PubMed] [Google Scholar]
- Meylan E., Tschopp J., Karin M. Intracellular pattern recognition receptors in the host response. Nature. 2006;442:39–44. doi: 10.1038/nature04946. [DOI] [PubMed] [Google Scholar]
- Mueller M., Leonhard C., Wacker K., Ringelstein E.B., Okabe M., Hickey W.F., Kiefer R. Macrophage response to peripheral nerve injury: The quantitative contribution of resident and hematogenous macrophages. Lab.Invest. 2003;83:175–185. doi: 10.1097/01.lab.0000056993.28149.bf. [DOI] [PubMed] [Google Scholar]
- Munder M. Arginase: An emerging key player in the mammalian immune system. Br. J. Pharmacol. 2009;158:638–651. doi: 10.1111/j.1476-5381.2009.00291.x. [DOI] [PMC free article] [PubMed] [Google Scholar]
- Murthy A.M.V., Robinson N., Kumar S. Crosstalk between cGAS-STING signaling and cell death. Cell Death Differ. 2020;27:2989–3003. doi: 10.1038/s41418-020-00624-8. [DOI] [PMC free article] [PubMed] [Google Scholar]
- Palucka K.A., Taquet N., Sanchez-Chapuis F., Gluckman J.C. Dendritic cells as the terminal stage of monocyte differentiation. J. Immunol. 1998;160:4587–4595. [PubMed] [Google Scholar]
- Poss K.D. Advances in understanding tissue regenerative capacity and mechanisms in animals. Nat. Rev. Genet. 2010;11:710–722. doi: 10.1038/nrg2879. [DOI] [PMC free article] [PubMed] [Google Scholar]
- R Core Team . R Foundation for Statistical Computing; 2020. R: A Language and Environment for Statistical Computing.https://www.R-project.org/ [Google Scholar]
- Rainer, J. (2017) EnsDb.Rnorvegicus.v79: Ensembl based annotation package. R package version 2.99.0.
- Retini C., Vecchiarelli A., Monari C., Tascini C., Bistoni F., Kozel T.R. Capsular polysaccharide of Cryptococcus neoformans induces proinflammatory cytokine release by human neutrophils. Infect.Immun. 1996;64:2897–2903. doi: 10.1128/iai.64.8.2897-2903.1996. [DOI] [PMC free article] [PubMed] [Google Scholar]
- Ritchie M.E., Phipson B., Wu D., Hu Y., Law C.W., Shi W., Smyth G.K. Limma powers differential expression analyses for RNA-sequencing and microarray studies. Nucleic Acids Res. 2015;43:e47. doi: 10.1093/nar/gkv007. [DOI] [PMC free article] [PubMed] [Google Scholar]
- Robinson M.D., Oshlack A. A scaling normalization method for differential expression analysis of RNA-seq data. Genome Biol. 2010;11:R25. doi: 10.1186/gb-2010-11-3-r25. [DOI] [PMC free article] [PubMed] [Google Scholar]
- Schuierer S., Roma G. The exon quantification pipeline (EQP): A comprehensive approach to the quantification of gene, exon and junction expression from RNA-seq data. Nucleic Acids Res. 2016;44:e132. doi: 10.1093/nar/gkw538. [DOI] [PMC free article] [PubMed] [Google Scholar]
- Stoll G., Jander S., Schroeter M. Detrimental and beneficial effects of injury-induced inflammation and cytokine expression in the nervous system. Adv. Exp. Med. Biol. 2002;513:87–113. doi: 10.1007/978-1-4615-0123-7_3. [DOI] [PubMed] [Google Scholar]
- Subramanian A., Tamayo P., Mootha V.K., Mukherjee S., Ebert B.L., Gillette M.A., Paulovich A., Pomeroy S.L., Golub T.R., Lander E.S., et al. Gene set enrichment analysis: A knowledge-based approach for interpreting genome-wide expression profiles. Proc. Natl. Acad. Sci. U S A. 2005;102:15545–15550. doi: 10.1073/pnas.0506580102. [DOI] [PMC free article] [PubMed] [Google Scholar]
- Takeuchi O., Akira S. Pattern recognition receptors and inflammation. Cell. 2010;140:805–820. doi: 10.1016/j.cell.2010.01.022. [DOI] [PubMed] [Google Scholar]
- Tanaka Y., Chen Z.J. STING specifies IRF3 phosphorylation by TBK1 in the cytosolic DNA signaling pathway. Sci.Signal. 2012;5:ra20. doi: 10.1126/scisignal.2002521. [DOI] [PMC free article] [PubMed] [Google Scholar]
- Wang P.L., Yim A.K.Y., Kim K.W., Avey D., Czepielewski R.S., Colonna M., Milbrandt J., Randolph G.J. Peripheral nerve resident macrophages share tissue-specific programming and features of activated microglia. Nat. Commun. 2020;11:2552. doi: 10.1038/s41467-020-16355-w. [DOI] [PMC free article] [PubMed] [Google Scholar]
- Wilhelmsen K., van der Geer P. Phorbol 12-myristate 13-acetate-induced release of the colony-stimulating factor 1 receptor cytoplasmic domain into the cytosol involves two separate cleavage events. Mol. Cell. Biol. 2004;24:454–464. doi: 10.1128/MCB.24.1.454-464.2004. [DOI] [PMC free article] [PubMed] [Google Scholar]
- Wojtkiewicz D.M., Saunders J., Domeshek L., Novak C.B., Kaskutas V., Mackinnon S.E. Social impact of peripheral nerve injuries. Hand (N Y) 2015;10:161–167. doi: 10.1007/s11552-014-9692-0. [DOI] [PMC free article] [PubMed] [Google Scholar]
- Wu D., Smyth G.K. Camera: A competitive gene set test accounting for inter-gene correlation. Nucleic Acids Res. 2012;40:e133. doi: 10.1093/nar/gks461. [DOI] [PMC free article] [PubMed] [Google Scholar]
- Yu C.H., Davidson S., Harapas C.R., Hilton J.B., Mlodzianoski M.J., Laohamonthonkul P., Louis C., Low R.R.J., Moecking J., De Nardo D., et al. TDP-43 triggers mitochondrial DNA release via mPTP to activate cGAS/STING in ALS. Cell. 2020;183:636–649.e18. doi: 10.1016/j.cell.2020.09.020. [DOI] [PMC free article] [PubMed] [Google Scholar]
- Zhang Q., Itagaki K., Hauser C.J. Mitochondrial DNA is released by shock and activates neutrophils via p38 map kinase. Shock. 2010;34:55–59. doi: 10.1097/SHK.0b013e3181cd8c08. [DOI] [PubMed] [Google Scholar]
- Zhang Q., Raoof M., Chen Y., Sumi Y., Sursal T., Junger W., Brohi K., Itagaki K., Hauser C.J. Circulating mitochondrial DAMPs cause inflammatory responses to injury. Nature. 2010;464:104–107. doi: 10.1038/nature08780. [DOI] [PMC free article] [PubMed] [Google Scholar]
- Zigmond R.E., Echevarria F.D. Macrophage biology in the peripheral nervous system after injury. Prog.Neurobiol. 2019;173:102–121. doi: 10.1016/j.pneurobio.2018.12.001. [DOI] [PMC free article] [PubMed] [Google Scholar]
Associated Data
This section collects any data citations, data availability statements, or supplementary materials included in this article.
Supplementary Materials
Data Availability Statement
-
•
Transcriptomic analysis of rat sciatic nerve crush study analyzed in this paper can be found online. Raw reads are available at the NIH Sequence Read Archive (SRA) with the following ID: PRJNA690705. R code used for statistical analyses is available upon request. Data regarding the comparison between adult and aged mice spinal cord and microglia can be found in Giorgetti et al., 2019b and in GEO database under the dataset number: GSE122116. Genomic profiling of rat sarcopenic muscle data are available in Ibebunjo et al., 2013 and in GEO: GSE118825. The transcriptomic analysis of mice sciatic nerve crush study from Barrette et al., 2010 is available in GEO: GSE118825.
-
•
All original code has been deposited at SRA and is publicly available as of the date of publication. DOIs are listed in the key resources table.
-
•
Any additional information required to reanalyze the data reported in this paper is available from the lead contact upon request