

Abstract
Nucleosome‐depleted regions (NDRs) at gene promoters support initiation of RNA polymerase II transcription. Interestingly, transcription often initiates in both directions, resulting in an mRNA and a divergent non‐coding (DNC) transcript of unclear purpose. Here, we characterized the genetic architecture and molecular mechanism of DNC transcription in budding yeast. Using high‐throughput reverse genetic screens based on quantitative single‐cell fluorescence measurements, we identified the Hda1 histone deacetylase complex (Hda1C) as a repressor of DNC transcription. Nascent transcription profiling showed a genome‐wide role of Hda1C in repression of DNC transcription. Live‐cell imaging of transcription revealed that mutations in the Hda3 subunit increased the frequency of DNC transcription. Hda1C contributed to decreased acetylation of histone H3 in DNC transcription regions, supporting DNC transcription repression by histone deacetylation. Our data support the interpretation that DNC transcription results as a consequence of the NDR‐based architecture of eukaryotic promoters, but that it is governed by locus‐specific repression to maintain genome fidelity.
Keywords: divergent non‐coding (DNC) transcription, live‐cell imaging, non‐coding RNA (ncRNA), RNA polymerase II transcription
Subject Categories: Chromatin, Transcription & Genomics
A yeast reverse‐genetic screen identifies factors affecting divergent non‐coding transcription.
Introduction
RNA polymerase II (RNAPII) transcribes DNA of eukaryotic genomes into RNA molecules (Osman & Cramer, 2020). Widespread transcriptional activity of RNAPII in non‐protein‐coding regions of genome results in non‐protein‐coding RNAs (David et al, 2006; Kapranov et al, 2007; Core et al, 2008). The transcriptional noise hypothesis posits that non‐coding transcription reflects inaccuracies of cellular machinery that carry little functional significance (Ponjavic et al, 2007; Struhl, 2007). However, co‐transcriptional events resulting from the act of non‐coding transcription impact cellular functions ranging from gene regulation to DNA replication (Gowthaman et al, 2020). Although the purpose of genome‐wide non‐coding transcription remains elusive, a growing number of cellular functions carried out by non‐coding RNAs (ncRNAs) (Quinn & Chang, 2016; Gil & Ulitsky, 2020) and the dedicated regulation of non‐coding transcription (Jensen et al, 2013) indicate that interpreting non‐coding transcription through the transcriptional noise hypothesis may be an oversimplification.
Divergent non‐coding (DNC) transcription from eukaryotic gene promoter regions (Seila et al, 2008; Neil et al, 2009; Xu et al, 2009; Ntini et al, 2013) exemplifies the tight regulation of non‐coding transcription since transcription initiates in both directions at nucleosome‐depleted regions (NDRs) that characterize eukaryotic promoters. DNC transcription is characteristic of a wide range of eukaryotic organisms (Neil et al, 2009; Wang et al, 2009; Sigova et al, 2013; Core et al, 2014). Interestingly, the strength of DNC transcription is variable and restricted more tightly in plants than in yeast and mammals (Kindgren et al, 2020). Cellular pathways that selectively activate or repress DNC transcription may operate with variable intensities and thereby account for the differences in DNC expression across organisms.
The budding yeast has a high‐density genome and relatively high levels of DNC transcription, which results in a high likelihood of DNC transcription invading neighboring genes to affect gene expression and fitness (Xu et al, 2011; Bumgarner et al, 2012; Alcid & Tsukiyama, 2014; du Mee et al, 2018; Moretto et al, 2018). However, since functional DNC transcription often results in relatively short‐lived RNA species, elucidating the cellular functions of DNC remains a challenge. DNC transcripts are targeted for co‐transcriptional RNA degradation by the nuclear exosome pathway (Xu et al, 2009), and this mechanism of DNC repression is conserved in mammals (Almada et al, 2013; Ntini et al, 2013). Experimental detection of DNC transcription is thus facilitated by analyses of nascent RNAPII transcription (Churchman & Weissman, 2011a) and RNA profiling of RNA degradation pathway mutants (Wyers et al, 2005; Neil et al, 2009; Xu et al, 2009; Van Dijk et al, 2011; Schulz et al, 2013). In addition to selective RNA degradation, the DNC transcript and the corresponding mRNA are differentially regulated at the level of transcriptional initiation by sequence‐specific transcription factors (Neil et al, 2009; Challal et al, 2018; Wu et al, 2018) that lead to the formation of distinct pre‐initiation complexes that drive transcription in each direction of the NDR boundaries (Rhee & Pugh, 2012). Finally, chromatin‐based mechanisms provide a third pathway for regulation (Whitehouse et al, 2007; Tan‐Wong et al, 2012; Marquardt et al, 2014a; Rege et al, 2015). Among the chromatin factors influencing transcription, histone acetylation, which is governed by histone acetyltransferases (HATs) and histone deacetylases (HDACs) (Kurdistani & Grunstein, 2003; Park & Kim, 2020), is of particular interest. In budding yeast, the Hda1 complex (Hda1C) removes acetylation on residues in histones H2A, H2B, and H3 (Carmen et al, 1996; Wu et al, 2001) and Hda1C‐linked histone deacetylation facilitates dynamic transcriptional responses (Nicolas et al, 2018; Chen et al, 2019). Specifically, acetylation of histone 3 lysine 56 (H3K56ac) mediates histone exchange of the −1 nucleosome, and disruption of the H3K56ac homeostasis through mutations in HDACs or the Chromatin Assembly Factor I (CAF‐I) histone chaperone complex amplifies DNC transcription genome‐wide (Marquardt et al, 2014a; Rege et al, 2015). In summary, DNC transcription is highly regulated in budding yeast, yet the full spectrum of regulatory activities and their interconnections remains elusive.
Transcription of a gene occurs by selective initiation of a single RNAPII (constitutive expression) or in bursts, through high activity of several RNAPIIs (Zenklusen et al, 2008). The different mechanisms of initiation account for cell‐to‐cell variability that result in heterogeneous transcriptomes even in homogeneous growth conditions (Swain et al, 2002). The dynamics of DNC transcription remain unexplored. Single‐molecule imaging offers the possibility to record transcription events and estimate the parameters of transcription dynamics. Single‐molecule fluorescence in situ hybridization (smFISH) allows visualization of transcripts in fixed cells, and the MS2/PP7 dual RNA‐aptamer‐based reporter system allows the observation of single transcription events in living cells (Hocine et al, 2013; Lenstra et al, 2015). Recording transcription initiation by live‐cell imaging reveals the frequency and duration of transcription initiation, whereby the frequency determines the rate of initiation and the duration indicates RNAPII transition or elongation (Larson et al, 2011; Lenstra et al, 2015). Ultimately, transcription frequency and duration depend on the active state of promoters, binding of sequence‐specific transcription factors and local epigenetic states may modulate the transcription parameters (Donovan et al, 2019; Rodriguez & Larson, 2020). Histone acetylation modulates the burst frequency of mammalian genes (Nicolas et al, 2018; Chen et al, 2019). However, the interplay between chromatin‐based promoter regulation, transcription initiation kinetics, and DNC remains largely unclear.
In this study, we identify Hda1C as a key factor in the selective repression of DNC transcription. We utilize high‐throughput genetic screens based on quantitative single‐cell biology methods to characterize the effects of all non‐essential genes on DNC. Live‐cell single‐molecule imaging suggests that DNCs are transcribed constitutively rather than in bursts. Hda1C repression of DNC transcription correlates with reduced DNC initiation frequency and deacetylation of H3. Overall, Hda1C limits DNC transcription genome‐wide, presumably by restricting the frequency of transcription initiation in the non‐coding direction of promoter NDRs.
Results
Genetic screens identify Hda1C and SAGA as regulators of DNC transcription
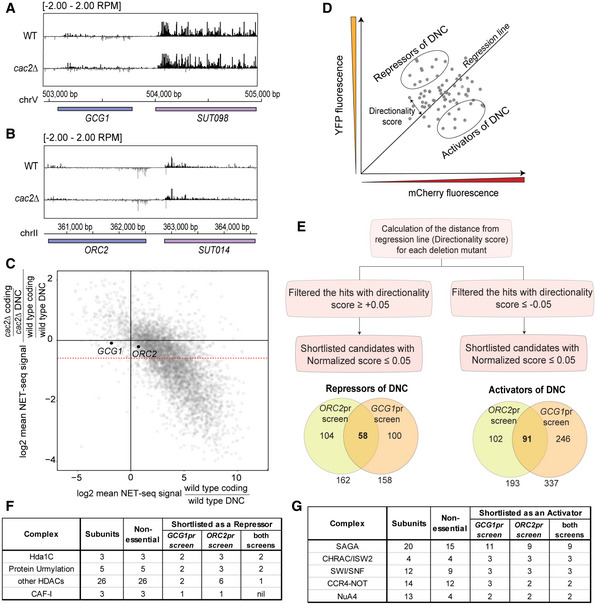
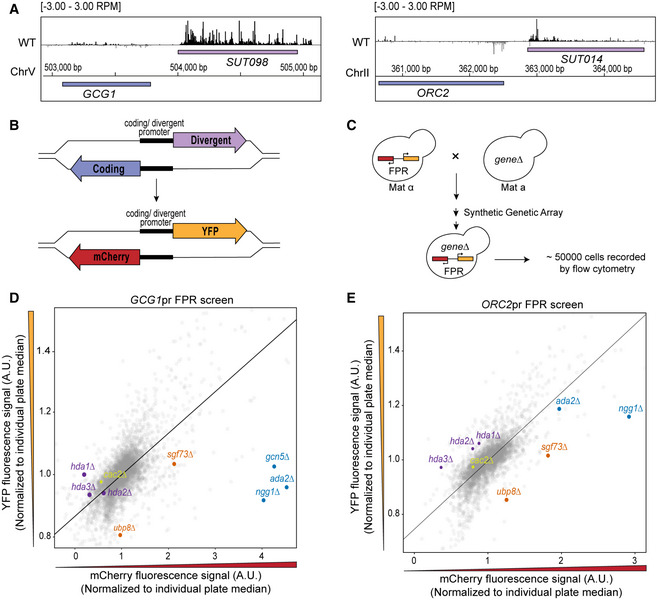
To identify DNC regulation, we focused on the GCG1/SUT098 and ORC2/SUT014 DNC loci. These loci are characterized by high levels of DNC transcription and show a low expression fold change in mutants of CAF‐I that increase DNC at many loci in the genome (Data ref: Marquardt et al, 2014b) (Fig EV1A–C). Native elongating transcript sequencing (NET‐seq) data reveal higher nascent transcription levels in the non‐coding direction than the protein‐coding gene at these loci in wild type (WT) (Fig 1A) (Data refs: Churchman & Weissman, 2011b; Marquardt et al, 2014b; Harlen et al, 2016; Fischl et al, 2017). We created fluorescent protein reporters (FPRs) where the coding and DNC sequences of the GCG1 and ORC2 promoter region are replaced with mCherry and yellow fluorescent protein (YFP) sequences to estimate transcriptional activity in each direction (Fig 1B). The resulting strains with the FPR inserted in the non‐essential PPT1/SUT129 locus are compatible with high‐throughput reverse synthetic genetic array (SGA) technology (Baryshnikova et al, 2010; Marquardt et al, 2014a). We crossed FPR strains with the library of non‐essential gene deletion mutants (Winzeler et al, 1999) to perform SGA. The resulting haploid strains harbor the FPR and a specific gene deletion arrayed in microtiter plates. We quantified mCherry and YFP for up to 50,000 single cells for each non‐essential gene deletion for robust phenotyping by high‐throughput flow cytometry (Fig 1C). The observations were regarded as biological events with one technical repeat for each screen. Later, we processed the median value for mCherry and YFP fluorescence to plot and compare the effects of individual non‐essential gene deletions. We performed two key analyses to identify potential DNC regulators. First, we calculated the directionality score for every mutant in each of the two genetic screens (Dataset EV1). The directionality score captures the distance of a data point from the plate regression line (Fig EV1D). We categorized the mutants above the regression line with a positive directionality score as repressors of DNC transcription since we expect increased DNC levels in the mutants. Conversely, we categorized those below the regression line with negative scores as activators of DNC transcription (Fig EV1D). Second, we focused our analysis on hits shared between the two screens. Here, we compared the overlap of mutants with a statistically significant directionality score in the individual screens (Fig EV1E, Dataset EV2). This analysis identified the two major subunits of Hda1C, hda1∆ and hda3∆, above the regression line in both the screens (Fig 1D and E). In addition, hda2∆ scored as a hit for the ORC2pr screen, but not for the GCG1pr screen, highlighting all three Hda1C subunits. Mutants of other HDACs and factors linked to protein urmylation scored as repressors as well (Fig EV1F). Several mutations in the SAGA subunits such as ada2∆, ngg1∆, sgf73∆, and ubp8∆ clustered below the regression line, suggesting roles in DNC activation (Fig 1D and E). The analysis of the screen data also identified SWI/SNF subunits and ISW2 chromatin remodelers as activators (Fig EV1G). Since we identified most non‐essential subunits as common hits in two independent genetic screens, we considered the Hda1C and the SAGA histone acetylation complex as promising hits and potential regulators of DNC transcription.
Figure EV1. Selection of loci to find factors regulating divergent non‐coding (DNC) transcription and method of reporter screen data analysis.
-
A, BNET‐seq data (Data ref: Marquardt et al, 2014b) at the GCG1/SUT098 and ORC2/SUT014 genomic loci. The two tracks represent normalized signal values in WT and cac2∆. The black and gray signals represent the Watson and Crick strands, respectively.
-
CNET‐seq coding/non‐coding ratios in cac2∆ and WT. For each gene, the directionality was calculated as the ratio of coding to divergent non‐coding reads. The CAF‐I effect was measured as the ratio of directionality in the mutant divided by that in WT and plotted against the WT directionality using a log2 scale. Changes in the mutant appear as deviations from the zero value on the y‐axis. A 1.5‐fold cutoff marking (as defined by Marquardt et al, 2014a) CAF‐I‐affected loci is marked by a dashed red line. Highlighted in black are the GCG1 and ORC2 promoters unaffected by cac2∆.
-
DSchematic illustration of data from a reporter screen. Plotting the median YFP versus mCherry fluorescent signal results in a scattered distribution of data points each representing a deletion mutant. The regression line distinguishes mutants favoring divergent or coding transcription. The directionality score is proportional to the distance from each data point to the regression line. Mutants favoring DNC transcription (i.e., with positive directionality values) are the repressors of DNC. Mutants favoring coding transcription (found below the regression line) are the activators of DNC.
-
EDepiction of flow cytometric data analysis. Calculation of directionality scores from individual reporter screens allowed in the classification of mutants as repressors and activators of DNC (Dataset EV2). The Venn diagram represents the number of shortlisted candidate repressors and activators in each screen.
-
F, GList of protein complexes shortlisted in the genetic screens. The table summarizes the number of subunits of the complexes and the non‐essential subunits found in the individual genetic screens.
Figure 1. Identification of factors regulating divergent non‐coding (DNC) transcription by a synthetic genetic array (SGA) and flow cytometric analysis.
-
ANET‐seq data of wild‐type (WT) yeast at the GCG1/SUT098 and ORC2/SUT014 loci. NET‐seq reads in black and gray represent the Watson (+) and Crick (−) strands, respectively. The NET‐seq track combines remapped data from previous publications (see Material and Methods for more details).
-
BSchematic representation of a shared promoter region initiating a coding (blue) and a DNC (purple) transcript in the opposite orientation. Fluorescent protein reporter (FPR) construction replaces the endogenous coding and DNC genomic regions with sequences encoding mCherry and YFP, respectively.
-
CSGA and flow cytometric analysis in budding yeast. The array involves the crossing of MATα query strain harboring the FPR construct with the MATa non‐essential gene deletion mutant library. The systematic selection as described in Baryshnikova et al, 2010, results in haploids containing the gene deletion and FPR. Quantification of the resultant haploids by high‐throughput flow cytometry records fluorescent signals in up to 50,000 cells for each gene deletion mutant.
-
D, EScatterplot visualization of YFP vs mCherry fluorescent signals in the GCG1 and ORC2 promoter FPR screens. Each data point represents the median signal of a deletion mutant normalized to individual plate median. Highlighted data points represent the mutants of Hda1C (purple), SAGA acetylation module (blue), SAGA deubiquitination module (orange), and cac2∆ (yellow). The regression line is marked in black. The mutants favoring DNC transcription are found above the regression line. The mutants favoring coding transcription are below the regression line. Technical repeat = 1, biological observations = 50,000 individual cells before filtering.
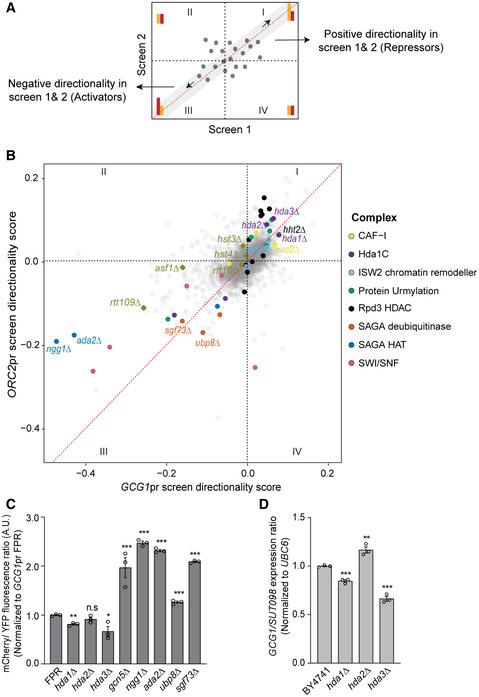
To evaluate shared hits between both screens systematically, we asked whether the combined analysis of the screen data identifies other protein complexes. We plotted the directionality scores of each mutant calculated from the two reporter screens to visualize the clustering of mutants with similar attributes. A two‐dimensional scatterplot of the directionality score distributes the data points representing gene deletions in four quadrants. We expected the mutants with strong positive or negative directionality scores in both the screens to cluster in quadrants I and III, respectively (Fig 2A). Mutants with high reproducibility between the screens appear closer to the diagonal and those with high directionality score away from the origin. In quadrant I, we observed the Hda1C mutants as strong hits (Fig 2B). We also discovered the majority of non‐essential subunits of protein urmylation, Rpd3 histone deacetylation, CAF‐I, and histones in quadrant I, highlighting their role in DNC repression. In quadrant III, we identify the mutants of the SWI/SNF and ISW2 chromatin remodelers alongside the SAGA complex (Fig 2B). In summary, our high‐throughput reverse genetic screens were able to resolve protein complexes likely contributing to the regulation of DNC transcription.
Figure 2. The reverse genetic screening approach identifies several novel protein complexes with a potential role in the regulation of divergent non‐coding (DNC) transcription.
-
AIllustration of the expected distribution of data points combined from independent genetic reporter screens. Each data point represents the directionality score of a deletion mutant. Mutants altering directionality positively by increasing divergent YFP levels are expected to be found in quadrant I. Mutants decreasing YFP with negative directionality scores are found in quadrant III. Data points closer to the diagonal (gray region) have high reproducibility between the screens.
-
BDistribution of mutants by directionality scores from the GCG1pr and ORC2pr genetic screens. Quadrants I and III reveal the non‐essential mutant subunits of several protein complexes (highlighted in colors) and mutants involved in CAF‐I pathway (square data points) altering the directionality. The top candidate repressors and activators of DNC are labeled.
-
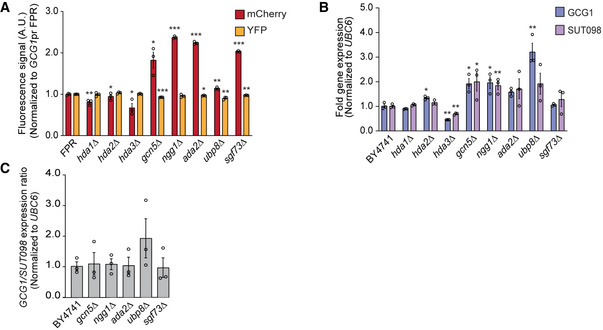
CFlow cytometric quantification of mCherry/YFP fluorescence in the mutants with GCG1pr FPR background. The data are normalized to the signal values of the wild‐type (FPR) strain.
-
DEndogenous transcript analysis by RT–qPCR in the mutants. The bars represent fold gene expression ratio of coding and divergent transcript normalized to the expression of the reference gene, UBC6.
Data information: (C, D) The error bars represent SEM calculated for biological triplicates with three technical repeats. Unpaired two‐tailed Student’s t‐test analysis shows the statistical significance of mutants compared with the respective wild type. *, **, ***, and n.s. denote P‐values < 0.05, < 0.01, < 0.001, and non‐significance, respectively.
Hda1 and Hda3 repress endogenous DNC transcription
We selected the GCG1/SUT098 locus for further validation of the top candidate regulators from the reporter screen. First, we performed an independent transformation of gene deletions into the GCG1pr FPR background to validate the effect. To normalize for the general transcription effect of the mutants and promoter‐specific effects on the directionality, we quantified the coding/DNC signal ratios. Quantification of mCherry/YFP fluorescence confirmed that the hda1∆ and hda3∆ mutants significantly reduced the fluorescence ratio, and the SAGA mutants increased the ratio (Fig 2C). These data are consistent with the data from the high‐throughput reverse genetic screen, where Hda1C and SAGA scored on opposite sides. Second, to test the effect of the mutants on endogenous transcription, we quantified the expression of GCG1 and SUT098 transcripts by RT–qPCR. The hda1∆ and hda3∆ mutants significantly decreased the GCG1/SUT098 ratio (Fig 2D) validating our findings. However, the SAGA mutants failed to increase the ratio at the endogenous level (Fig EV2A–C). We thus pursued the effects of Hda1 and Hda3 on DNC transcription.
Figure EV2. Quantification of coding and divergent non‐coding (DNC) transcripts in candidate mutants.
-
AThe fluorescent mCherry and YFP protein signals quantified by flow cytometric data analysis with the GCG1pr FPR construct. The individual signal values were normalized to the FPR signal values.
-
BEndogenous levels of the coding GCG1 and the divergent SUT098 transcript as measured by RT–qPCR. The fold gene expression values were normalized with the UBC6 reference gene expression.
-
CRatio of endogenous coding versus the DNC transcript fold gene expression at the GCG1/SUT098 locus.
Data information: (A–C) The data include values from at least three biological and technical repeats, and the error bars represent SEM. Unpaired two‐tailed Student’s t‐test analysis shows the statistical significance of mutants compared with the respective wild type. The asterisks *, **, and *** represent P‐values < 0.05, < 0.01, and < 0.001, respectively.
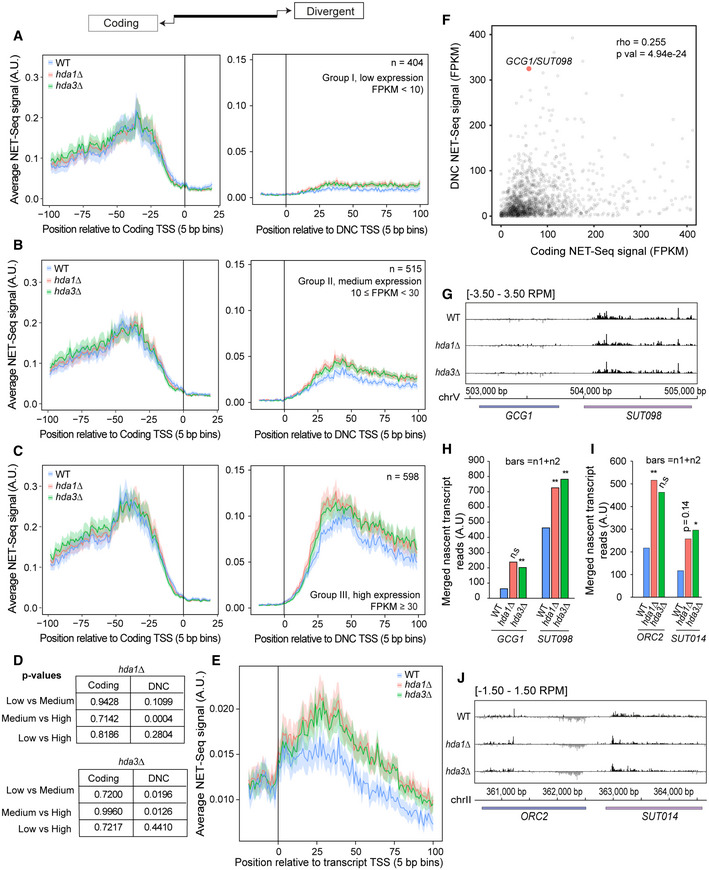
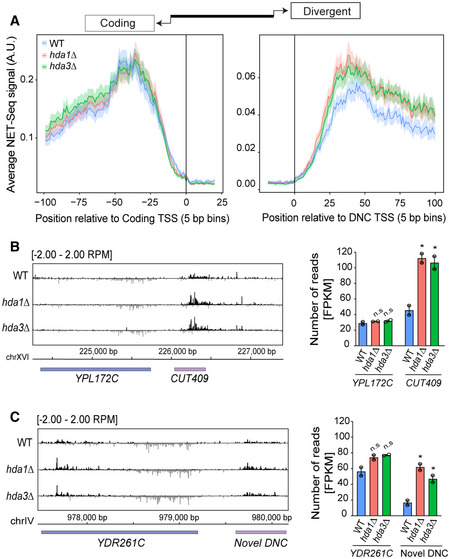
We next asked whether the two subunits of Hda1C repress DNC transcription genome‐wide. To address this question, we performed NET‐seq in the WT, hda1∆, and hda3∆ strains. To generate a systematic computational analysis, we first addressed the limited annotation of non‐coding transcripts in the Saccharomyces Genome Database (SGD). We called novel DNC transcripts through an annotation algorithm incorporating NET‐seq, Direct RNA‐seq, CAGE‐seq, and 3' READS data (see Materials and Methods). We identified 3,736 novel non‐coding transcripts in total, of which 1,517 represent DNC transcripts that originate from the same NDR as the corresponding mRNA in the pair (Dataset EV3). Among the identified DNC transcripts, 683 correspond to known CUTs or SUTs, whereas the other 834 were called de novo. The transcription in coding and divergent direction shows a positive correlation (Fig EV3F). Importantly, the metagene analysis of DNC loci revealed increased DNC levels in both hda1∆ and hda3∆ mutants compared with the WT signal (Fig 3A). These data are thus consistent with Hda1C as a genome‐wide repressor of DNC. Since we identified the effect of Hda1C through SUT098 expression, which represents a highly expressed DNC, we next analyzed whether the Hda1C effect may be determined by the DNC expression level. To this end, we classified the DNC loci into three groups based on their level of nascent transcription. We found that Hda1C mutants increased DNC transcription irrespective of the expression levels (Fig EV3A–C). Interestingly, the Hda1C mutants increased nascent DNC without a detectable effect in the direction of protein‐coding transcription. A comparison of DNC transcripts with different expression strengths (Fig EV3D) indicated hda1∆ increased expression of moderately expressed DNC transcripts more than highly expressed DNC transcripts, whereas hda3∆ increased expression of the low and moderately expressed DNC transcripts. Quantification of NET‐seq reads at non‐coding transcript regions that fell outside of our DNC classification appeared slightly elevated, but did not show a significant increase in Hda1C mutants compared with the WT (Fig EV3E). We quantified the mutant and WT NET‐seq signal at a locus with an annotated DNC transcript, YPL172C/CUT409 (Fig 3B), and a locus with a DNC transcript identified through our analyses at YDR261C (Fig 3C) and detected increased DNC transcription at both loci in Hda1C mutants. The Hda1C mutants also increased DNC transcription at GCG1 and ORC2 (Fig EV3G–J). In conclusion, the nascent transcriptome analyses supported the conclusion that Hda1 and Hda3 repress DNC transcripts with wide‐ranging expression strengths genome‐wide.
Figure EV3. NET‐seq data supporting the Hda1C effect on global nascent DNC transcription as shown in Fig 3.
-
A–CMetagene analysis of NET‐seq signal in wild‐type (WT), hda1∆, and hda3∆ yeast strains stratified by the DNC expression level. The genomic intervals were centered at the TSS of the coding gene (left panel) and the DNC transcript (right panel). (A) Loci with low DNC expression (FPKM < 10), n = 404. (B) Loci with medium DNC expression (10 ≤ FPKM < 30), n = 515. (C) Loci with high DNC expression (FPKM ≥ 30), n = 598.
-
DThe P‐values for fold change between differentially expressed transcripts by the Mann–Whitney test. Normalized NET‐seq signal in defined windows of coding and DNC transcripts were quantified from different samples to determine the fold change values. The statistical test shows the significance between differentially expressed transcripts in the mutants compared with WT.
-
EMetagene plot of NET‐seq data for non‐coding transcripts that are not classified as DNC in WT, hda1∆, and hda3∆. The plot shows genomic windows [TSS −100 bp, TSS + 500 bp] relative to the annotated transcript start site (TSS) of ncRNA transcripts.
-
FScatterplot of NET‐seq data for DNC/ host gene pairs. Each data point represents a gene promoter NDR with values representing NET‐seq data in each direction. Spearman's correlation test value rho = 0.255 and P‐value = 4.93e‐24.
-
GNET‐seq data track at the GCG1/SUT098 locus. The track represents normalized signal values in WT, hda1∆, and hda3∆. The black and gray signals represent the Watson and Crick strands, respectively.
-
H, IBar graphs representing merged nascent NET‐seq transcript reads of two biological replicates (n1 + n2) for the coding and DNC transcript at GCG1/SUT098 and ORC2/SUT014 loci (quantified in 250‐bp windows downstream from TSS) in each strain. Statistical significance of mutant transcript expression was compared with WT assessed by Fisher’s exact test. The test shows that the number of reads produced at the quantified window (relative to the total number of reads) differs in the mutant compared with WT. The *, **, and n.s. indicate P‐value < 0.05, < 0.01, and non‐significance, respectively.
-
JNET‐seq data track at the ORC2/SUT014 locus. The track represents normalized signal values in WT, hda1∆, and hda3∆. The black and gray signals represent the Watson and Crick strands, respectively.
Figure 3. NET‐seq identifies the genome‐wide effect of Hda1C on nascent divergent non‐coding (DNC) transcription.
-
AMetagene analysis of NET‐seq signal at all DNC loci (n = 1,517). The genomic intervals were centered at the transcription start site (TSS) of either protein‐coding gene (left panel) or DNC transcript (right panel).
-
BNET‐seq data at the YPL172C locus. The signal represents NET‐seq reads showing nascent transcription at the genomic position of the divergent non‐coding strand (black) and the coding strand (gray). The bar graph depicts NET‐seq reads as FPKM values for the coding and DNC transcript in the strains.
-
CNET‐seq data at the YDR261C locus with a novel DNC transcript. Annotations as in (B).
Data information: (B, C) Error bars represent SEM. Statistical significance of mutant transcript expression as compared to WT was assessed by unpaired two‐tailed Student’s t‐test for two biological NET‐seq replicates. The * and n.s. indicate P‐value < 0.05 and non‐significance, respectively.
Hda3 alters the frequency of DNC transcription at the GCG1/SUT098 locus
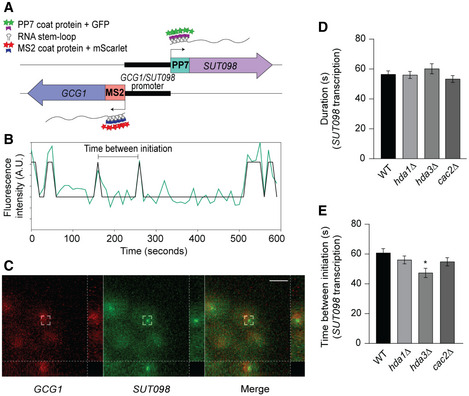
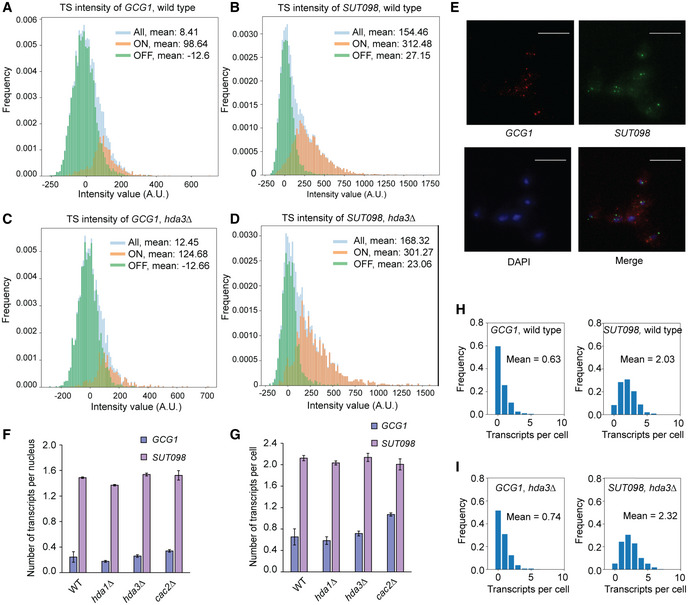
To investigate the molecular mechanisms of DNC repression by Hda1C, we utilized the MS2/PP7 RNA‐aptamer‐based system to monitor live transcription at the GCG1/SUT098 locus. We inserted stem–loop repeat sequences in the 5’‐UTR of the endogenous genomic transcript sequences, 12xMS2 for GCG1 and 14xPP7 for SUT098 (Fig 4A). The orthogonal expression of the fluorescently tagged MS2‐mScarlet and PP7‐GFP coat proteins enabled the visualization of transcription in real time as described previously (Lenstra & Larson, 2016). We recorded transcription over time for 130 cells on average to quantify the transcription parameters, namely duration and frequency of transcription initiation (Fig 4B). The live‐cell imaging revealed rare transcription initiation events in the coding direction (i.e., GCG1) and higher expression for the divergent SUT098 transcript (Figs 4C and EV4A–D). The relatively stronger transcription of SUT098 compared with GCG1 was consistent with the transcript counts in the nucleus and whole‐cell by single‐molecule fluorescence in situ hybridization (smFISH) (Fig EV4E–I) and the high DNC level detected in NET‐seq data (Fig 1A). The signals for GCG1 and SUT098 resembled Poisson distributions, supporting constitutive expression rather than transcriptional bursting (Fig EV4A–D). The constitutive expression of SUT098 is consistent with measurements of the GAL10 ncRNA that is also transcribed constitutively (Lenstra et al, 2015). The rare transcriptional initiation of GCG1 precluded an in‐depth analysis of transcription kinetics. Although higher than GCG1, the transcriptional activity of SUT098 is still low, which may also explain the lack of significant increase in SUT098 transcript in the mutants by smFISH analysis. We thus restricted our studies on the quantification of the SUT098 live‐cell imaging data for the characterization of mutants. We compared the duration of transcription in WT, the Hda1C mutants, and the CAF‐I mutant cac2Δ (Fig 4D). Our analyses identified no difference in transcription duration between the mutants and WT. Since these are individual transcripts, a similar transcription duration indicates that Hda1C does not affect the transcription elongation rate, but perhaps the initiation rate. Indeed, the hda3∆ mutant significantly decreased the time between transcription events, thus increasing the frequency of DNC transcription initiation (Fig 4E). Although not statistically significant, we note that the data indicated the same trend toward an increase in DNC transcription frequency in hda1Δ and cac2Δ. In summary, the live‐cell imaging data suggested that increased DNC in the hda3∆ mutant may result from increased transcriptional initiation frequency.
Figure 4. Single‐molecule live‐cell imaging reveals hda3∆ altering SUT098 transcription frequency.
-
ASchematic representation of MS2/PP7 stem–loop repeats at the 5’‐UTR of GCG1/SUT098 sequence. Upon transcription, respective coat proteins (dark blue and dark purple) with fluorescent proteins (red and green) bind to the MS2/PP7 repeats at the 5’‐UTR of GCG1 and SUT098 transcript. The ON and OFF state of transcription versus the time determines the duration and frequency (time between transcription events) of transcription.
-
BAn example trace of SUT098 transcript fluorescence quantified at the transcription site in a single cell (wild type). The track shows an overlay of the raw trace (green) with the binarized trace (black). The binarized peaks represent transcription initiation.
-
CA representative image of transcription initiation observed as fluorescent spots in the recorded live‐cell movie of wild‐type strain. The movie output using Python was analyzed, and the snapshot was obtained using ImageJ software. The red and green channels denote GCG1 and SUT098 transcript initiation, respectively. Images represent maximum intensity projections, and the right and bottom sidebars indicate side views in the yz and xz directions, respectively. Scale bar: 5 µm.
-
D, EQuantification of transcription dynamics by the duration and frequency (time between initiation) of transcription. Bar graphs show the transcription parameters of SUT098 in candidate mutants compared with the wild‐type strain. The error bars represent SEM calculated by live‐cell image analysis of 179, 135, 60, and 129 single‐cell biological repeats for WT, hda1∆, hda3∆, and cac2∆ strains, respectively. Statistical significance was calculated by random sampling with the replacement method using a bootstrapping algorithm in Python (the asterisk * denotes P‐value < 0.05).
Figure EV4. Live‐cell imaging data analysis and quantification of transcripts at the GCG1/SUT098 locus by single‐molecule fluorescence in situ hybridization (smFISH).
-
A, BIntensity of GCG1 and SUT098 transcript at the transcription site (TS) by live‐cell imaging in wild‐type cells. The y‐axis frequency indicates the percentage of frames recorded for TS. The bars represent transcription intensity in all the frames recorded (blue), with active transcription (ON, orange) and without TS (OFF, green).
-
C, DIntensity of GCG1 and SUT098 transcripts at the transcription site (TS) by live‐cell imaging in hda3∆ cells. The y‐axis frequency indicates the percentage of frames recorded for TS. The bars represent transcription intensity in all the frames recorded (blue), with active transcription (ON, orange) and without TS (OFF, green).
-
ERepresentative image of the GCG1 and SUT098 transcripts in wild‐type strain, by smFISH. The channels show wide‐field images of fixed haploid cells. The image output from a customized Python pipeline was used, and a snapshot was captured using ImageJ software. The blue is DAPI, and red and green dots are the GCG1 and SUT098 transcripts, respectively. The scale bar is 10 µm.
-
FAverage count of the GCG1 and SUT098 transcripts in the nucleus by smFISH.
-
GWhole‐cell count of the GCG1 and SUT098 transcripts by smFISH.
-
H, IRepresentative histogram of the number of transcripts per cell in a wild‐type (n = 1,409) and hda3∆ (n = 1,593) replicate. The bars indicate the frequency of the transcripts per cell. The mean transcript number and the number of cells analyzed are indicated inside the panels.
Data information: (F, G) The data contain at least three technical repeats with a minimum cell count of 150 in each replicate. The data analysis and representation include the cells without any transcripts to account for the loss of transcription initiation. The error bars represent SEM.
Hda1 affects H3 acetylation at DNC loci and acts independently of the H3K56 pathway
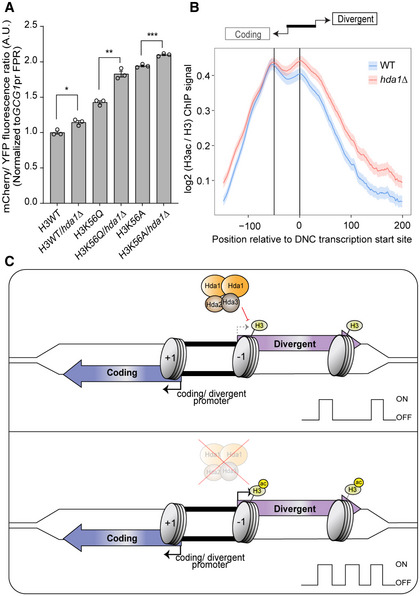
We next focused on links between histone acetylation and the repression of DNC transcription by Hda1C. The H3K56ac pathway contributes to DNC repression (Marquardt et al, 2014a). We performed a genetic epistasis analysis to test whether the effect of Hda1C on DNC could be explained through H3K56ac. Point mutations in H3K56 from lysine (K) to alanine (A) or glutamine (Q) affect DNC transcription (Marquardt et al, 2014a; Rege et al, 2015). The H3K56 substitution mutant Q is expected to mimic the acetylation state, and A is devoid of post‐translational modifications. H3K56ac participates in the incorporation and eviction of −1 nucleosomes (Marquardt et al, 2014a). Mutations affecting H3K56 can thus result in reduced −1 nucleosome density and more DNC through reducing incorporation or enhancing eviction. Note that hda1∆ increased the mCherry/YFP ratio in the isogenic control reference background (i.e., H3WT) of the yeast synthetic histone mutant collection compared with the BY4741 WT. If the effects of Hda1C were explained by H3K56ac, we would expect the same effect on DNC transcription in H3K56/hda double mutants as in the single mutants. We detected an increased ratio of mCherry/YFP fluorescence of the GCG1pr FPR in K56Q, K56A, and H3WT/hda1∆ (Figs 5A and EV5C). Importantly, the fluorescence ratio was further increased in H3 K56Q/hda1∆ and K56A/hda1∆ double‐mutant combinations compared with the single mutants. These data thus revealed an additive effect of the H3K56ac and hda1∆ pathways on DNC transcription, suggesting that H3K56ac and Hda1C make non‐overlapping contributions to DNC repression. This may be explained by the fact that Hda1C does not only deacetylate H3K56, but also other residues at H2B, H3 (Carmen et al, 1996), and H4 at active genes (Ha et al, 2019a). We therefore investigated H3 acetylation levels at DNC loci genome‐wide with ChIP‐seq in WT and hda1∆ (Fig EV5A and B) (Data ref: Ha et al, 2019b). To quantify the relative increase in H3 acetylation signal, we normalized the H3 acetylation signal to global H3 ChIP‐seq signal values. H3 acetylation increased in the DNC direction in hda1∆ compared with WT (Fig 5B). These data reinforce the view that increased transcription frequency and elevated nascent DNC transcription in the Hda1C mutants are linked to elevated histone acetylation.
Figure 5. Hda1 affects the H3 acetylation levels at divergent non‐coding (DNC) region independently from H3K56ac.
-
AFlow cytometric data analysis. Bars represent the mCherry/YFP fluorescence ratio of the respective yeast mutants normalized to the signal values of the H3 wild‐type FPR strain. The error bars show SEM calculated from biological triplicates with three technical repeats. Unpaired two‐tailed Student’s t‐test analysis indicates the statistical significance of the mutant compared with the respective wild type. The asterisks *, **, and *** indicate P‐values < 0.05, < 0.01, and < 0.001, respectively.
-
BMetagene profile of ChIP data (Data ref: Ha et al, 2019). The genomic intervals cover the first 500 bp of the coding gene (scaled to 100 bins), the first 1 kb of the DNC transcript (scaled to 200 bins), and the variable length gap between the coding TSS and the DNC TSS (scaled to 50 bins). The vertical lines represent transcription start site (TSS) of protein‐coding gene (left) and the DNC transcript (0 bin). The H3ac ChIP‐seq signal was normalized by the H3 signal in the same samples.
-
CWorking model of Hda1C repressing DNC. The coding (blue) and divergent (purple) transcript arise in opposing directions of a shared nucleosome‐free region (black). Nucleosomes (gray) comprise histones capable of modification by histone deacetylase 1 complex (Hda1C). In the normal state, Hda1C limits the frequency of DNC by deacetylating histones. With the loss of Hda1C function, increased acetylation of H3 favors DNC.
Figure EV5. Hda1C deacetylates H3 in divergent non‐coding (DNC) regions.
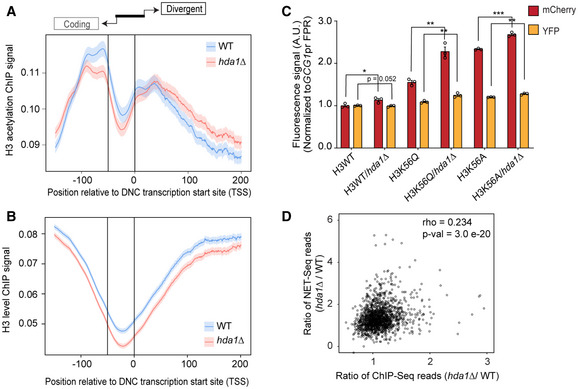
-
A, BMetagene profiles of H3 acetylation and H3 ChIP signal (Data ref: Ha et al, 2019) at DNC loci. The signal represents the (A) acetylation levels of H3 and (B) H3 levels. The genomic intervals cover the first 500 bp of the coding gene (scaled to 100 bins), the first 1 kb of the DNC transcript (scaled to 200 bins), and the variable length gap between the coding TSS and the DNC TSS (scaled to 50 bins). The vertical lines represent transcription start site (TSS) of protein‐coding gene (left) and the DNC transcript (0 bin).
-
CThe fluorescent mCherry and YFP protein signals quantified by flow cytometric data analysis in H3 WT background strain with the GCG1pr FPR construct. The individual signal values are normalized to the FPR signal values. The data include values from biological triplicates with three technical repeats, and the error bars represent SEM. Unpaired two‐tailed Student’s t‐test analysis shows the statistical significance of mutants compared with the respective WT. The asterisks *, **, and *** represent P‐values < 0.05, < 0.01, and < 0.001, respectively.
-
DScatterplot of hda1∆/ WT NET‐seq and ChIP‐seq ratio values. Each data point represents a gene promoter NDR with values representing the ratio. Spearman’s correlation test indicates rho = 0.234 and P‐value = 3.0e‐20.
Discussion
Previously, we identified a key contribution to H3K56ac‐mediated histone exchange in DNC transcription based on a genetic screen with the PPT1/SUT129 regulatory region. The incorporation of H3K56ac nucleosomes by the histone chaperone CAF‐I restricted DNC transcription (Marquardt et al, 2014a). Two main factors motivated new genetic screens: (i) We failed to resolve protein complexes necessary for DNC (i.e., activators), and (ii) our genome‐wide characterization of NET‐seq data in cac2∆ mutants suggested DNC regulation independent of the H3K56ac pathway.
We reasoned that loci with high DNC transcription levels should facilitate the detection of mutations reducing DNC transcription. Replacement of endogenous transcripts with mCherry/YFP offers the advantage of screening for regulation upstream of ncRNA repression by co‐transcriptional RNA degradation (Wyers et al, 2005; Neil et al, 2009; Van Dijk et al, 2011; Ntini et al, 2013), but some hits may be specific to the FPR. Consistently, we did not identify genes regulating DNC through transcriptional termination and co‐transcriptional RNA degradation. Our genetic screen resolved protein complexes as activators, for example, SAGA and ISW2, and confirmed the role of SWI/SNF (Marquardt et al, 2014a). The HAT activity of SAGA appeared particularly promising in light of the HDACs identified as repressors. However, we failed to validate reduced DNC transcription for the endogenous transcripts in activator mutants. While genome‐wide methods could possibly reveal a reduction in DNC transcription, we consider it likely that our screen failed to identify genuine activators of DNC. In addition to FPR‐specific effects, it is more likely that SAGA, SWI/SNF, and ISW2 protein complexes regulate the transcription of mRNAs rather than DNCs given previous reports (Hassan et al, 2001; Whitehouse et al, 2007; Baptista et al, 2017; Kubik et al, 2019), arguing against an unknown complex dedicated to promote DNC transcription specifically. Nevertheless, since we screened against a library of non‐essential gene deletion mutants, it remains possible that a protein complex essential for yeast viability could stimulate DNC transcription. Genome‐wide NET‐seq data support a weak yet statistically significant positive correlation of transcription in each direction (Fig EV3F). The directionality score represents a promising analysis strategy to identify mutations that bias transcription in one direction, since it utilizes information from both fluorophores to measure the deviations from the axis of positive correlation. Our computational analyses suggest DNC at about 28% of yeast genes, with 1,517 DNC transcripts compared with 5,544 expressed yeast genes (i.e., meta‐NET‐seq data, FPKM above 10). Even though DNC is frequent, yeast genes without evidence for DNC are thus in the majority. One explanation for a large number of genes without DNC may be reduced activities of elusive DNC activators. Alternatively, DNC transcription may result from NDR formation linked to mRNA expression as suggested by the transcriptional noise hypothesis (Struhl, 2007). However, locus‐specific repressor activity reduces DNC transcription, resulting in variations of DNC transcription genome‐wide. Our data thus suggest to extend the transcriptional noise hypothesis with activities limiting DNC transcription to account for genome‐wide variation in non‐coding transcription.
Our screens highlighted the role of Hda1C as a repressor of DNC transcription. In budding yeast, Hda1C comprises the Hda1, Hda2, and Hda3 subunits and has a distinct function from other HDACs (Wu et al, 2001). The loss of the catalytic subunit Hda1 or either of the two functional subunits disrupts the activity of the complex (Lee et al, 2009). We note that our analyses failed to identify the equivalent effects in all respective mutants; perhaps most notably a statistically significant increase in initiation frequency was limited to hda3∆. While the differences may be rooted in differential effects of the Hda1C components (Lee et al, 2021), we favor the hypothesis that some effects may be masked by experimental variation and the modest effect size. Hda1C selectively deacetylates histones H2B and H3 (Carmen et al, 1996). The acetylation states at lysine residues of histones are linked to transcription dynamics, which in turn control the gene expression (Wu et al, 2017). Hda1C activity is genetically separable from the H3K56ac‐linked DNC repression mediated by histone chaperones that involve the HST3/4 histone deacetylase acting on H3K56 (Marquardt et al, 2014a). The HST3/4 deacetylases involved in the CAF‐I pathway were not significant hits in our screens (Fig 2B), further supporting the independent effect of Hda1C. We detected clear histone acetylation signals at DNC loci (Fig 5B), consistent with the idea that HDACs may modulate DNC transcription (Churchman & Weissman, 2011a; Tan‐Wong et al, 2012). The DNC loci with increased nascent transcript signal also positively correlated with increased acetylation levels in hda1∆ (Fig EV5D), emphasizing the role of Hda1C. The additive genetic interaction between H3K56 and hda mutants supports a parallel contribution of both H3K56ac‐ and Hda1C‐mediated mechanisms to limit DNC transcription. We thus propose a model highlighting DNC repression by Hda1C through counteracting histone acetylation beyond H3K56ac (Fig 5C). In conclusion, histone acetylation emerges as a key chromatin‐based facilitator of DNC transcription.
In order to address the mechanism of DNC repression, we implemented live‐cell imaging. Since open chromatin at promoters is linked to histone acetylation (Barnes et al, 2019), the acetylation state may favor initiation from promoters (Dar et al, 2012). We identified a reduction in time between DNC transcription initiation events when Hda1C‐mediated histone deacetylation is impaired. Our data support a model where HDACs repress DNC transcription through a reduction in the frequency of transcription initiation (Fig 5C). We note that increased histone acetylation increases the transcription frequency also in mouse (Chen et al, 2019), perhaps indicating that histone acetylation may correlate with increased transcription frequency generally. Unfortunately, the rare GCG1 transcription initiation events at the GCG1/SUT098 promoter precluded a simultaneous comparative analysis of the effects of histone deacetylation in both transcriptional directions. Nevertheless, our results suggest that histone deacetylation by Hda1C limits DNC transcription through a reduction in transcriptional initiation frequency.
In conclusion, even though DNC transcription is frequent and occurs at high levels in the yeast genome (Xu et al, 2009), HDACs reduce DNC initiation frequency to maintain tolerable levels of pervasive transcription. Presumably, the advantages of harnessing the contributions of selected DNC transcription events for gene regulation outweigh the penalties of widespread DNC activity. Since no dedicated factors stimulating genome‐wide DNC could be identified thus far, we favor the idea that DNC transcription follows from promoter NDRs without the need for specific pathways activating DNC. The differences in DNC levels across yeast promoter NDRs thus likely result from DNC regulation through a series of parallel pathways for repression, including the control of initiation frequency by histone deacetylation, and through co‐transcriptional ncRNA degradation.
Materials and Methods
Reagents and Tools table
| Reagent/Resource | Reference or Source | Identifier or Catalog Number |
|---|---|---|
| Experimental Models | ||
| E. coli DH5α competent cells | ThermoFisher Scientific | Cat#18265017 |
| S. cerevisiae non‐essential gene deletion library | Winzeler et al, 1999 | PMID:10436161 |
| SGA background strain | Schuldiner et al, 2006 | PMID: 17101447 |
| Synthetic histone mutant strains | Dai et al, 2008 | PMID: 18805098 |
| Rpb3‐FLAG NET‐seq background strain | Churchman & Weissman, 2011a | PMID: 21248844 |
| Mutant yeast strains | This study | Table EV1 |
| Recombinant DNA | ||
| natMX6‐mCherry‐ PPT1/SUT129promoter‐YFP | Marquardt et al, 2014a | PMID: 24949978 |
| pAG32 | Goldstein & McCusker, 1999 | PMID: 10514571 |
| kanMX6 cassette | Bähler et al, 1998 | PMID: 9717240 |
| Plasmid vectors | This study | Table EV3 |
| Antibodies | ||
| Monoclonal ANTI‐FLAG® M2 antibody | Merck Sigma ‐Aldrich | F3165‐2MG |
| Oligonucleotides and sequence‐based reagents | ||
| PCR primers | This study | Table EV2 |
| smFISH probes | This study | Table EV2 |
| Chemicals, enzymes and other reagents | ||
| HotMaster Taq DNA Polymerase | VWR | QUNT2200330 |
| Phusion polymerase | NEB | M0530L |
| G418 sulphate | Abcam | ab144261 |
| Nourseothricin‐dihydrogen sulfate | WERNER BioAgents | Order no. 5.001.000 |
| Hygromycin B (50 mg/ml) | Invitrogen | 10687010 |
| Ampicillin sodium | Duchefa | A0104.0025 |
| Kanamycin | Duchefa | K0126.0025 |
| Restriction enzymes‐HF | NEB | Various |
| 3X FLAG Peptide | Apexbio | A6001 |
| DNase I | ThermoFisher Scientific | 18047019 |
| Ribonuclease inhibitor | Molox | |
| T4 Polynucleotide Kinase | NEB | M0201S |
| FACS Sheath Solution with Surfactant | BD (Becton Dickinson) | 336911 |
| DAPI, ProLong Gold | Life Technologies | P36931 |
| Software | ||
| CLC Main Work Bench 8.0 | Qiagen | |
| Python 3.9 | ||
| R 3.6.1 | ||
| R studio 1.3 | ||
| IGB 9.1.8 | BioViz | |
| IGV | Broad institute | |
| Micromanager | Zeiss | |
| Bioanalyser software | BioRad | |
| Image J 1.8.0 | Fiji | |
| FACSDiva | BD (Becton Dickinson) | |
| Other | ||
| E.Z.N.A.® Plasmid Mini Kit I, (V‐spin) | Omega BIO‐TEK | D6943‐02 |
| SuperScript™ IV Reverse Transcriptase | ThermoFisher Scientific | 18090050 |
| NEXTflex Small RNA‐Seq Kit v3 | Perkin Elmer | NOVA‐5132‐06 |
| Dynabeads™ Protein G for Immunoprecipitation | ThermoFisher Scientific | 10004D |
| Agencourt RNAclean XP beads | Beckman Coulter | A63987 |
| miRNeasy Mini Kit | Qiagen | 217004 |
| RNA Pico Chips | Agilent Technologies A/S | 5067‐1513 |
| Bioanalyzer High Sensitivity DNA Kit | Agilent Technologies A/S | 5067‐4626 |
| cOmplete protease inhibitor cocktail (EDTA free) | Roche | 5056489001 |
| Wizard® SV Gel and PCR Clean‐Up System | Promega | A9282 |
| sCMOS ORCA Flash | Hamamatsu | 4.0 V3 |
| Inverted wide‐field microscope | Zeiss | Zeiss Axio Observer 7 |
| LED illuminator | SpectraX, Lumencor | |
| LSR II flow cytometer | BD (Becton Dickinson) | |
| Mixer mill | Retsch | |
Methods and Protocols
Growth media
Yeast (S. cerevisiae)
Standard YPD liquid media or agar plates with 500 µg/ml G418 sulfate (Abcam) and/or 100 µg/ml clonNAT (Werner BioAgents) and/or 200 µg/ml hygromycin B (Invitrogen) were used to select for yeast strains with KanMX or NatMX or HphMX resistance. Synthetic complete drop‐out media (minus URA/ HIS/ LEU) were used to select for strains with an auxotrophic marker gene. Table EV1 lists all the yeast strains used in the study.
Bacteria (E. coli)
Standard LB liquid or agar plates with 100 µg/ml ampicillin or 50 µg/ml kanamycin were used to select cells harboring the plasmid vector with AmpR or KanR selection marker.
Cloning
GCG1pr and ORC2pr FPR constructs
The PPT1/SUT129 promoter present in SMC50 (Marquardt et al, 2014a) was replaced with the bidirectional GCG1/SUT098 or ORC2/SUT014 promoter sequence, using isothermal assembly reaction (Gibson et al, 2009). The FPR cassette comprising NatMX‐mCherry‐PPT1/SUT129 promoter‐YFP was excised from the backbone using AscI restriction enzyme (1 U per µg plasmid, NEB). Fragment I was the bidirectional GCG1/SUT098 or ORC2/SUT014 promoter sequences amplified by Phusion U polymerase from BY4741 genomic DNA. Fragments II and III were the YFP and mCherry sequences with complementary overhangs to the respective promoters (introduced by primer overhangs corresponding to about 20 base pairs of the bidirectional promoter; Table EV2) amplified from SMC50 plasmid (Table EV3). The three fragments were cleaned up using the Wizard® SV Gel and PCR Clean‐Up System (Promega) and subsequently fused by overlapping PCR. The fused product was ligated into the SMC50 vector backbone by the isothermal assembly reaction. The ligated plasmid was transformed into E. coli and sequenced. For transformation into yeast, the plasmid can be linearized with EcoRI and the plasmid integrates into the PPT1/SUT129 locus of the genome.
GCG1pr FPR cassette with KanMX resistance
The GCG1/SUT098 FPR plasmid was digested with AvrII and BglII (1 U per µg plasmid, NEB) restriction enzymes to excise the NatMX6 cassette. A KanMX6 cassette with overhangs complementary to the opened site of the backbone was amplified using Phusion U polymerase chain reaction and fused into the backbone by an isothermal assembly reaction.
Transformation
Yeast transformations were performed as described in Gietz and Schiestl (2007) with minor changes. For each transformation, a cell pellet collected from 5 ml of 0.5–0.8 OD600 liquid culture was washed 2× in sterile water and 1× in sterile 100 mM lithium acetate. The cells were resuspended in 74 µl of 1–2 µg of PCR amplicon or 100–500 ng of plasmid or 1 µg of the linearized plasmid. A sterile transformation mix consisting of 240 µl 50% w/v PEG 3350, 36 µl 1 M lithium acetate, and 10 µl sheared salmon sperm DNA (10 mg/ml) was added to the tube. The contents were vortexed briefly and incubated for 30 min at RT (with frequent mixing), and heat‐shocked for 20 min at 42°C in a heat block. The transformed cells were collected and washed 1× with sterile water. For selection with auxotrophic marker, the transformed cells were plated directly on synthetic drop‐out media. For selection with antibiotic markers, the cells were plated on plain YPD and replica plated onto selection media the next day or plated directly on selection media after 3–4 h of recovery in 1 ml of fresh YPD at 30°C at 200 rpm.
Synthetic genetic array (SGA)
Query strains (MATα) harboring ORC2pr FPR construct (SMY2312) or GCG1pr FPR (SMY2314) were crossed with the yeast non‐essential gene deletion library (MATa) as described in Baryshnikova et al (2010) to perform the reverse genetic screen. The resultant MATa haploid cells from SGA on 384‐well plates were quantified for fluorescence in the flow cytometer.
Flow cytometry
Quantification of mCherry and YFP fluorescent signal was done using an LSR II flow cytometer from Becton Dickinson with a high‐throughput sampler. YFP was excited at 488 nm, and the emission was collected through a 545/35 band‐pass and 525 long‐pass emission filter. The mCherry was excited at 594 nm, and the fluorescence was collected through a 632/22 band‐pass filter. Fluorescent signal of 10,000 up to 50,000 individual cells was recorded for each well. The BD FACSDiva acquisition program was used to set up the flow settings, and the acquired data were exported in FCS 3.0 format.
RNA isolation
The total RNA from yeast cells was extracted using the phenol/chloroform method. Cells from 40 ml of 0.5–0.8 OD600 culture were collected, washed in 2 ml of sterile water, and resuspended in 400 µl of ice‐cold AE buffer (50 mM sodium acetate, pH 5.0, and 10 mM EDTA, pH 8.0). 50 µl of 10% SDS and 500 µl of fresh phenol/chloroform mixture (1:1) were added to the tubes, vortexed for 5 min with glass beads, and incubated at 65°C, 800 rpm for 10 min. The tubes were chilled on ice for 5 min and centrifuged at 4°C at high speed to separate the contents. The aqueous phase was collected and mixed with 500 µl of fresh phenol/chloroform mixture (1:1), vortexed for 10 min, and incubated at 65°C at 2000 rpm for 5 min. The tubes were chilled on ice for 10 min and centrifuged at 4°C at high speed to separate the contents. The aqueous phase was transferred to fresh tubes, mixed with 2.5 volume of cold 100% ethanol and 1/10 volume of 3 M sodium acetate, pH 5.3, and incubated at −20°C for 2 h. The tubes were centrifuged at 4°C to pellet the RNA. The RNA pellet was washed with 75% ethanol and air‐dried until complete removal of ethanol, and resuspended in 400 µl of RNase‐free water. The isolated RNA was quantified using a nanodrop.
qPCR
Total RNA from yeast cells was extracted using the standard hot phenol/chloroform method. The total RNA was treated with TURBO DNase (Thermo Fisher Scientific) following the protocol from the manufacturer. 1 µg of the DNase‐treated RNA was converted to cDNA with Superscript IV Reverse Transcriptase Kit (Invitrogen, USA) using gene‐specific primers based on the manufacturer’s instructions. Diluted cDNA (1:20) was used in a PCR with the GoTaq qPCR Master Mix (Promega) and run on a CFX384 Touch Instrument (Bio‐Rad).
qPCR analysis
The output data were exported to Microsoft Excel and analyzed. Quantification of the transcript expression relative to the UBC6 internal reference gene was performed using the ∆∆Ct method as described in Livak and Schmittgen (2001).
Native Elongating Transcript sequencing (NET‐seq)
Nascent RNA was immunoprecipitated from the wild‐type strain and the hda1Δ and hda3Δ mutants (two biological replicates for each genotype) using the previously published protocol (Churchman & Weissman, 2011a). The NET‐seq libraries were constructed using the Bioo Scientific Small RNA‐seq Kit v3 and the custom protocol from Kindgren et al (2020).
Harvesting and grinding of cells
One liter of mid‐log phase yeast cells was collected using vacuum filtration and immediately frozen in liquid nitrogen. All equipment used in handling the cells was pre‐cooled using liquid nitrogen. The frozen cell mass was powdered by grinding 10× at 15 Hz for 3 min in a Retsch Mixer Mill.
Quality check and Sequencing
The constructed libraries were validated using a High‐sensitivity DNA Kit (Agilent Technologies) in a Bioanalyzer as per the manufacturer’s instructions. The libraries were sequenced on Illumina NovaSeq 6000 in PE150 mode at Novogene (https://en.novogene.com/). 39–82 million reads were obtained for each of the sequenced libraries.
Data analysis
All supporting codes were deposited at https://github.com/Maxim‐Ivanov/Gowthaman_et_al_2021 and https://github.com/Uthra‐Gowthaman/Gowthaman‐et‐al_2021.
The FCS files were processed using the 05‐Load_flow_cytometry_data.R script, which is based on the flowCore library (Hahne et al, 2009). Only wells with at least 100 cells were considered valid. The forward‐scatter (FSC) and side‐scatter (SSC) values were used to filter out cell aggregates and odd‐shaped cells. For each valid well, the median YFP and mCherry fluorescent values were calculated from up to 50,000 individual cells. Hence, the median signal values of mutants in the genetic screen represent a robust and highly reproducible data. The directionality scores were calculated as the geometrical distance between the position of a well containing a specific mutant in the two‐dimensional space defined by mCherry and YFP fluorescence, and the regression line obtained from all wells on a given 384‐well plate. The values for each mutant are given in Dataset EV1. Scatterplots of the YFP and mCherry fluorescent values, as well as the directionality scores, were obtained using the ggplot2 library (see the 06‐Scatterplots.R script). The list of shortlisted candidate repressors and activators from both the genetic screens is shown in Dataset EV2. The dataset also provides a comprehensive list of shared hits between the screens.
The raw FASTQ files from the previously published NET‐seq studies and the current study were aligned to the yeast genome using the 01‐Remapping_published_NET‐seq_datasets.sh and 02‐Alignment_of_novel_yeast_NET‐seq_data.sh scripts, respectively. The ChIP‐seq BigWig files from the Ha et al (2019a) study were downloaded from NCBI GEO (Data ref: Ha et al, 2019b). The NET‐seq and ChIP‐seq metagene plots were produced by the 07‐Metagene_plots.R script.
To find all DNC transcripts in the yeast genome, we first updated the current SacCer3 gene annotation (downloaded from www.yeastgenome.org and supplemented with CUTs and SUTs from Xu et al (2009)) using the TranscriptomeReconstructoR package (https://github.com/Maxim‐Ivanov/TranscriptomeReconstructoR; Ivanov et al, 2021) and the following previously published datasets: (i) Direct RNA‐seq (Data ref: Garalde et al, 2018), (ii) CAGE‐seq (Data ref: Lu & Lin, 2019), (iii) 3' READS from (Data ref: Liu et al, 2017), and (iv) NET‐seq (Data refs: Churchman & Weissman, 2011b; Marquardt et al, 2014b; Harlen et al, 2016; Fischl et al, 2017). The borders of known genes were adjusted by the experimental evidence for TSS and PAS called from the CAGE‐seq and 3' READS data, respectively. In addition, 3,736 novel transcripts were called from the TSS, PAS, Direct RNA‐seq, and NET‐seq reads, which did not overlap with known genes on the same strand. This analysis can be reproduced using the 03‐Correct_and_expand_SacCer3_annotation.R script. In effect, we produced a novel gene annotation for S. cerevisiae, which can be downloaded as a BED file from the code repository.
This improved annotation was used to detect DNC loci, i.e., pairs of nuclear protein‐coding genes and non‐coding transcripts in divergent orientation with TSSs found within the same nucleosome‐free region (NFR) and separated by not more than 500 bp. The search for DNC loci was done using the 04‐Find_DNC_loci.R script using published MNase data (Data refs: Chereji et al, 2018 and Jiang & Pugh, 2009).
Single‐molecule fluorescence in situ hybridization (smFISH)
21 ml of OD600 0.5 cultures was fixed with 4 ml of 32% paraformaldehyde and incubated at RT for 20 min. The fixed cells were washed thrice with 10 ml of ice‐cold buffer B (1.2 M sorbitol, 100 mM potassium phosphate buffer, pH 7.5). The fixed cell pellet was resuspended in 0.5 ml of spheroplasting buffer (1.4× buffer B, 0.2% β‐mercaptoethanol, 200 mM vanadyl ribonucleoside complex, and 300 U lyticase) and incubated at 30°C for 5 min. The resultant spheroplasts were washed and resuspended in 1 ml of ice‐cold buffer B. 400 µl of the resuspended cells was spotted on poly‐L‐lysine‐coated coverslips and incubated at 4°C for 30 min for the cells to adhere onto coverslips. Later, the coverslips were washed with 2 ml of ice‐cold buffer B and incubated in 70% ethanol at −20°C, overnight. For hybridization, the coverslips were placed cell‐adhered side on 50 µl drop of hybridization solution (10% dextran sulfate, 10% formamide, and 2× saline–sodium citrate) containing probes labeled with Cy3 and Cy5 (complementary to 14× PP7 and 12× MS2 sequence, respectively, 2.5 µM; Table EV2). The coverslips were incubated in a sealed Parafilm chamber at 37°C for 4 h. After hybridization, the coverslips were washed once with pre‐warmed wash buffer (10% formamide, 2× SSC) for 30 min at 37°C, once with 2× SSC, and once with phosphate buffer saline for 5 min at RT. The rinsed coverslips were air‐dried and placed cell‐coated side over 15 µl of mounting media with DAPI (ProLong Gold, Life Technologies) on a clean microscope glass slide, and allowed to polymerize for at least 24 h in dark at RT.
Imaging
The cells were imaged using Zeiss Axio Observer 7 inverted wide‐field fluorescence microscope with LED illumination (SpectraX, Lumencor) and sCMOS ORCA Flash 4.0 V3 (Hamamatsu). A 40× oil objective lens (NA 1.4) with 1.6× Opto var was used. 13 z‐stacks were imaged from −3 to 3 µM with 0.5 µM steps and 1 × 1 binning. An exposure time of 250 ms was used to image Cy3, Cy5, and 25 ms for DAPI channels at 100, 100, and 20% LED power, respectively.
smFISH data analysis
Image quantification was carried out using a custom Python pipeline. Images were compressed to 2D images displaying the maximum intensity projection for each pixel across z‐stacks −3 to 3 µM. Cell and nuclear masks were determined using a custom Python algorithm. Spots corresponding to GCG1 or SUT098 transcripts were then counted for cells and nuclei. The transcription site (TS) was defined as the brightest spot in the nucleus and normalized to the median fluorescence intensity of cytoplasmic transcripts. For each sample, three replicate experiments were performed, and approx. 1,000–3,000 cells were counted per strain.
Single‐molecule live‐cell imaging
The protocol was followed as described in Brouwer et al (2020). Yeast cells grown to 0.02 OD600 were imaged. The live cells suspended in 4 µl of 2% SC glucose were spotted on a coverslip and immobilized by placing 2% agarose pads.
Imaging conditions
The live cells were imaged using a custom‐built microscope consisting of Zeiss Axio Observer 7 inverted wide‐field microscope, sCMOS ORCA Flash 4.0 V3 (Hamamatsu), incubator (Okolab) at 30°C, and LED illumination (SpectraX, Lumencor). A 100× oil objective lens (NA 1.46) with 1× Opto var and ND filter 1 was used. The images were recorded at 10‐s intervals for MS2‐GCG1 and PP7‐SUT098 with 60 time points, 9 z‐stacks (−2 to 2 µm) with 0.5 µm steps, 2 × 2 binning and 200‐ms exposure, and 30% LED power using micro‐manager software.
Live‐cell image analysis
Maximum intensity projections of the recorded images were computed using ImageJ Fiji software. A custom‐made Python algorithm from Lenstra Lab was used to determine the intensity of the transcription site (TS) for each channel. The algorithm fits a 2D Gaussian mask after local background subtraction and marks the cell boundaries. It tracks the TS overtime in the recorded movies, and the output data were manually checked for proper localization of tracking. To determine the on and off periods, a threshold was applied to background‐subtracted traces of eight times the standard deviations of the background (for SUT098 transcript). This number was chosen to reliably distinguish on and off periods from background levels at the single transcript level. For wild type, hda1∆, hda3∆, and cac2∆ strains, 179, 135, 60, and 129 individual cells, respectively, were analyzed from movie frames. The movies were recorded in different days, and the data were pooled for better statistics.
Author contributions
SM and UG conceived the project with input from all the authors. UG, IS, and NAM performed the experiments. MI, UG, and DG‐P optimized NET‐seq protocol. UG, NAM, IS, and DGP engineered yeast strains. UG and HPP performed the single‐molecule imaging. MI performed the computational analysis of sequencing data and reporter screen. UG, TLL, and HPP analyzed and interpreted the single‐molecule data. UG and SM wrote the manuscript with input from all the authors.
Conflict of interest
The authors declare that they have no conflict of interest.
Supporting information
Expanded View Figures PDF
Table EV1
Table EV2
Table EV3
Dataset EV1
Dataset EV2
Dataset EV3
Acknowledgements
We thank the members of Marquardt Lab and Lenstra Lab for discussions and technical assistance. S.M acknowledges funding from the Novo Nordisk Foundation NNF15OC0014202, NNF19OC0057485, a Copenhagen Plant Science Centre Young Investigator Starting grant, and EMBO YIP. This project received support from the European Research Council (ERC) under the European Union’s Horizon 2020 Research and Innovation Programme StG2017‐757411 and StG2017‐755695 (T.L.L), the Netherlands Organisation for Scientific Research (NWO, gravitation program CancerGenomiCs.nl, T.L.L.), and Oncode Institute (T.L.L.), which is partly financed by the Dutch Cancer Society. U.G was supported by the European Molecular Biology Organization Short‐Term Fellowship (STF‐8335) to perform single‐molecule studies at the Lenstra Lab.
The EMBO Journal (2021) 40: e108903.
Data availability
The datasets produced and programming scripts used in this study are available in the public databases.
The flow cytometric data of the genetic screens are deposited at FlowRepository (https://flowrepository.org/), with accession numbers FR‐FCM‐Z3W4 for the GCG1pr screen, and FR‐FCM‐Z3W5 for the ORC2pr screen.
NET‐seq data of the strains are deposited at GEO with the number GSE167499.
Supporting code for flow cytometric data analysis, sequencing data analysis was deposited at https://github.com/Maxim‐Ivanov/Gowthaman_et_al_2021 and https://github.com/Uthra‐Gowthaman/Gowthaman‐et‐al_2021.
The scripts used to analyze live‐cell imaging and smFISH images are available at github.com/lenstralab.
References
- Alcid EA, Tsukiyama T (2014) ATP‐dependent chromatin remodeling shapes the long noncoding RNA landscape. Genes Dev 28: 2348–2360 [DOI] [PMC free article] [PubMed] [Google Scholar]
- Almada AE, Wu X, Kriz AJ, Burge CB, Sharp PA (2013) Promoter directionality is controlled by U1 snRNP and polyadenylation signals. Nature 499: 360–363 [DOI] [PMC free article] [PubMed] [Google Scholar]
- Bähler J, Wu JQ, Longtine MS, Shah NG, Mckenzie A III, Steever AB, Wach A, Philippsen P, Pringle JR (1998) Heterologous modules for efficient and versatile PCR‐based gene targeting in Schizosaccharomyces pombe . Yeast 14: 943–951 [DOI] [PubMed] [Google Scholar]
- Baptista T, Grünberg S, Minoungou N, Koster MJE, Timmers HTM, Hahn S, Devys D, Tora L (2017) SAGA is a general cofactor for RNA polymerase II transcription. Mol Cell 68: 130–143 [DOI] [PMC free article] [PubMed] [Google Scholar]
- Barnes CE, English DM, Cowley SM (2019) Acetylation and Co: an expanding repertoire of histone acylations regulates chromatin and transcription. Essays Biochem 63: 97–107 [DOI] [PMC free article] [PubMed] [Google Scholar]
- Baryshnikova A, Costanzo M, Dixon S, Vizeacoumar FJ, Myers CL, Andrews B, Boone C (2010) Synthetic genetic array (SGA) analysis in Saccharomyces cerevisiae and Schizosaccharomyces pombe . Methods Enzymol 470: 145–179 [DOI] [PubMed] [Google Scholar]
- Brouwer I, Patel HP, Meeussen JVW, Pomp W, Lenstra TL (2020) Single‐molecule fluorescence imaging in living Saccharomyces cerevisiae cells. STAR Protoc 1: 100142 [DOI] [PMC free article] [PubMed] [Google Scholar]
- Bumgarner SL, Neuert G, Voight BF, Symbor‐Nagrabska A, Grisafi P, Van Oudenaarden A, Fink GR (2012) Single‐cell analysis reveals that noncoding RNAs contribute to clonal heterogeneity by modulating transcription factor recruitment. Mol Cell 45: 470–482 [DOI] [PMC free article] [PubMed] [Google Scholar]
- Carmen AA, Rundlett SE, Grunstein M (1996) HDA1 and HDA3 are components of a yeast histone deacetylase (HDA) complex. J Biol Chem 271: 15837–15844 [DOI] [PubMed] [Google Scholar]
- Challal D, Barucco M, Kubik S, Feuerbach F, Candelli T, Geoffroy H, Benaksas C, Shore D, Libri D (2018) General regulatory factors control the fidelity of transcription by restricting non‐coding and ectopic initiation. Mol Cell 72: 955–969 [DOI] [PubMed] [Google Scholar]
- Chen L‐F, Lin YT, Gallegos DA, Hazlett MF, Gómez‐Schiavon M, Yang MG, Kalmeta B, Zhou AS, Holtzman L, Gersbach CA et al (2019) Enhancer histone acetylation modulates transcriptional bursting dynamics of neuronal activity‐inducible genes. Cell Rep 26: 1174–1188 [DOI] [PMC free article] [PubMed] [Google Scholar]
- Chereji RV, Ramachandran S, Bryson TD, Henikoff S (2018) Gene Expression Omnibus GSE97290 (https://www.ncbi.nlm.nih.gov/geo/query/acc.cgi?acc=GSE97290). [DATASET]
- Churchman LS, Weissman JS (2011a) Nascent transcript sequencing visualizes transcription at nucleotide resolution. Nature 469: 368–373 [DOI] [PMC free article] [PubMed] [Google Scholar]
- Churchman LS, Weissman JS (2011b) Gene Expression Omnibus GSE25107 (https://www.ncbi.nlm.nih.gov/geo/query/acc.cgi?acc=GSE25107). [DATASET]
- Core LJ, Martins AL, Danko CG, Waters CT, Siepel A, Lis JT (2014) Analysis of nascent RNA identifies a unified architecture of initiation regions at mammalian promoters and enhancers. Nat Genet 46: 1311–1320 [DOI] [PMC free article] [PubMed] [Google Scholar]
- Core LJ, Waterfall JJ, Lis JT (2008) Nascent RNA sequencing reveals widespread pausing and divergent initiation at human promoters. Science 322: 1845–1848 [DOI] [PMC free article] [PubMed] [Google Scholar]
- Dai J, Hyland EM, Yuan DS, Huang H, Bader JS, Boeke JD (2008) Probing nucleosome function: a highly versatile library of synthetic histone H3 and H4 mutants. Cell 134: 1066–1078 [DOI] [PMC free article] [PubMed] [Google Scholar]
- Dar RD, Razooky BS, Singh A, Trimeloni TV, McCollum JM, Cox CD, Simpson ML, Weinberger LS (2012) Transcriptional burst frequency and burst size are equally modulated across the human genome. Proc Natl Acad Sci USA 109: 17454–17459 [DOI] [PMC free article] [PubMed] [Google Scholar]
- David L, Huber W, Granovskaia M, Toedling J, Palm CJ, Bofkin L, Jones T, Davis RW, Steinmetz LM (2006) A high‐resolution map of transcription in the yeast genome. Proc Natl Acad Sci USA 103: 5320–5325 [DOI] [PMC free article] [PubMed] [Google Scholar]
- Donovan BT, Huynh A, Ball DA, Patel HP, Poirier MG, Larson DR, Ferguson ML, Lenstra TL (2019) Live‐cell imaging reveals the interplay between transcription factors, nucleosomes, and bursting. EMBO J 38: e100809 [DOI] [PMC free article] [PubMed] [Google Scholar]
- Du Mee DJM, Ivanov M, Parker JP, Buratowski S, Marquardt S (2018) Efficient termination of nuclear lncRNA transcription promotes mitochondrial genome maintenance. eLife 7: 1–24 [DOI] [PMC free article] [PubMed] [Google Scholar]
- Fischl H, Howe FS, Furger A, Mellor J (2017) Array Express E‐MTAB‐4568 (https://www.ebi.ac.uk/arrayexpress/experiments/E‐MTAB‐4568/). [DATASET]
- Garalde DR, Snell EA, Jachimowicz D, Sipos B, Lloyd JH, Bruce M, Pantic N, Admassu T, James P, Warland A et al (2018) NCBI BioProject PRJNA408327 (https://www.ncbi.nlm.nih.gov/bioproject/?term=PRJNA408327). [DATASET]
- Gibson DG, Young L, Chuang RY, Venter JC, Hutchison CA, Smith HO (2009) Enzymatic assembly of DNA molecules up to several hundred kilobases. Nat Methods 6: 343–345 [DOI] [PubMed] [Google Scholar]
- Gietz RD, Schiestl RH (2007) High‐efficiency yeast transformation using the LiAc/SS carrier DNA/PEG method. Nat Protoc 2: 31–34 [DOI] [PubMed] [Google Scholar]
- Gil N, Ulitsky I (2020) Regulation of gene expression by cis‐acting long non‐coding RNAs. Nat Rev Genet 21: 102–117 [DOI] [PubMed] [Google Scholar]
- Goldstein AL, McCusker JH (1999) Three new dominant drug resistance cassettes for gene disruption in Saccharomyces cerevisiae . Yeast 15: 1541–1553 [DOI] [PubMed] [Google Scholar]
- Gowthaman U, García‐Pichardo D, Jin Y, Schwarz I, Marquardt S (2020) DNA processing in the context of noncoding transcription. Trends Biochem Sci 45: 1009–1021 [DOI] [PubMed] [Google Scholar]
- Ha SD, Ham S, Kim MY, Kim JH, Jang I, Lee BB, Lee MK, Hwang JT, Roh TY, Kim TS (2019a) Transcription‐dependent targeting of Hda1C to hyperactive genes mediates H4‐specific deacetylation in yeast. Nat Commun 10: 1–14 [DOI] [PMC free article] [PubMed] [Google Scholar]
- Ha SD, Ham S, Kim MY, Kim JH, Jang I, Lee BB, Lee MK, Hwang JT, Roh TY, Kim TS (2019b) Gene Expression Omnibus GSE121761 (https://www.ncbi.nlm.nih.gov/geo/query/acc.cgi?acc=GSE121761). [DATASET]
- Hahne F, LeMeur N, Brinkman RR, Ellis B, Haaland P, Sarkar D, Spidlen J, Strain E, Gentleman R (2009) flowCore: A Bioconductor package for high throughput flow cytometry. BMC Bioinformatics 10: 1–8 [DOI] [PMC free article] [PubMed] [Google Scholar]
- Harlen KM, Trotta KL, Smith EE, Mosaheb MM, Fuchs SM, Churchman LS (2016) Gene Expression Omnibus GSE68484 (https://www.ncbi.nlm.nih.gov/geo/query/acc.cgi?acc=GSE68484). [DATASET]
- Hassan AH, Neely KE, Workman JL (2001) Histone acetyltransferase complexes stabilize SWI/SNF binding to promoter nucleosomes. Cell 104: 817–827 [DOI] [PubMed] [Google Scholar]
- Hocine S, Raymond P, Zenklusen D, Chao JA, Singer RH (2013) Single‐molecule analysis of gene expression using two‐color RNA labeling in live yeast. Nat Methods 10: 119–121 [DOI] [PMC free article] [PubMed] [Google Scholar]
- Ivanov M, Sandelin A, Marquardt S (2021) TrancriptomeReconstructoR: data‐driven annotation of complex transcriptomes. BMC Bioinformatics 22: 290 [DOI] [PMC free article] [PubMed] [Google Scholar]
- Jensen TH, Jacquier A, Libri D (2013) Dealing with pervasive transcription. Mol Cell 52: 473–484 [DOI] [PubMed] [Google Scholar]
- Jiang C, Pugh BF (2009) Penn State Genome Cartography Project (http://atlas.bx.psu.edu/). [DATASET]
- Kapranov P, Cheng J, Dike S, Nix DA, Duttagupta R, Willingham AT, Stadler PF, Hertel J, Hackermuller J, Hofacker IL et al (2007) RNA maps reveal new RNA classes and a possible function for pervasive transcription. Science 316: 1484–1488 [DOI] [PubMed] [Google Scholar]
- Kindgren P, Ivanov M, Marquardt S (2020) Native elongation transcript sequencing reveals temperature dependent dynamics of nascent RNAPII transcription in Arabidopsis . Nucleic Acids Res 48: 2332–2347 [DOI] [PMC free article] [PubMed] [Google Scholar]
- Kubik S, Bruzzone MJ, Challal D, Dreos R, Mattarocci S, Bucher P, Libri D, Shore D (2019) Opposing chromatin remodelers control transcription initiation frequency and start site selection. Nat Struct Mol Biol 26: 744–754 [DOI] [PubMed] [Google Scholar]
- Kurdistani SK, Grunstein M (2003) Histone acetylation and deacetylation in yeast. Nat Rev Mol Cell Biol 4: 276–284 [DOI] [PubMed] [Google Scholar]
- Larson DR, Zenklusen D, Wu B, Chao JA, Singer RH (2011) Real‐time observation of transcription initiation and elongation on an endogenous yeast gene. Science 332: 475–478 [DOI] [PMC free article] [PubMed] [Google Scholar]
- Lee JH, Maskos K, Huber R (2009) Structural and functional studies of the yeast class II Hda1 histone deacetylase complex. J Mol Biol 391: 744–757 [DOI] [PubMed] [Google Scholar]
- Lee JH, Bollschweiler D, Schäfer T, Huber R (2021) Structural basis for the regulation of nucleosome recognition and HDAC activity by histone deacetylase assemblies. Sci Adv 7: eabd4413 [DOI] [PMC free article] [PubMed] [Google Scholar]
- Lenstra TL, Coulon A, Chow CC, Larson DR (2015) Single‐molecule imaging reveals a switch between spurious and functional ncRNA transcription. Mol Cell 60: 597–610 [DOI] [PMC free article] [PubMed] [Google Scholar]
- Lenstra TL, Larson DR (2016) Single‐molecule mRNA detection in live yeast. Curr Protoc Mol Biol 113: 14.24.1–14.24.15 [DOI] [PMC free article] [PubMed] [Google Scholar]
- Liu X, Hoque M, Larochelle M, Lemay JF, Yurko N, Manley JL, Bachand F, Tian B (2017) Gene Expression Omnibus GSE95139 (https://www.ncbi.nlm.nih.gov/geo/query/acc.cgi?acc=GSE95139). [DATASET]
- Livak KJ, Schmittgen TD (2001) Analysis of relative gene expression data using real‐time quantitative PCR and the 2‐ΔΔCT method. Methods 25: 402–408 [DOI] [PubMed] [Google Scholar]
- Lu Z, Lin Z (2019) NCBI BioProject PRJNA483730 (https://www.ncbi.nlm.nih.gov/bioproject/?term=PRJNA483730). [DATASET]
- Marquardt S, Escalante‐Chong R, Pho N, Wang J, Churchman LS, Springer M, Buratowski S (2014a) A chromatin‐based mechanism for limiting divergent noncoding transcription. Cell 157: 1712–1723 [DOI] [PMC free article] [PubMed] [Google Scholar]
- Marquardt S, Escalante‐Chong R, Pho N, Wang J, Churchman LS, Springer M, Buratowski S (2014b) Gene Expression Omnibus GSE55982 (https://www.ncbi.nlm.nih.gov/geo/query/acc.cgi?acc=GSE55982). [DATASET]
- Moretto F, Wood NE, Kelly G, Doncic A, Van Werven FJ (2018) A regulatory circuit of two lncRNAs and a master regulator directs cell fate in yeast. Nat Commun 9: 1–12 [DOI] [PMC free article] [PubMed] [Google Scholar]
- Neil H, Malabat C, D’Aubenton‐Carafa Y, Xu Z, Steinmetz LM, Jacquier A (2009) Widespread bidirectional promoters are the major source of cryptic transcripts in yeast. Nature 457: 1038–1042 [DOI] [PubMed] [Google Scholar]
- Nicolas D, Zoller B, Suter DM, Naef F (2018) Modulation of transcriptional burst frequency by histone acetylation. Proc Natl Acad Sci USA 115: 7153–7158 [DOI] [PMC free article] [PubMed] [Google Scholar]
- Ntini E, Järvelin AI, Bornholdt J, Chen Y, Boyd M, Jørgensen M, Andersson R, Hoof I, Schein A, Andersen PR et al (2013) Polyadenylation site‐induced decay of upstream transcripts enforces promoter directionality. Nat Struct Mol Biol 20: 923–928 [DOI] [PubMed] [Google Scholar]
- Osman S, Cramer P (2020) Structural biology of RNA polymerase II transcription: 20 years on. Annu Rev Cell Dev Biol 36: 1–34 [DOI] [PubMed] [Google Scholar]
- Park SY, Kim JS (2020) A short guide to histone deacetylases including recent progress on class II enzymes. Exp Mol Med 52: 204–212 [DOI] [PMC free article] [PubMed] [Google Scholar]
- Ponjavic J, Ponting CP, Lunter G (2007) Functionality or transcriptional noise? Evidence for selection within long noncoding RNAs. Genome Res 17: 556–565 [DOI] [PMC free article] [PubMed] [Google Scholar]
- Quinn JJ, Chang HY (2016) Unique features of long non‐coding RNA biogenesis and function. Nat Rev Genet 17: 47–62 [DOI] [PubMed] [Google Scholar]
- Rege M, Subramanian V, Zhu C, Hsieh T‐H, Weiner A, Friedman N, Clauder‐Münster S, Steinmetz L, Rando O, Boyer L et al (2015) Chromatin dynamics and the RNA exosome function in concert to regulate transcriptional homeostasis. Cell Rep 13: 1610–1622 [DOI] [PMC free article] [PubMed] [Google Scholar]
- Rhee HS, Pugh BF (2012) Genome‐wide structure and organization of eukaryotic pre‐initiation complexes. Nature 483: 295–301 [DOI] [PMC free article] [PubMed] [Google Scholar]
- Rodriguez J, Larson DR (2020) Transcription in living cells: molecular mechanisms of bursting. Annu Rev Biochem 89: 189–212 [DOI] [PubMed] [Google Scholar]
- Schuldiner M, Collins SR, Weissman JS, Krogan NJ (2006) Quantitative genetic analysis in Saccharomyces cerevisiae using epistatic miniarray profiles (E‐MAPs) and its application to chromatin functions. Methods 40: 344–352 [DOI] [PubMed] [Google Scholar]
- Schulz D, Schwalb B, Kiesel A, Baejen C, Torkler P, Gagneur J, Soeding J, Cramer P (2013) Transcriptome surveillance by selective termination of noncoding RNA synthesis. Cell 155: 1075–1087 [DOI] [PubMed] [Google Scholar]
- Seila AC, Calabrese JM, Levine SS, Yeo GW, Rahl PB, Flynn RA, Young RA, Sharp PA (2008) Divergent transcription from active promoters. Science 322: 1849–1851 [DOI] [PMC free article] [PubMed] [Google Scholar]
- Sigova AA, Mullen AC, Molinie B, Gupta S, Orlando DA, Guenther MG, Almada AE, Lin C, Sharp PA, Giallourakis CC et al (2013) Divergent transcription of long noncoding RNA/mRNA gene pairs in embryonic stem cells. Proc Natl Acad Sci USA 110: 2876–2881 [DOI] [PMC free article] [PubMed] [Google Scholar]
- Struhl K (2007) Transcriptional noise and the fidelity of initiation by RNA polymerase II. Nat Struct Mol Biol 14: 103–105 [DOI] [PubMed] [Google Scholar]
- Swain PS, Elowitz MB, Siggia ED (2002) Intrinsic and extrinsic contributions to stochasticity in gene expression. Proc Natl Acad Sci USA 99: 12795–12800 [DOI] [PMC free article] [PubMed] [Google Scholar]
- Tan‐Wong SM, Zaugg JB, Camblong J, Xu Z, Zhang DW, Mischo HE, Ansari AZ, Luscombe NM, Steinmetz LM, Proudfoot NJ (2012) Gene loops enhance transcriptional directionality. Science 338: 671–675 [DOI] [PMC free article] [PubMed] [Google Scholar]
- van Dijk EL, Chen CL, d’Aubenton‐Carafa Y, Gourvennec S, Kwapisz M, Roche V, Bertrand C, Silvain M, Legoix‐Né P, Loeillet S et al (2011) XUTs are a class of Xrn1‐sensitive antisense regulatory non‐coding RNA in yeast. Nature 475: 114–119 [DOI] [PubMed] [Google Scholar]
- Wang Q, Wan L, Li D, Zhu L, Qian M, Deng M (2009) Searching for bidirectional promoters in Arabidopsis thaliana . BMC Bioinformatics 10: 1–10 [DOI] [PMC free article] [PubMed] [Google Scholar]
- Whitehouse I, Rando OJ, Delrow J, Tsukiyama T (2007) Chromatin remodelling at promoters suppresses antisense transcription. Nature 450: 1031–1035 [DOI] [PubMed] [Google Scholar]
- Winzeler EA, Shoemaker DD, Astromoff A, Liang H, Anderson K, Andre B, Bangham R, Benito R, Boeke JD, Bussey H et al (1999) Functional characterization of the S. cerevisiae genome by gene deletion and parallel analysis. Science 285: 901–906 [DOI] [PubMed] [Google Scholar]
- Wu J, Carmen AA, Kobayashi R, Suka N, Grunstein M (2001) HDA2 and HDA3 are related proteins that interact with and are essential for the activity of the yeast histone deacetylase HDA1. Proc Natl Acad Sci USA 98: 4391–4396 [DOI] [PMC free article] [PubMed] [Google Scholar]
- Wu S, Li K, Li Y, Zhao T, Li T, Yang YF, Qian W (2017) Independent regulation of gene expression level and noise by histone modifications. PLoS Comput Biol 13: e1005585 [DOI] [PMC free article] [PubMed] [Google Scholar]
- Wu ACK, Patel H, Chia M, Moretto F, Frith D, Snijders AP, van Werven FJ (2018) Repression of divergent noncoding transcription by a sequence‐specific transcription factor. Mol Cell 72: 942–954 [DOI] [PMC free article] [PubMed] [Google Scholar]
- Wyers F, Rougemaille M, Badis G, Rousselle J‐C, Dufour M‐E, Boulay J, Régnault B, Devaux F, Namane A, Séraphin B et al (2005) Cryptic pol II transcripts are degraded by a nuclear quality control pathway involving a new poly(A) polymerase. Cell 121: 725–737 [DOI] [PubMed] [Google Scholar]
- Xu Z, Wei W, Gagneur J, Perocchi F, Clauder‐Münster S, Camblong J, Guffanti E, Stutz F, Huber W, Steinmetz LM (2009) Bidirectional promoters generate pervasive transcription in yeast. Nature 457: 1033–1037 [DOI] [PMC free article] [PubMed] [Google Scholar]
- Xu Z, Wei W, Gagneur J, Clauder‐Münster S, Smolik M, Huber W, Steinmetz LM (2011) Antisense expression increases gene expression variability and locus interdependency. Mol Syst Biol 7: 468 [DOI] [PMC free article] [PubMed] [Google Scholar]
- Zenklusen D, Larson DR, Singer RH (2008) Single‐RNA counting reveals alternative modes of gene expression in yeast. Nat Struct Mol Biol 15: 1263 [DOI] [PMC free article] [PubMed] [Google Scholar]