Megakaryocytes (MK) and platelets express high levels of different SRC family kinases including the proto-oncogene SRC, a tyrosine kinase that has been extensively studied in platelets.1 The germline heterozygous missense variant E527K in SRC was detected in patients from three unrelated families with thrombocytopenia accompanied with bleeding symptoms, a paucity of α granules, and a variety of other variable symptoms including myelofibrosis, osteoporosis, facial dysmorphism and behavioral problems.2-4 The E527K-SRC variant resulted in increased kinase activity.2 These observations suggested an important role of SRC in megakaryopoiesis, but defects in downstream pathways because of increased kinase activity remain unknown. In this study, we further explored the effect of SRC kinase signaling in megakaryopoiesis using omics approaches.
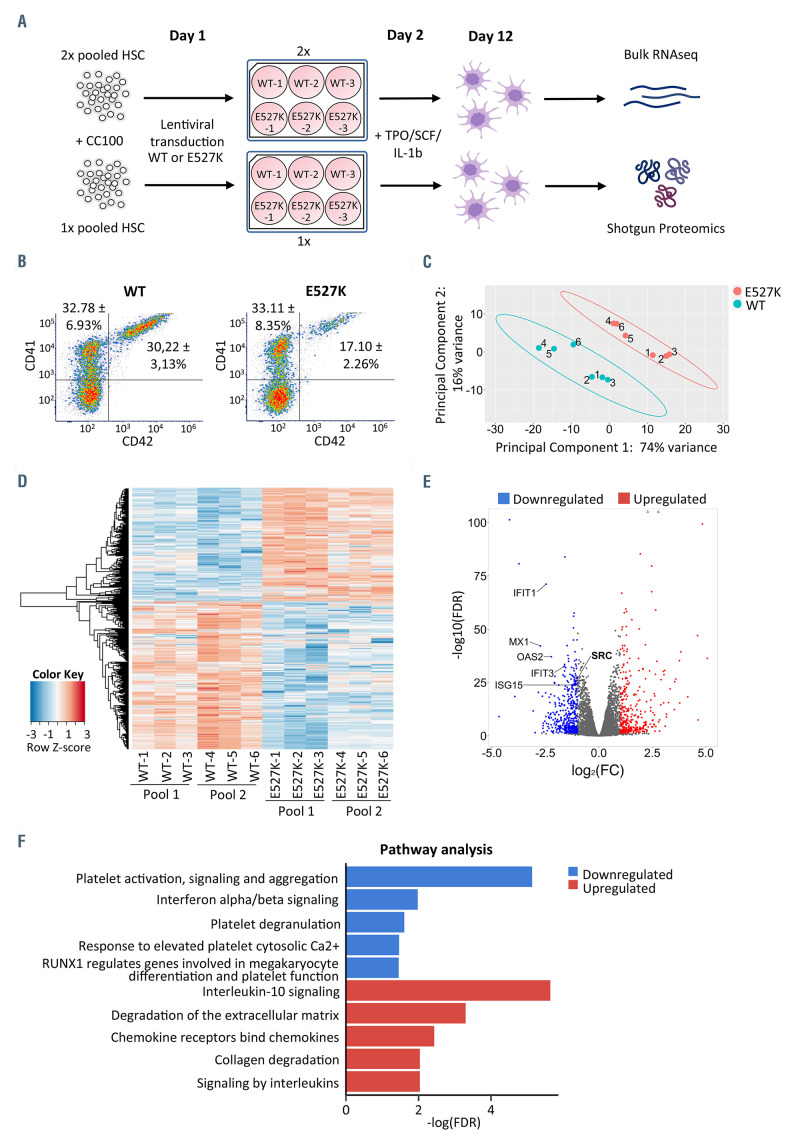
For RNA sequencing (RNAseq), CD34+ hematopoietic stem cells (HSC) were isolated from healthy controls before transduction with wild-type SRC (WT-SRC) and E527K-SRC lentiviral vectors in triplicate and differentiation to MK as described2 (Figure 1A). Day 12 MK were analyzed by flow cytometry for expression markers CD41 (ITGA2B) and CD42 (GP9) (Figure 1B). Though E527K-SRC cultures contained less CD41/CD42 doublepositive MK, there was no difference in CD41 positive immature MK when compared to the WT condition. RNA was extracted from the complete cell population as the aim was to detect differences in genes regulating MK maturation and differentiation. A total of six WT-SRC and six E527K-SRC RNA samples were used for RNAseq to identify differentially expressed genes (DEG). Principal component analysis performed on the RNAseq datasets showed obvious clustering of WT-SRC and E527K-SRC MK samples according to condition (Figure 1C). The SRC gene for WT-SRC samples was covered by 8,661±901 read counts while only 2,988±410 read counts were detected for E527K-SRC MK samples but 80,83±8,06% of these reads contained the E527K variant. Relative expression levels of all significant DEG in E527K-SRC versus WT-SRC samples were visualized in a heatmap (Figure 1D). A total of 852 significant (false discovery rate [FDR]<0.05 and |log2FC|>1) DEG were detected (see the Online Supplementary Table S1 for the full dataset), of which 369 upregulated genes and 483 downregulated genes as visualized in the volcano plot (Figure 1E). Reactome pathway analysis showed that the downregulated DEG were enriched in pathways like platelet activation, signaling and aggregation, interferon type I or α/β signaling, platelet degranulation, response to elevated platelet cytosolic Ca2+, and RUNX1 regulates genes involved in megakaryocytic differentiation and platelet function as top five (Figure 1F). On the other hand, the pathway analysis for upregulated DEG in E527K-SRC MK included interleukin-10 signaling, degradation of the extracellular matrix, chemokine receptors bind chemokines, collagen degradation and signaling by interleukins as top five pathways (Figure 1F). Interestingly, Barozzi et al. recently described that overactive SRC kinase may affect proplatelet formation by affecting the interaction of MK with the extracellular matrix.4
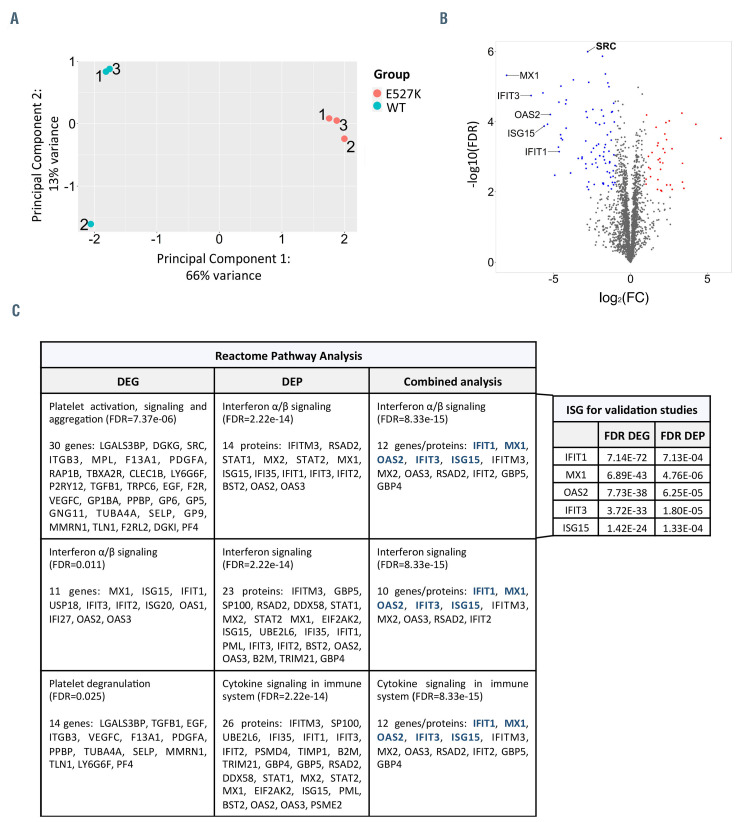
Shotgun proteomics was next used to analyze protein expression in transduced WT-SRC and E527K-SRC differentiated MK at day 12 (Figure 1A). Principal component analysis performed on the proteomics dataset showed a clear separation between WT-SRC and E527K-SRC MK samples, with 66% of total variance explained by the first principal component and 13% explained by the second principal component (Figure 2A). Statistical analysis of WT-SRC and E527K-SRC MK proteomes detected 142 significant (FDR<0.01) differentially expressed proteins (DEP) (see the Online Supplementary Table S2 for the full dataset), of which 43 were upregulated and 99 downregulated as shown in the volcano plot (Figure 2B). Similar to the RNAseq results, SRC was significantly downregulated in E527K-SRC MK (Figure 2B). Interestingly, the Reactome pathway analysis again identified an enrichment of downregulated DEP in the interferon pathways, but no platelet-related pathways were detected.
By comparing the set of DEG and DEP, 20 upregulated and 24 downregulated joined DEG/DEP sets were detected in E527K-SRC MK. Reactome pathway analysis of these joined DEG/DEP identified an enrichment of interferon α/b signaling, interferon signaling and cytokine signaling in the immune system as significant (Figure 2C). This unbiased approach to identify pathways related to hyperactive SRC signaling in MK proposed decreased interferon α/b signaling as an unexpected player. Interferon signaling is neither well studied in megakaryopoiesis nor in SRC kinase signaling, encouraging our further studies in the immortalized megakaryocyte cell line (imMKCL) and in MK derived from a patient with the E527K-SRC variant. The top five downregulated interferon- stimulated genes (ISG) IFIT1, MX1, OAS2, IFIT3 and ISG15 (labeled in Figures 1E, 2B and 2C) were selected for these validation studies.
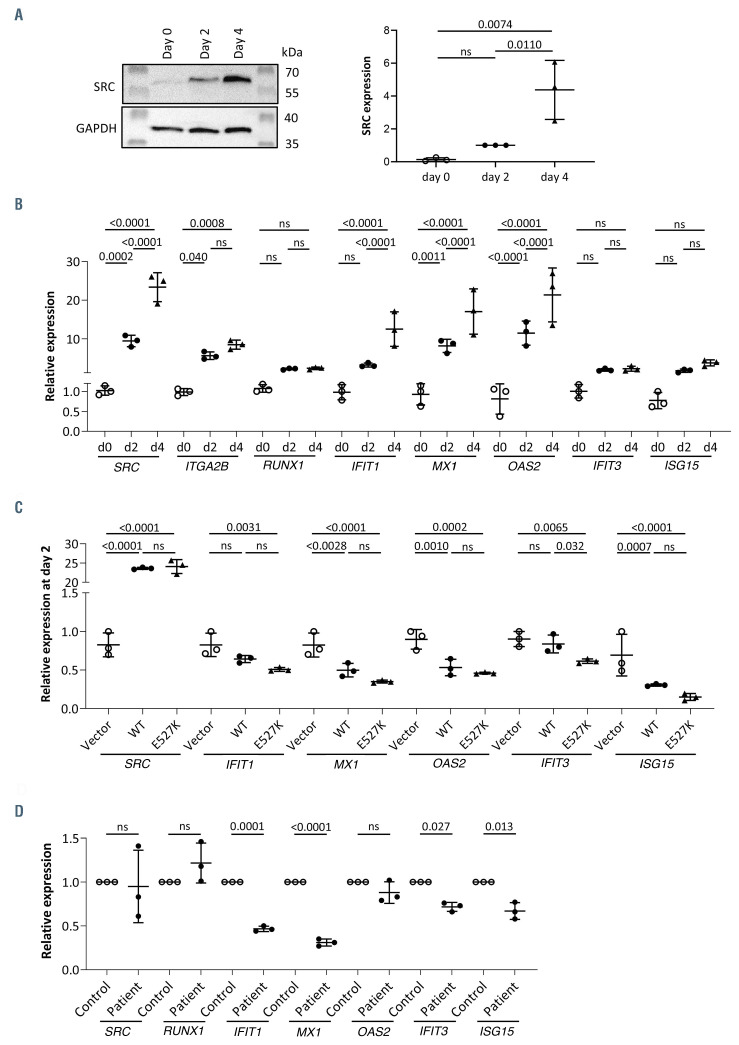
Interestingly, SRC protein expression was significantly increased from day 0 (non-differentiated) to days 2 and 4 differentiated imMKCL (Figure 3A; Online Supplementary Figure S1A and B). This increase was confirmed by quantitative real-time ploymerase chain reaction (qRT-PCR) analysis (Figure 3B). The expression of ISG showed increased levels of IFIT1, MX1, and OAS2 during MK differentiation while no significant differences were detected for IFIT3 and ISG15 (Figure 3B). The expression of RUNX1 in contrast to that of ITGA2B remained unchanged during megakaryopoiesis (Figure 3B).
Genetically modified imMKCL transduced with WTSRC and E527K-SRC lentiviral vectors showed similar results as detected in the RNAseq study. A significant downregulation of all ISG was present in E527K-SRC MK compared to WT-SRC MK (Online Supplementary Figure S1C). Adding interferon α (IFNα) to the medium resulted in higher expression of ISG but no difference in reactivity was detected between E527K-SRC and WT-SRC MK (Online Supplementary Figure S1C). In order to exclude the possibility that the difference in ISG expression between WT-SRC and E527K-SRC would be due to the difference in SRC expression between those conditions or the lentiviral transduction, transfection experiments were performed. In addition, a comparison with MK transfected with an empty vector was missing from previous experiments. Therefore, imMKCL were transfected with pSecTag2 empty, WT-SRC and E527K-SRC expression vectors and the expression of SRC and the different ISG was quantified in day 2 MK (Figure 3C). Compared to the condition with the empty vector, MK with WT-SRC and E527K-SRC now expressed similarly elevated SRC levels. Interestingly, both WT-SRC and E527K-SRC MK expressed significantly lower ISG levels compared to MK transfected with the empty vector (Figure 3C). Overexpression of SRC in the undifferentiated imMKCL affected ISG expression during megakaryopoiesis but this experiment also pointed out that the detection of the ISG in the RNAseq dataset could not be explained by the lower SRC expression in E527K-SRC compared to WTSRC MK. Though the difference between WT-SRC and E527K-SRC MK in the transfection experiment was only significantly different for IFIT3 expression, the difference for the other ISG was always more pronounced between E527K-SRC and the condition with the empty vector than when comparing WT-SRC with the empty vector. This difference could be due to the fact that these expression studies were performed on day 2 immature imMKCL cells while the omics was performed on day 12 mature MK. Finally, expression studies were validated in HSC-derived day 12 mature MK from a patient carrying E527K-SRC3 and a control. No significant difference in SRC and RUNX1 expression could be detected while patient MK showed significantly decreased expression of all ISG except OAS2 (Figure 3D). The downregulation was most pronounced for IFIT1 and MX1, the two genes that were the most significantly downregulated in the RNAseq dataset (Figure 2C).
Figure 1.
Bulk RNA sequencing of WT-SRC and E527K-SRC megakaryocytes. (A) A total of three hematopoietic stem cell (HSC) pools were isolated from peripheral blood from 15 healthy controls and cultured in HSC amplification medium (with cytokine cocktail 100). On day 1 after isolation, HSC were transduced in triplicate with either wild-type SRC (WT-SRC) or E527K-SRC lentiviral vectors. On day 2, differentiation to megakaryocytes (MK) was initiated upon addition of the cytokines TPO, SCF and IL1b. Day 12 mature MK were collected for bulk RNA sequencing and shotgun proteomics. (B) Flow cytometry of day 12 MK stained for CD41 (forward scatter) and CD42 (side scatter). The % of CD41+ and CD41/CD42+ MK are shown for WT-SRC and E527K-SRC cells as mean and standard deviation for 3 cultures. (C) Principal component analysis of 6 WT-SRC and 6 E527K-SRC MK samples used for RNA sequencing. (D) Heatmap visualizing the 852 differentially expressed genes (DEG) identified in E527K-SRC vs. WT-SRC MK samples (red, upregulated genes; blue, downregulated genes). (E) Volcano plot showing the 852 DEG detected in E527K-SRC MK organized according to log2(fold-change [FC]) and -log10(false discovery rate [FDR]). (red, upregulated genes with FDR<0.05 and log2FC>1; blue, downregulated genes with FDR<0.05 and log2FC<-1). (F) The 852 DEG were used for Reactome pathway analysis. Top 5 downregulated (blue) and upregulated (red) pathways are shown as arranged by their -log(FDR) value.
Figure 2.
Shotgun Proteomics of WT-SRC and E527K-SRC megakaryocytes. (A) Principal component analysis of three wild-type SRC (WT-SRC) and three E527KSRC megakaryocyte (MK) samples used for shotgun proteomics analysis. (B) Volcano plot showing the 141 differentially expressed proteins (DEP) detected in E527K-SRC MK organized according to log2(fold-change [FC]) and -log10(false discovery rate [FDR]). (red, upregulated proteins with FDR<0.01 and log2FC>1; blue, downregulated proteins with FDR<0.01 and log2FC<-1) (C) Top 3 enriched downregulated pathways in E527K-SRC MK from Reactome analyses using differentially expressed genes (DEG), DEP and the combined dataset (left panel). Genes selected for validation are depicted in blue. FDR values for these five most significant interferon-stimulated genes (ISG) are shown as found in the RNA sequencing and proteomics analyses (right panel).
Figure 3.
Validation of interferon-stimulated genes in immortalized megakaryocyte cell line (imMKCL). (A) Immunoblot analysis of total SRC expression on day 0, 2 and 4 megakaryocytes (MK) (left). GAPDH was used as loading control. Quantification of SRC expression in triplicate immunoblots and statistical analysis using one-way ANOVA with multiple comparisons (right). (B) Quantitative real-time polymerase chain reaction (qRT-PCR) validation showing relative expression of SRC, IFIT1, MX1, OAS2, IFIT3 and ISG15 on day 0, 2 and 4. Statistical analysis was performed using one-way ANOVA with multiple comparisons. (C) qRT-PCR validation showing relative expression of SRC, IFIT1, MX1, OAS2, IFIT3 and ISG15 on day 2 MK transfected with empty vector, WT-SRC or E527K-SRC in pSecTag- Hygro expression vector (triplicated transfection experiment). Statistical analysis was performed using one-way ANOVA with multiple comparisons. (D) qRT-PCR validation showing relative expression of SRC, RUNX1, IFIT1, MX1, OAS2, IFIT3 and ISG15 in MK from a control and the patient carrying the E527K SRC variant (3 technical repeats). Statistical analysis was performed using one-way ANOVA with multiple comparisons.
The combined omics approach detected IFNα/b signaling as most significantly downregulated pathway associated with E527K-SRC hyperactivity. This was an unexpected finding because interferons are generally considered to be negative regulators of cellular proliferation and maturation.5 As qRT-PCR data showed no evidence for an altered response towards IFNα, the difference in ISG expression in E527K-SRC is due to a downstream effect. The proteomics (but not the RNAseq) data showed that STAT1 and STAT2 were significantly downregulated in E527K-SRC MK (Online Supplementary Table S2). Further studies must be undertaken to pinpoint the exact place of SRC in this pathway. In chronic myeloid leukemia, the fusion gene BCR-ABL is the result from the translocation between chromosomes 9 and 22. Similar to E527K-SRC, BCR-ABL is an overactive tyrosine kinase. Studies showed that BCR-ABL in hematopoietic cells caused the transcriptional suppression of ISG such as ISG15, IRF1, IRF9 and IFIT1,7 which resulted in impaired IFNα-mediated protection against viral infection and reversal of IFNα-dependent growth suppression, thereby promoting malignant transformation.7 As downregulated ISG were also present in E527K-SRC MK, this points to a clear similarity between both overactive kinases, SRC and BCR-ABL. The suppression of ISG in BCR-ABL cells is reflected by the suppression of JAK-STAT pathway components, including STAT1.7 It is also interesting that previous proteomic studies using inducible pluripotent stem cell-derived MK from a patient with the GFI1B Q287 *variant showed low expression levels of STAT1, MX1, IFIT1, IFIT3 and OAS2, similar to our findings.8 This study hypothesizes that the underlying pathway would be a failure of IFNg to activate its target genes via STAT1 although this was not experimentally studied. Of note, similar to SRC deficiency, GFI1B defects result in thrombocytopenia, α granule deficiency and myelofibrosis.
In conclusion, we here describe that interferon signaling plays a role during megakaryopoiesis by acting downstream of SRC signaling. However, the exact mechanisms of how SRC can change ISG to influence megakaryopoiesis still remain unknown.
Supplementary Material
Funding Statement
Funding: this work was supported by KULeuven BOF grant C14/19/096, FWO grant G072921N and research grants from Novo Nordisk and Swedish Orphan Biovitrum AB (SOBI).
References
- 1.De Kock L, Freson K. The (Patho)biology of src kinase in platelets and megakaryocytes. Med. 2020;56(12):1-11. [DOI] [PMC free article] [PubMed] [Google Scholar]
- 2.Turro E, Greene D, Wijgaerts A, et al. A dominant gain-of-function mutation in universal tyrosine kinase SRC causes thrombocytopenia, myelofibrosis, bleeding, and bone pathologies. Sci Transl Med. 2018; 8(328):328ra30. [DOI] [PMC free article] [PubMed] [Google Scholar]
- 3.De Kock L, Thys C, Downes K, et al. De novo variant in tyrosine kinase SRC causes thrombocytopenia: case report of a second family. Platelets. 2019;30(7):931-934. [DOI] [PubMed] [Google Scholar]
- 4.Barozzi S, Di Buduo CA, Marconi C, et al. Pathogenetic and clinical study of a patient with thrombocytopenia due to the p.E527K gainof- function variant of SRC. Haematologica. 2020;106(3):918-922. [DOI] [PMC free article] [PubMed] [Google Scholar]
- 5.Pestka S, Langer JA, Zoon KC, Samuel CE. Interferons and their actions. Annu Rev Biochem. 1987;(57):727-777. [DOI] [PubMed] [Google Scholar]
- 6.Couldwell G, Machlus KR. Modulation of megakaryopoiesis and platelet production during inflammation. Thromb Res. 2019; 179:114-120. [DOI] [PubMed] [Google Scholar]
- 7.Katsoulidis E, Sassano A, Majchrzak-Kita B, et al. Suppression of interferon (IFN)-inducible genes and IFN-mediated functional responses in BCR-ABL-expressing cells. J Biol Chem. 2008; 283(16): 10793-10803. [DOI] [PMC free article] [PubMed] [Google Scholar]
- 8.Van Oorschot R, Hansen M, Koornneef JM, et al. Molecular mechanisms of bleeding disorderassociated GFI1BQ287* mutation and its affected pathways in megakaryocytes and platelets. Haematologica. 2019;104(7):1460-1472. [DOI] [PMC free article] [PubMed] [Google Scholar]
Associated Data
This section collects any data citations, data availability statements, or supplementary materials included in this article.


