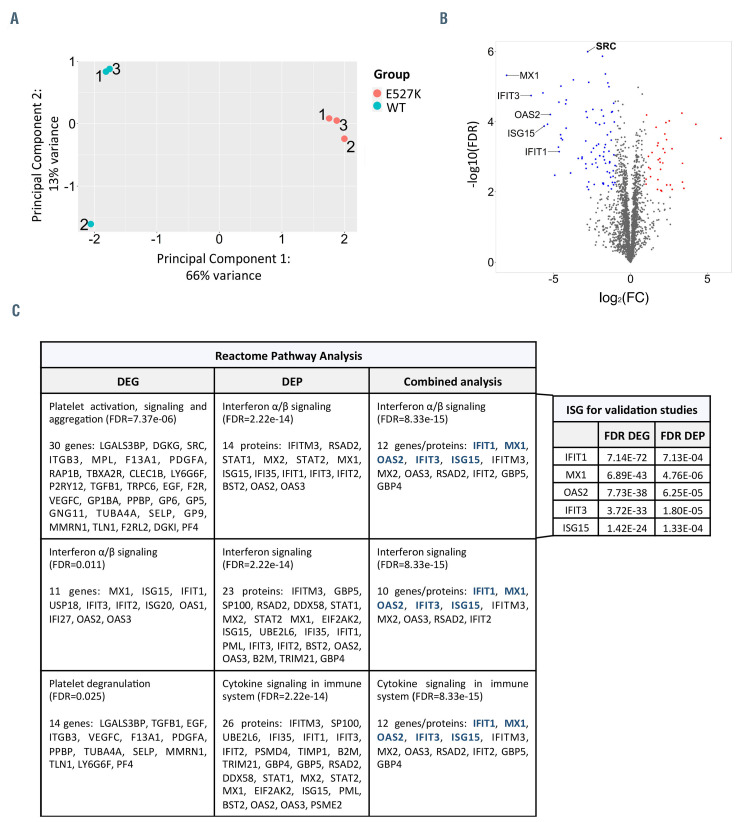
Figure 2.
Shotgun Proteomics of WT-SRC and E527K-SRC megakaryocytes. (A) Principal component analysis of three wild-type SRC (WT-SRC) and three E527KSRC megakaryocyte (MK) samples used for shotgun proteomics analysis. (B) Volcano plot showing the 141 differentially expressed proteins (DEP) detected in E527K-SRC MK organized according to log2(fold-change [FC]) and -log10(false discovery rate [FDR]). (red, upregulated proteins with FDR<0.01 and log2FC>1; blue, downregulated proteins with FDR<0.01 and log2FC<-1) (C) Top 3 enriched downregulated pathways in E527K-SRC MK from Reactome analyses using differentially expressed genes (DEG), DEP and the combined dataset (left panel). Genes selected for validation are depicted in blue. FDR values for these five most significant interferon-stimulated genes (ISG) are shown as found in the RNA sequencing and proteomics analyses (right panel).

