Abstract
Water retention curves are essential for understanding the hydrologic behavior of partially saturated porous media and modeling flow and transport processes within the vadose zone. We directly measured the main drying and wetting branches of the average water retention function obtained using two-dimensional neutron radiography. Flint sand columns were saturated with water and then drained and rewetted under quasi-equilibrium conditions using a hanging water column setup. Digital images (2048 by 2048 pixels) of the transmitted flux of neutrons were acquired at each imposed matric potential (∼10–15 matric potential values per experiment) at the National Institute of Standards and Technology Center for Neutron Research BT-2 neutron imaging beam line. Volumetric water contents were calculated on a pixel-by-pixel basis using Beer-Lambert’s law after taking into account beam hardening and geometric corrections. To account for silica attenuation and remove scattering effects at high water contents, the volumetric water contents were normalized (to give relative saturations) by dividing the drying and wetting sequences of images by the images obtained at saturation and satiation, respectively. The resulting pixel values were then averaged and combined with information on the imposed basal matric potentials to give average water retention curves. The average relative saturations obtained by neutron radiography showed an approximate one-to-one relationship with the average values measured volumetrically using the hanging water column setup. There were no significant differences (P < 0.05) between the parameters of the van Genuchten equation fitted to the average neutron radiography data and those estimated from replicated hanging water column data. Our results indicate that neutron imaging is a very effective tool for quantifying the average water retention curve.
Because of the strong attenuation of neutrons by H in water and their relatively small attenuation by air and mineral solids (Anderson et al., 2009; Strobl et al., 2009), neutrons have long been used to measure the soil water content. The neutron probe was first developed >60 yr ago, and it continues to be a common and reliable field instrument for measuring water content in the vadose zone (Belcher et al., 1950; Gardner and Kirkham, 1952; Schmugge et al., 1980; Chanasyk and Naeth, 1996). When combined with paired tensiometer measurements, the neutron probe can also be used to determine the soil water retention curve (e.g., Andreu et al., 1997; Al-Yahyai et al., 2006). Like the hanging water column and pressure cell laboratory techniques (Dane and Hopmans, 2002), however, this is essentially a “black box” approach that provides an “average” water retention curve associated with a given sampling volume.
During the past two decades, the use of nondestructive testing to study flow and transport processes in porous media has grown significantly (Chaouki et al., 1997). Nondestructive testing offers the possibility of seeing into the “black box” and determining the point water retention function. Gamma beam attenuation (Dane et al., 1992), magnetic resonance imaging (Chen and Balcom, 2005), and x-ray computed tomography (Bayer et al., 2004) have all been used to determine point water retention curves for air displacing water in porous media. Neutron imaging is a nondestructive testing method based on measuring the transmitted intensity of neutrons, either in two or three dimensions (referred to as radiography and tomography, respectively). Neutron imaging is a particularly powerful tool with respect to soil water due to its high spatial and temporal resolutions and relatively large imaging area (up to 500 cm2) (Chaouki et al., 1997; Deinert et al., 2004; Trabold et al., 2009; Heller et al., 2009).
Since it was first applied to visualize the spatial distribution of soil water in the 1970s (Lewis and Krinitzsky, 1976), the number of studies using neutron imaging to monitor fluids in porous media has grown rapidly. Deinert et al. (2004) used real-time neutron radiography to measure fluid contents and wetting front profiles in homogeneous silica sand. They were able to estimate the hydraulic conductivity and diffusivity from the flow field images with satisfying results. They also concluded that neutron imaging is an ideal tool for detailed laboratory studies because of its sensitivity to variations in moisture content and its ability to image nontranslucent media. Heller et al. (2009) measured the water volume in fuel cells by neutron computed tomography and indicated that the quantification technique yielded a value of the water column mass within 2% of the theoretical. Recent studies have focused on capillary-driven imbibition (Hassanein et al., 2006b; Cnudde et al., 2008; El Abd et al., 2009), root water uptake (Oswald et al., 2008), and gravity-driven fingering (Hincapié and Germann, 2009, 2010).
Because of its capability for high resolution spatial and temporal measurements of water in porous media, neutron imaging is an ideal technique for investigating hysteresis of the soil water retention function. Tumlinson et al. (2008) applied neutron tomography to construct a small portion of the main drying curve based on a single applied pressure. Vasin et al. (2008) measured average drainage curves for heterogeneous sand columns comprised of coarse and fine sands packed into random and periodic cellular structures using neutron tomography performed under quasi-equilibrium conditions. To the best of our knowledge, neutron radiography has not been previously employed to measure hysteretic soil water functions.
The main thrust of our research was to apply the neutron imaging technique to directly measure point soil water retention functions. The specific objective of this study was to compare hysteresis in drying and wetting measurements obtained by neutron radiography with those from the traditional hanging water column method. Because the traditional hanging water column method produces an average water retention curve (for the entire soil volume investigated), we compared the two data sets by averaging the neutron radiographic point (or pixel-by-pixel) measurements of relative saturation across the imaged soil area. Both sets of average water retention curves were then fitted to the van Genuchten equation (van Genuchten, 1980) and their resulting parameter estimates compared statistically.
MATERIALS AND METHODS
Sample Properties and Column Preparation
Coarse-grained, homogeneous sand (Flint no. 13, U.S. Silica Co., Berkeley Springs, WV) was selected for study because it can be completely drained by a hanging water column within the height constraints of the neutron beam line setup at the National Institute of Standards and Technology (NIST) and because it is free of any organic materials that could complicate the quantification of water content by neutron imaging. Flint no. 13 sand is mainly composed of quartz (99.8%), grain diameters range from 0.11 to 0.60 mm, the median grain diameter is 0.56 mm, and the grain density is 2.65 g cm−3 (U.S. Silica Company, 2009). The saturated hydraulic conductivity, determined using the constant-head method implemented without a water tank is 1.66 × 10⁻⁴ ± 0.32 × 10⁻⁴ m s−1 (Reynolds and Elrick, 2002).
Sand samples were washed with distilled water and oven dried before use. They were then moistened with de-aired, distilled water and packed into custom-made Al cylinders (Al alloy 6062) with a height of 12.56 cm and a diameter of 2.65 cm. The top of the Al cylinder was open to the atmosphere. A hanging water column made out of Tygon tubing (R3603, 3.175 mm [1/8 inch] i.d. by 6.35 mm [1/4 inch] o.d., Fisher Scientific) and a glass burette of 25-mL volume (Fisher Scientific), filled with de-aired, distilled water, was connected to an outlet at the base of the Al cylinder. The bottom of the cylinder was covered with several layers of moist Whatman no. 4 filter paper (150-mm diameter, 25 μm). Any air bubbles in the hanging water column were removed by suction before placing the filter paper. The sand was then incrementally moist-packed into the cylinder to minimize particle segregation and air entrapment. The average height of the packed sand columns was 4.25 ± 0.08 cm, with an average bulk density of 1.74 ± 0.02 g cm−3. The burette and sand column setups were clamped to a stand. Before each experiment, the burette at the end of the hanging water column was raised to the top of the sand pack and allowed to equilibrate overnight to fully saturate the column. The top of the Al column was loosely covered with Al foil to minimize evaporation from the saturated sample.
Neutron Imaging Experiments
Neutron radiography was performed at the NIST Center for Neutron Research (NCNR) BT-2 imaging beam line. The BT-2 imaging facility is equipped with a Gadox scintillator (Lexel Imaging) and a charge coupled device camera (Andor). The field of view was 4.5 by 4.5 cm2, with a resolution of 50 μm. The ratio of the collimator tube length to its aperture diameter (the L/D ratio) was 600 and the neutron flux was 4.97 × 106 cm−2 s−1. It should be emphasized that the NCNR BT-2 facility uses a thermal neutron source. In contrast to cold neutrons, thermal neutrons have higher transmission through relatively thick sections of scattering material (Riley et al., 2009; Mukundan and Borup, 2009). The BT-2 beam line has previously been used to image water in granular materials (Kim et al., 2011).
Radiography data sets for air displacing water and vice versa in a Flint sand column were acquired at the NCNR during March 2010 (4 d of total beam time). A presaturated Flint sand column sample, connected to a hanging water column, was set up in the BT-2 beam line. The distance between the column and the detector screen was ∼1.6 cm. A schematic diagram of the experimental setup is shown in Fig. 1. The column was drained and rewetted under quasi-equilibrium conditions by adjusting the height of the hanging water column outside of the beam line to give between 10 and 15 basal matric potential values per drying–wetting cycle. The midpoint of the sand pack was considered to be the level of zero matric potential at complete saturation. Radiographs were taken at each quasi-equilibrium state during the drying and wetting cycles with an exposure time of 60 s. Each image was comprised of 2048 by 2048 pixels. The water level in the burette at each equilibrium state was recorded simultaneously and later used to construct the main drainage and wetting branches of the water retention curve. Replicate experiments were not possible because of the limited amount of beam time available for the experiment.
Fig. 1.
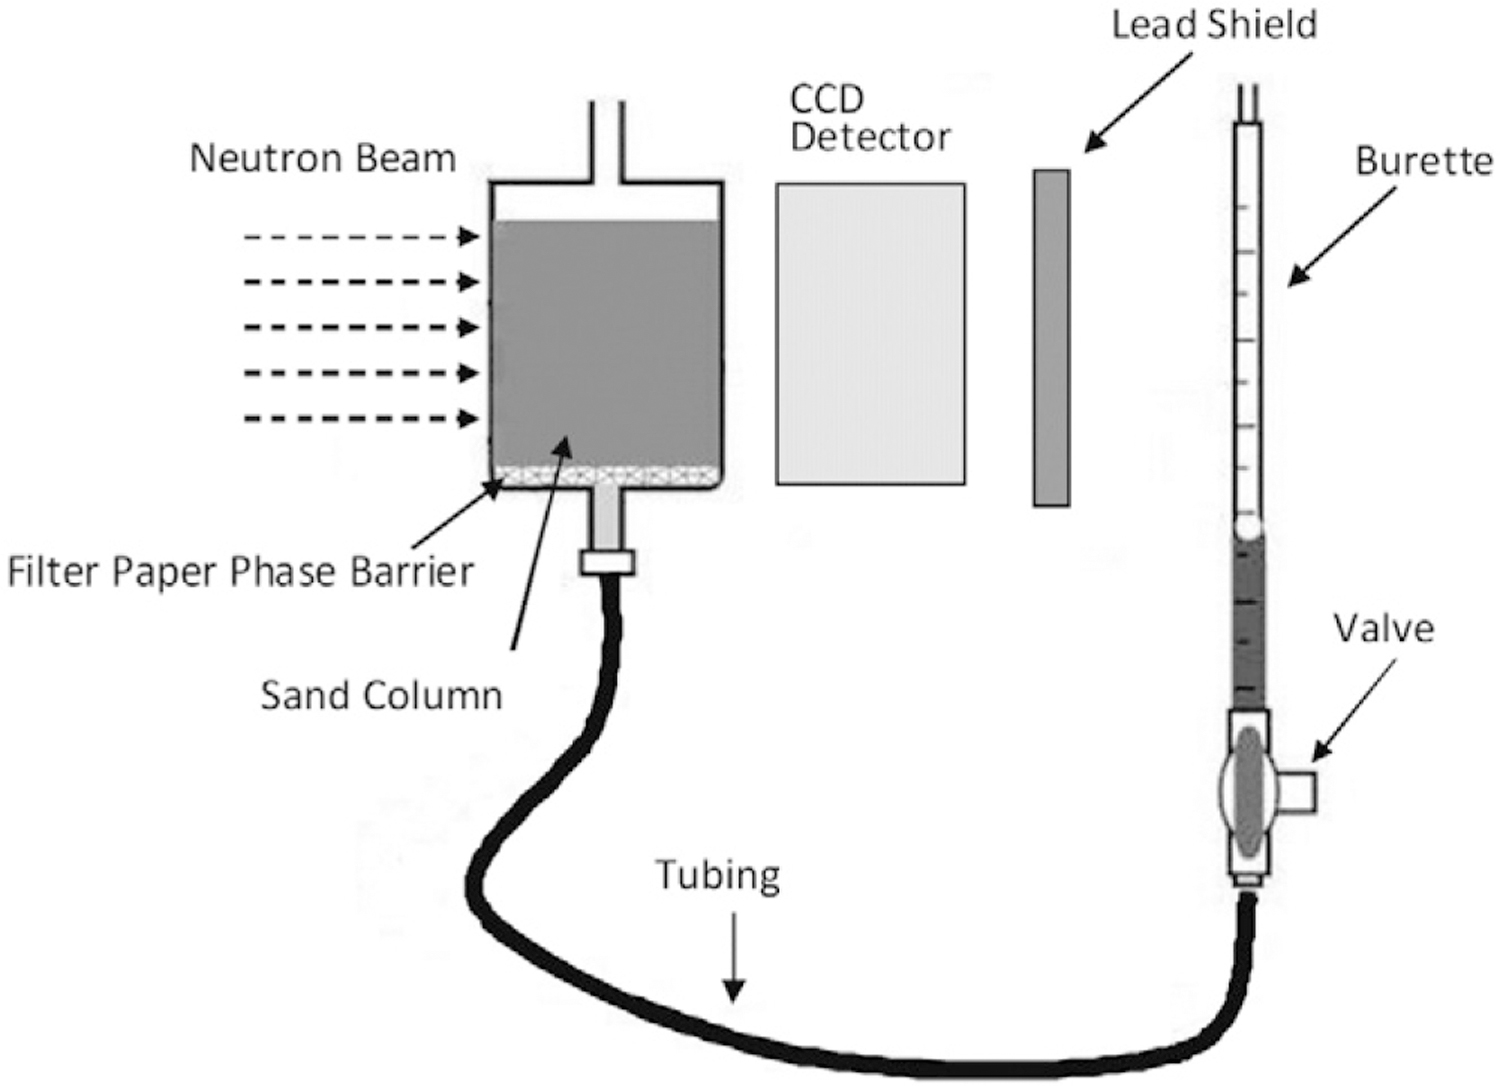
Schematic diagram in cross-section of the experimental setup at the National Institute of Standards and Technology Center for Neutron Research beam line (not to scale).
An oven-dry sample was prepared by placing a Flint sand column at residual saturation in an oven with the temperature set at 105°C for 32 h. The oven-dry sample was then imaged following the procedure described above for later analysis to estimate the attenuation of the dry silica sand and Al container. The oven-dry sample was immediately placed in the beam line when it was removed from the oven. The top of the Al container was loosely covered with Al tape. The likelihood of water adsorbing onto particle surfaces from the atmosphere was considered negligible due to the short exposure time, covering material used, and the coarse grain size of the Flint sand.
Image Analysis
All image processing and quantitative analyses were performed using the MATLAB (Version 7.11, R2010b-SP1, The Mathworks) and ImageJ (Version 1.43m, National Institutes of Health) software packages. The raw neutron radiographs were analyzed to obtain the distribution of volumetric water contents within the sand column on a pixel-by-pixel basis. The transmission of neutrons through the sand column can be described using the Lambert-Beer law (Berger, 1971):
| [1] |
where I is the transmitted intensity, I0 is the original intensity,τ is the effective water thickness, and μ is the attenuation coefficient for the medium, which includes water, air, silica sand, and the Al wall of the sample container. The attenuation coefficient for air is very small and can be neglected. Measurements of the attenuation coefficients for Al and silica sand indicate that they are small compared with that for the H in water (see below). The collected raw images were first γ filtered and then normalized with respect to reference images of the open beam (shutter opened without a sample) and dark field (shutter closed, no neutron illumination) using
| [2] |
The water thickness τij (cm) was then calculated on a pixel-by-pixel basis (i, j) using Eq. [2] combined with the following expression derived from Eq. [1] by assuming μ = μw +βτ :
| [3] |
where μw= 0.326 mm−1 is the linear attenuation coefficient for water and β = −0.121 mm−2 is a beam hardening correction coefficient for the detector used. Note that both constants vary with the specific imaging facility and detector system and are sensitive to the energy spectrum of the neutron beam when experiments are conducted.
Because of the cylindrical geometry of the packed sand column, the measured water thicknesses were corrected for variations in the transmitted path length of neutrons based on the chord length, Cij, for a circle:
| [4] |
where r is the radius of the sand column (cm) and a(i,j) is the distance from the center of the column to the pixel (i, j) (cm). The volumetric water content at pixel (i, j), θij (m3 m−3), is then simply the ratio of the measured water thickness to the chord length, i.e.,
| [5] |
The drying and wetting θij values were normalized (to give relative saturations, Sij) by dividing each image field, on a pixel-by-pixel basis, by the image fields of the θij values obtained at saturation (drying curve) and satiation (wetting curve), respectively. To compare the water retention curves obtained by neutron radiography with those from the hanging water column method, the individual θij and Sij values from the neutron radiographs were averaged across the imaged soil area for each matric potential, i.e., θ = <θij> and S = <Sij>.
Hanging Water Column Experiments
In addition to the neutron imaging experiments, five replicate conventional hanging water column experiments were performed at NIST or in the Vadose Zone Laboratory of the Department of Earth and Planetary Sciences at the University of Tennessee, Knoxville. These experiments were conducted as described above and using the same experimental setup as in Fig. 1 except that the average water contents were determined volumetrically by recording water level changes in the burette. Two of the five columns, however, were not rewetted. Thus, five replicate drying curves and three replicate wetting curves were obtained for comparison with the average drying and wetting curves obtained by neutron radiography. Relative saturations, S, were again calculated by dividing the measured <θ> values by the saturated (drying) and satiated (wetting) <θ> values for the drying and wetting curves, respectively.
Parameterization of Water Retention Curves
The average neutron radiography and conventional hanging water column data sets were both parameterized by fitting the van Genuchten (VG) equation (van Genuchten, 1980). The VG equation was fitted in the following form:
| [6] |
where Sr is the residual saturation, α is a parameter inversely related to the air-or water-entry values, ψ is the matric potential, and n is a shape parameter influenced by the pore-size distribution. For the conventional water retention curves, the fitting was done using the pooled data from all of the replicate hanging water column experiments. Equation [6] was fitted to the drying and wetting curves simultaneously using segmented nonlinear regression (Marquardt method) in SAS 9.2 (SAS Institute). This fitting procedure produces a single estimate of Sr for each method, while different estimates of α and n are obtained depending on the method and if air is displacing water (drying) or vice versa (wetting). The goodness of fit was assessed based on the root mean square error (RMSE) and by linear regression of the observed and predicted S values to give a coefficient of determination (R2).
For statistical testing, Eq. [6] was also fitted separately to each of the five replicate hanging water column data sets. The wetting and drying curves were fitted simultaneously as described above, except for the two experiments that were not rewetted; in those cases, Eq. [6] was only fitted to the main drying curve. The R2 values for the individual fits ranged from 0.996 to 0.999. The mean values of the resulting VG parameters were then compared with the single VG parameter estimates from the neutron imaging data using one-sample t-tests in SAS.
RESULTS AND DISCUSSION
The average volumetric water contents computed from the neutron radiography measurements are plotted against those from the volumetric hanging water column measurements in Fig. 2a for the complete range of imposed basal matric potentials. As can be seen, the volumetric water contents from the neutron images were significantly overestimated for both the drying and wetting cycles. Average water content values at saturation and satiation for the two different methods are summarized in Table 1.
Fig. 2.
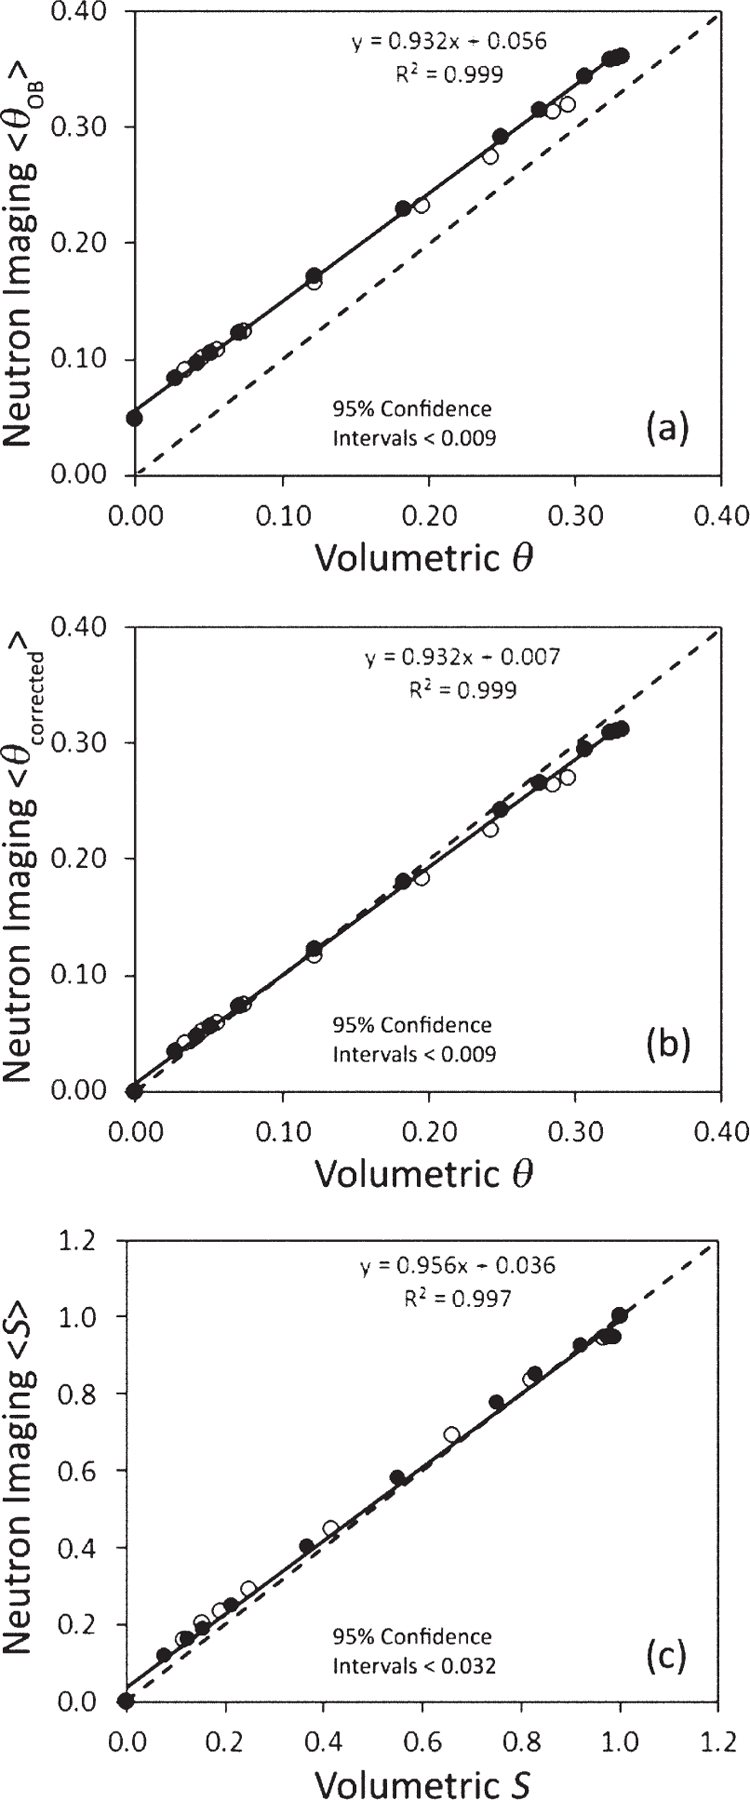
Comparison of data from the neutron imaging and hanging water column experiments: (a) average water contents <θ>, (b) average water contents with neutron data corrected based on oven-dried sample, and (c) average relative saturations <S>. In all three cases, the 95% confidence intervals for individual points are not shown because they were smaller than the symbols used. Dashed line is the 1:1 relationship (closed circle: drying, open circle: wetting).
Table 1.
Mean, upper (U) and lower (L) 95% confidence intervals for saturated (drying) and satiated (wetting) volumetric water contents (θ) measured by the hanging water column and neutron imaging methods.
| Saturated θ |
Satiated θ |
|||||||
|---|---|---|---|---|---|---|---|---|
| Method | n | L95% | Mean | U95% | n | L95% | Mean | U95% |
|
|
m3 m−3 |
|
|
m3 m−3 |
|
|||
| Hanging water column | 5 | 0.332 | 0.341 | 0.351 | 3 | 0.269 | 0.312 | 0.355 |
| Neutron imaging | 1.7 × 10⁶ | 0.365 | 0.366 | 0.366 | 1.7 × 10⁶ | 0.321 | 0.321 | 0.322 |
| Neutron imaging (corrected) | 1.7 × 10⁶ | 0.311 | 0.312 | 0.313 | 1.7 × 10⁶ | 0.269 | 0.270 | 0.271 |
The oven-dry sample was also analyzed separately and the attenuation coefficient for silica sand and the Al container was determined to be 0.023 mm−1. Separate measurements for Al indicated an attenuation coefficient of 0.009 mm−1. Compared with the attenuation coefficient of 0.326 mm−1 for water, these values are relatively small. As shown in Fig. 3, the effect of the Al walls of the sample container on the transmission of neutrons was minimal. The attenuation due to the presence of silica sand, however, had a noticeable effect on the relative intensity (Fig. 3). Analysis of the oven-dry sample image showed that the neutron attenuation due to the Al container and silica sand was equivalent to a volumetric water content of 0.050 ± 0.001 m3 m−3. This attenuation of the dry components was accounted for in the wet samples.
Fig. 3.
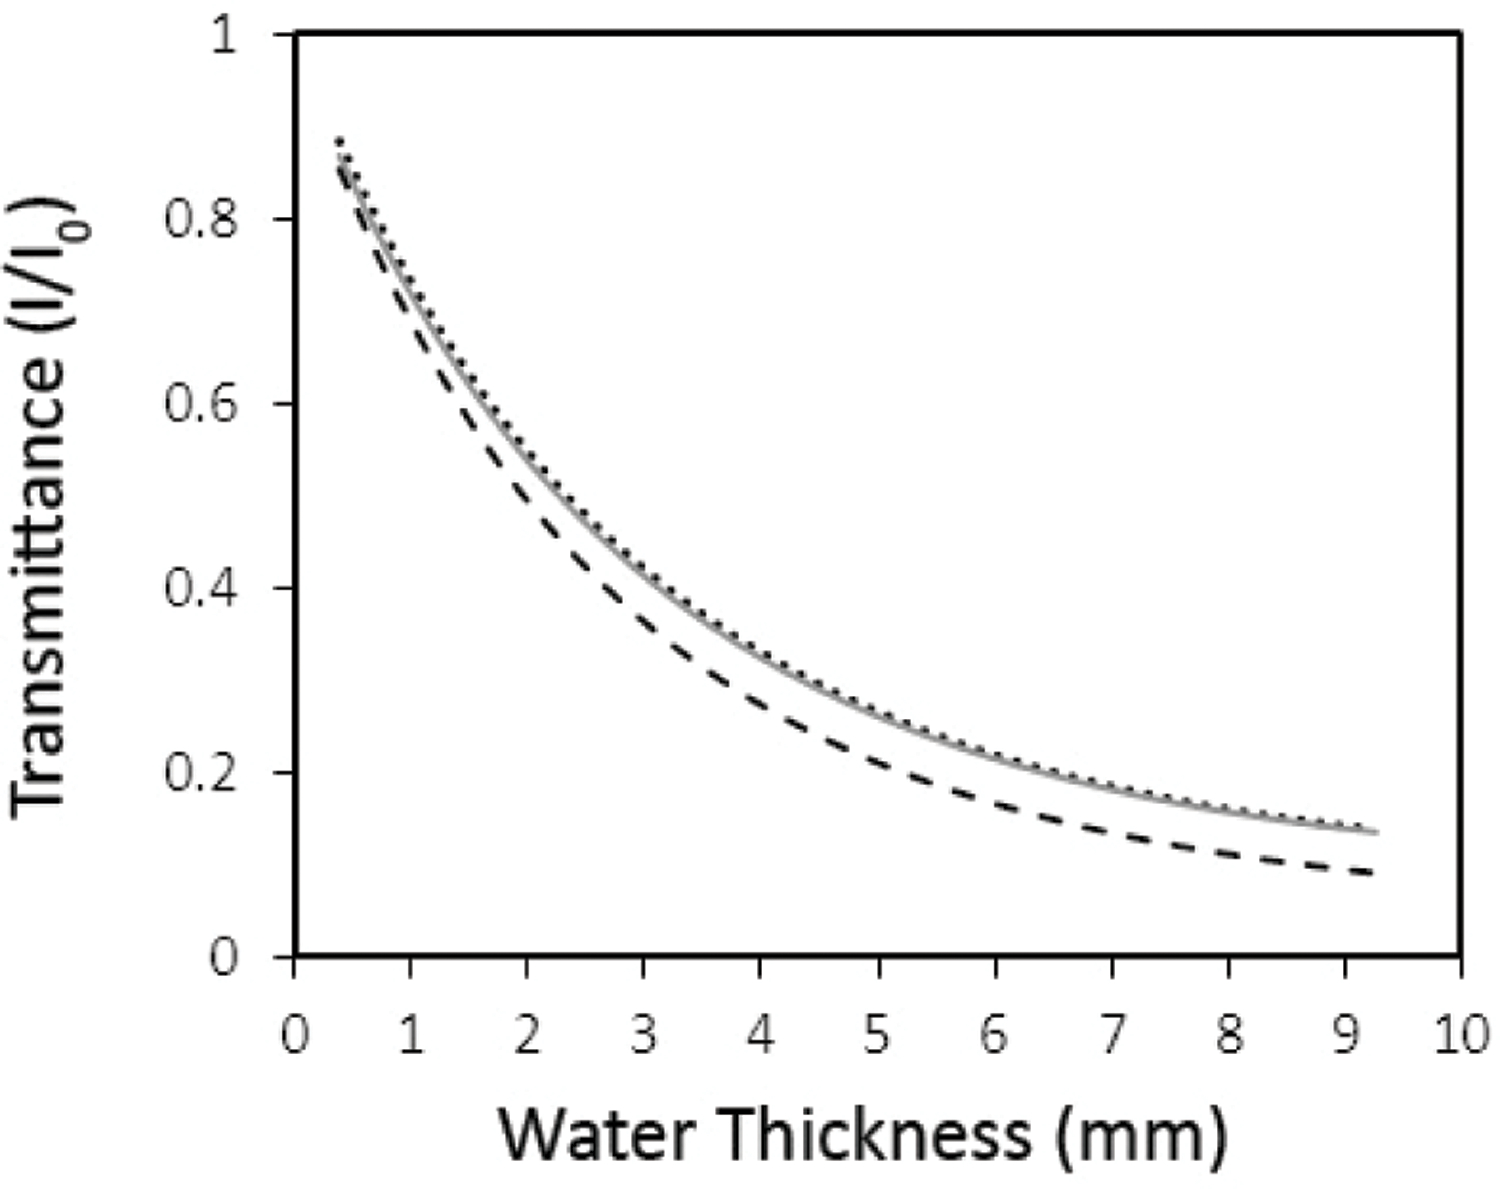
Transmittance as a function of water thickness predicted using the attenuation coefficients for water, silica sand, and Al in Eq. [1] and [3] (dotted line: water; gray line: water and Al; dashed line: water, Al, and silica sand).
Because of the effect of the attenuation of silica sand in the oven-dry sample, the neutron imaging water content values were corrected on a pixel-by-pixel basis by subtracting the oven-dry pixel field from the water content fields for each drying or wetting matric potential. The corrected volumetric water contents, θcorrected, showed much better agreement with the volumetric water contents measured by the hanging water column method (Fig. 2b); however, the wet ends of the drying and wetting curves were slightly underestimated (Fig. 2b; Table 1). There was also an anomalous central zone of underestimated water contents within the corrected water content field for the fully saturated sample (Fig. 4). We believe this phenomenon is due to both scattering effects (Hassanein et al., 2005, 2006a, 2006b; Hussey et al., 2010) and not correcting the images for the point spread function of the detector. Until a better solution for this detector system is developed, we decided to effectively remove this phenomenon by working with relative saturations instead of volumetric water contents. This approach limits the ability of neutron imaging to quantify soil hydraulic properties but only slightly because it is relatively easy to obtain accurate estimates of the saturated water content using traditional methods such as calculation from the bulk and particle densities.
Fig. 4.
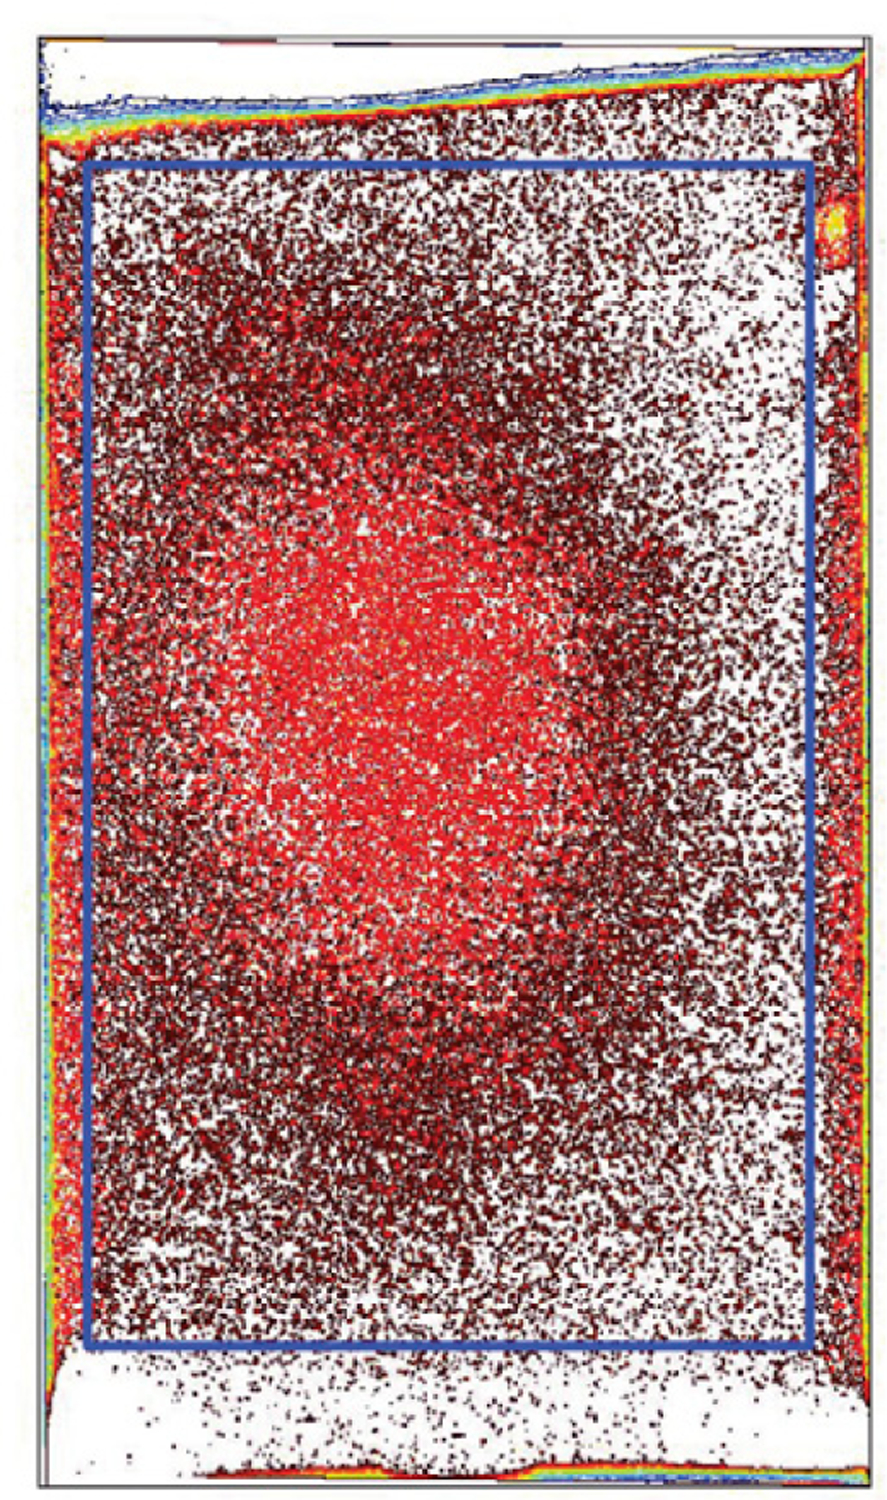
Contour map of corrected volumetric water contents at saturation, showing the effects of scattering in the center of the column. The superimposed rectangle designates the region of interest used for averaging each image at different matric potentials.
Relative saturations were calculated on a pixel-by-pixel basis as described above. Inspection of the resulting S fields for the saturated and satiated states revealed homogeneous values of unity as expected (data not shown). Once the matric potential decreased below the air-entry value during drainage, the S fields became more heterogeneous, with air progressively displacing pore water from the top of the column downward (Fig. 5). Local variations in the position of the drying front are clearly visible at each matric potential. Eventually, the images became relatively homogenous again as the entire sand pack was completely drained. It can be clearly seen in Fig. 5 that the filter paper phase barrier at the bottom of the sand column always remained fully saturated regardless of the imposed matric potential. Similar results (not shown) were obtained for water displacing air from the bottom of the column during rewetting.
Fig. 5.
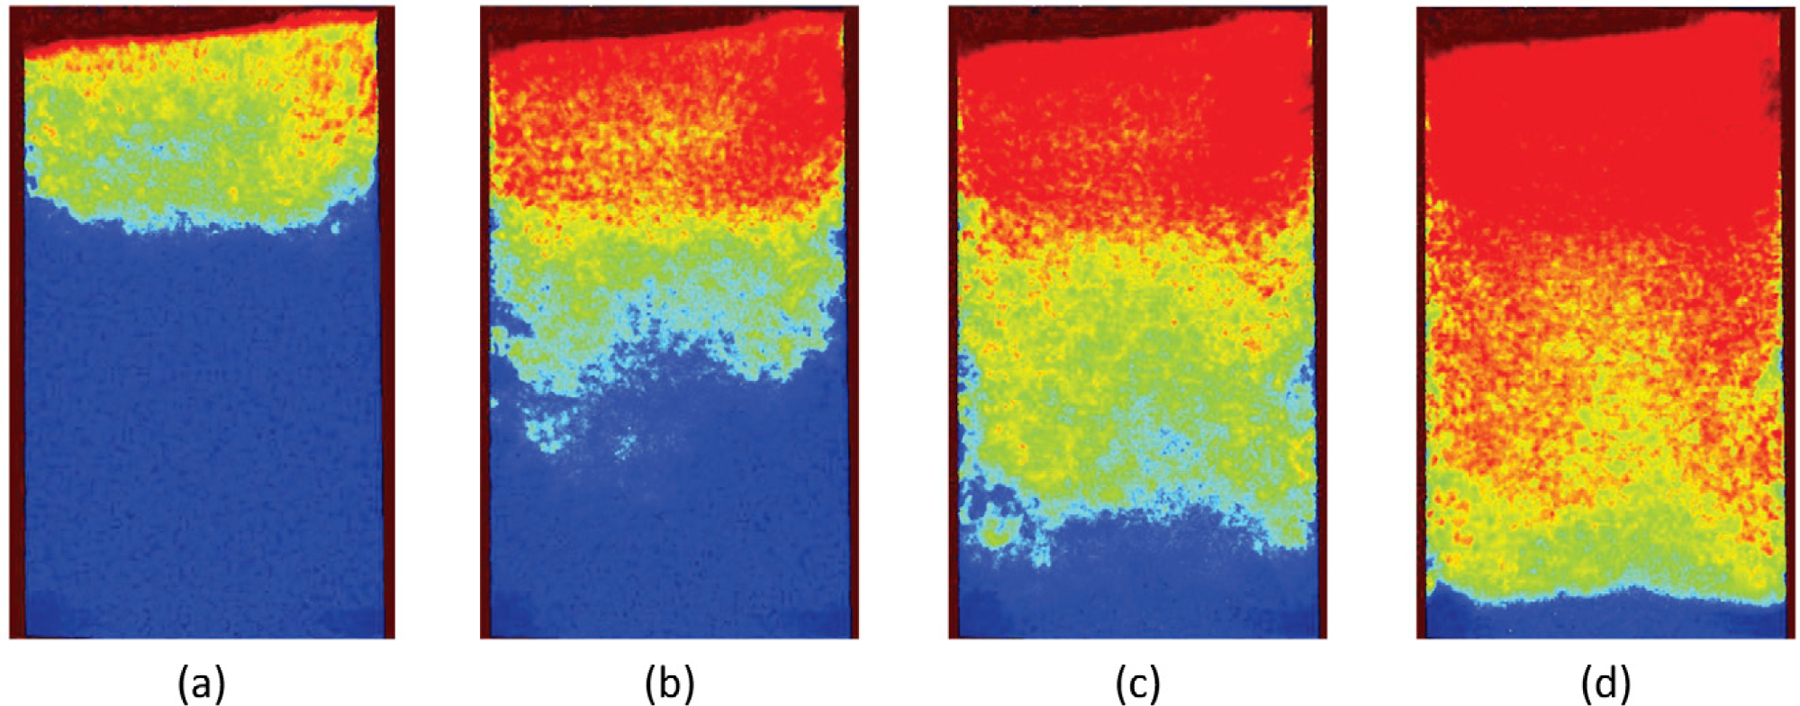
Relative saturation images (1 = blue, 0 = red) for basal matric potentials of (a) −15.61, (b) −18.47, (c) −20.37, and (d) −21.80 cm in a drying sequence. Note that the filter paper phase barrier at the bottom of the sand column remained fully saturated throughout the drainage process.
Average relative saturations for the neutron radiography images were computed by averaging all of the Sij values within the region of interest (ROI) indicated by the rectangle in Fig. 4. This ROI was selected to maximize the column area available for averaging while excluding any edge effects and surface variations. The resulting average relative saturations showed very good agreement with those obtained volumetrically from the hanging water column experimental data (Fig. 2c). Notice, however, that there was a slight tendency for the neutron imaging to overestimate at low relative saturations.
The VG equation was fitted to the drying and wetting S curves simultaneously for both the neutron imaging data (average values) and the hanging water content data (all replicate measurements pooled). In both cases, rapid convergence was achieved according to the SAS default criterion. The RMSEs for the neutron radiography and hanging water column fits were 0.027 and 0.063, respectively. The R2 values obtained between the predicted and observed data points (shown in Fig. 6) were 0.994 and 0.973 for the neutron radiography and hanging water column data sets, respectively.
Fig. 6.
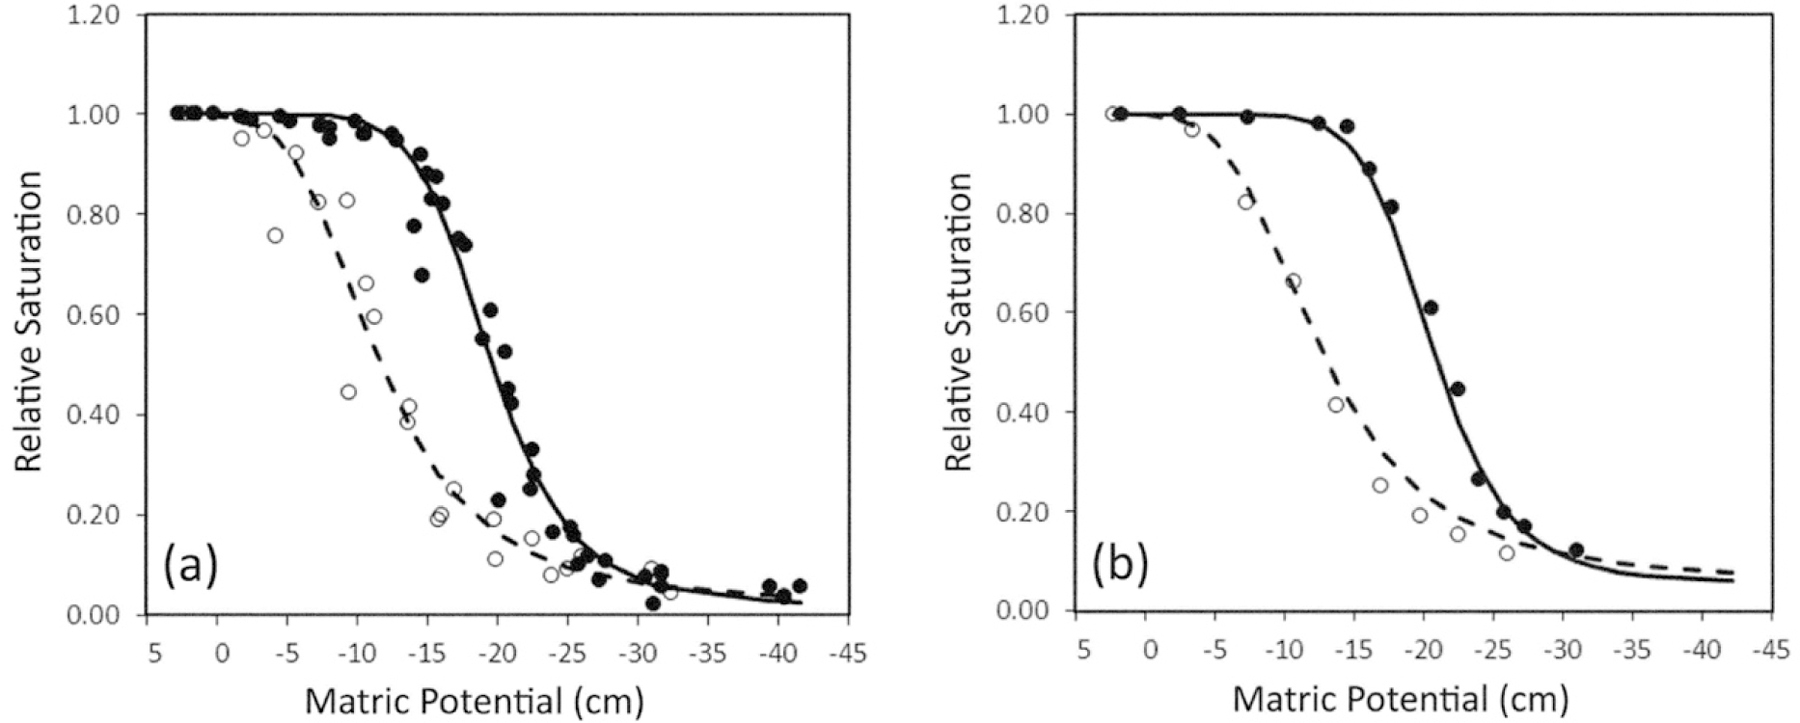
Measured average relative saturation values (closed circle: drying, open circle: wetting) and fitted van Genuchten (1980) functions (solid line: drying, dashed line: wetting) for (a) the hanging water column experiments (data for all replicates pooled) and (b) the unreplicated neutron imaging experiments. The 95% confidence intervals for individual points are not shown because they were smaller (≤0.032) than the symbols used.
The resulting VG parameter estimates are given in Table 2 along with their approximate 95% confidence intervals. Both data sets revealed differences in the α and n parameters due to hysteresis; α was lower and n was higher for drying than for wetting. In general, the VG parameter estimates from the neutron imaging method were very similar to those from the hanging water column experiments. The worst correspondence was observed between the Sr estimates for the two different methods (0.019 vs. 0.057 for the hanging water column and neutron radiography methods, respectively). The relatively large confidence band around the radiography estimate of Sr can be attributed to the sparsity of data at very negative matric potentials in the unreplicated neutron imaging experiment compared with the replicated hanging water column experiments (Fig. 6). Additional measurements at the dry end in future neutron imaging experiments will probably resolve this discrepancy.
Table 2.
Estimates of thevan Genuchten (1980) equation parameters for the hanging water column and neutron imaging methods.
| Parameter estimate† | Hanging water column | 95% CI |
Neutron imaging | 95% CI |
||
|---|---|---|---|---|---|---|
| Lower | Upper | Lower | Upper | |||
| S r | 0.019 | −0.027 | 0.065 | 0.057 | −0.018 | 0.131 |
| α (wetting), cm−1 | 0.097 | 0.089 | 0.105 | 0.089 | 0.082 | 0.096 |
| n (wetting) | 4.366 | 3.535 | 5.197 | 4.276 | 3.440 | 5.111 |
| α (drying), cm−1 | 0.053 | 0.051 | 0.054 | 0.050 | 0.048 | 0.051 |
| n (drying) | 8.127 | 6.829 | 9.426 | 9.010 | 7.283 | 10.737 |
Sr, residual saturation; α, parameter inversely related to the air-or water-entry values; n, shape parameter influenced by the pore-size distribution.
Based on statistical comparison of the mean VG parameter values from the individual fits with the single VG parameter estimates from the neutron imaging data using one-sample t-tests, there were no significant differences at P < 0.05 between the neutron radiography and hanging water column methods for any of the VG parameter estimates. Our results indicate that the neutron imaging technique fully reproduces the hysteretic characteristics of this material and can be confidently utilized to quantify average relative saturations. The real benefit of using neutron imaging, however, is its ability to see into the “black box” of the mineral matrix and to quantify soil hydraulic properties on a point (or pixel-by-pixel) basis. Neutron imaging of a range of natural soils would also be beneficial to the soil science community; such an application, however, will require additional detailed calibrations to account for the presence of H in organic matter.
CONCLUSIONS
We have presented a methodology for using neutron radiography to quantify relative saturations in a coarse-grained silica sand (Flint no. 13). Extension of this nondestructive testing method to porous media with significant organic matter will require additional calibrations to account for the presence of H in the organic matter. The method was applied to measure soil water retention curves under quasi-equilibrium drying and wetting conditions. Normalizing the acquired neutron images relative to the open beam pixel field tended to systematically overestimate water contents due to the small attenuation produced by the silica sand. These overestimations were removed by subtracting the oven-dry pixel field from the water content fields. In addition, scattering anomalies at high water contents were eliminated by dividing the corrected drying and wetting water content fields by the corrected fields at saturation and satiation, respectively. Averaging the resulting relative saturation values for each imposed matric potential produced an approximate 1:1 relationship with average relative saturations measured volumetrically using the hanging water column method.
The van Genuchten equation provided an excellent fit to both of the average relative saturation data sets. The Flint no. 13 sand exhibited pronounced hysteresis, with values of the α and n VG parameters for the main drying branch approximately half and twice the magnitude, respectively, of those for the main wetting branch. There were no statistical differences between the VG parameters estimated by the two different methods, indicating that neutron imaging is a reliable method for determining the average soil water retention curve. Additionally, neutron imaging can be used to investigate small-scale local variations in hydraulic properties within a soil column. This topic will be the subject of a future study.
ACKNOWLEDGMENTS
This Research was financially supported by the Laboratory Directed Research and Development (LDRD) Program of Oak Ridge National Laboratory and the Joint Directed Research and Development ( JDRD) Program of the University of Tennessee UT-ORNL Science Alliance. We thank Keely Willis of the University of Wisconsin-Madison for her contributions made at the early stage of the image analyses. We acknowledge the support of the National Institute of Standards and Technology, U.S. Department of Commerce, in providing the neutron research facilities used in this work.
Abbreviations:
- NIST
National Institute of Standards and Technology
- VG
van Genuchten
Footnotes
Certain trade names and company products are mentioned in the text or identified in an illustration to adequately specify the experimental procedure and equipment used. In no case does such identification imply recommendation or endorsement by the National Institute of Standards and Technology nor does it imply that the products are necessarily the best available for the purpose.
Contributor Information
C. L. Cheng, Dep. of Earth and Planetary Sciences, Univ. of Tennessee, Knoxville, TN 37996.
M. Kang, Dep. of Earth and Planetary Sciences, Univ. of Tennessee, Knoxville, TN 37996
E. Perfect, Dep. of Earth and Planetary Sciences, Univ. of Tennessee, Knoxville, TN 37996
S. Voisin, Chemical and Engineering Materials Division, Oak Ridge National Lab., Oak Ridge, TN 37831
J. Horita, Dep. of Geosciences, Texas Tech Univ., Lubbock, TX 79409
H. Z. Bilheux, Chemical and Engineering Materials Division, Oak Ridge National Lab., Oak Ridge, TN 37831
J. M. Warren, Environmental Sciences Division, Oak Ridge National Lab., Oak Ridge, TN 37831
D. L. Jacobson, Physical Measurement Lab., National Institute of Standards and Technology, Gaithersburg, MD 20899
D. S. Hussey, Physical Measurement Lab., National Institute of Standards and Technology, Gaithersburg, MD 20899
REFERENCES
- Al-Yahyai R, Schaffer B, Davies FS, and Muñoz-Carpena R. 2006. Characterization of soil-water retention of a very gravelly loam soil varied with determination method. Soil Sci 171:85–93. doi: 10.1097/01.ss.0000187372.53896.9d [DOI] [Google Scholar]
- Anderson IS, McGreevy R, and Bilheux H. 2009. Neutron imaging and applications: A reference for the imaging community Springer, New York. [Google Scholar]
- Andreu L, Hopmans JW, and Schwankl LJ. 1997. Spatial and temporal distribution of soil water balance for a drip-irrigated almond tree. Agric. Water Manage 35:123–146. doi: 10.1016/S0378-3774(97)00018-8 [DOI] [Google Scholar]
- Bayer A, Vogel H-J, and Roth K. 2004. Direct measurement of the soil water retention curve using x-ray absorption. Hydrol. Earth Syst. Sci 8:2–7. doi: 10.5194/hess-8-2-2004 [DOI] [Google Scholar]
- Belcher DJ, Cuykendall TR, and Sack HS. 1950. The measurement of soil moisture and density by neutron and gamma-ray scattering. Tech. Dev. Rep 127. Civ. Aeronaut. Admin., Washington, DC. [Google Scholar]
- Berger H 1971. Neutron radiography. Annu. Rev. Nucl. Sci 21:335–364. doi: 10.1146/annurev.ns.21.120171.002003 [DOI] [Google Scholar]
- Chanasyk DS, and Naeth MA. 1996. Field measurement of soil moisture using neutron probes. Can. J. Soil Sci 76:317–323. doi: 10.4141/cjss96-038 [DOI] [Google Scholar]
- Chaouki J, Larachi F, and Dudukovic MP. 1997. Noninvasive tomographic and velocimetric monitoring of multiphase flow. Ind. Eng. Chem. Res 36:4476–4503. doi: 10.1021/ie970210t [DOI] [Google Scholar]
- Chen Q, and Balcom BJ. 2005. Measurement of rock-core capillary pressure curves using a single-speed centrifuge and one-dimensional magnetic-resonance imaging. J. Chem. Phys 122:214720–214727. doi: 10.1063/1.1924547 [DOI] [PubMed] [Google Scholar]
- Cnudde V, Dierick M, Vlassenbroeck J, Masschaele B, Lehmann E, Jacobs P, and Van Hoorebeke L. 2008. High-speed neutron radiography for monitoring the water absorption by capillarity in porous materials. Nucl. Instrum. Methods Phys. Res. B 266:155–163. doi: 10.1016/j.nimb.2007.10.030 [DOI] [Google Scholar]
- Dane JH, and Hopmans JW. 2002. Hanging water column. In: Dane JH and Topp GC, editors, Methods of soil analysis. Part 4. Physical methods. SSSA Book Ser 5. SSSA, Madison, WI. p. 680–683 [Google Scholar]
- Dane JH, Oostrom M, and Missildine BC. 1992. An improved method for the determination of capillary pressure–saturation curves involving TCE, water and air. J. Contam. Hydrol 11:69–81. doi: 10.1016/0169-7722(92)90034-C [DOI] [Google Scholar]
- Deinert MR, Parlange J-Y, Steenhuis T, Throop J, Ünlü K, and Cady KB. 2004. Measurement of fluid contents and wetting front profiles by real-time neutron radiography. J. Hydrol 290:192–201. doi: 10.1016/j.jhydrol.2003.11.018 [DOI] [Google Scholar]
- El Abd A, Czachor A, and Milczarek J. 2009. Neutron radiography determination of water diffusivity in fired clay brick. Appl. Radiat. Isot 67:556–559. doi: 10.1016/j.apradiso.2008.11.014 [DOI] [PubMed] [Google Scholar]
- Gardner W, and Kirkham D. 1952. Determination of soil moisture by neutron scattering. Soil Sci 73:391–402. doi: 10.1097/00010694-195205000-00007 [DOI] [Google Scholar]
- Hassanein R, de Beer F, Kardjilov N, and Lehmann E. 2006a. Scattering correction algorithm for neutron radiography and tomography tested at facilities with different beam characteristics. Physica B 385–386:1194–1196. doi: 10.1016/j.physb.2006.05.406 [DOI] [Google Scholar]
- Hassanein R, Lehmann E, and Vontobel P. 2005. Methods of scattering corrections for quantitative neutron radiography. Nucl. Instrum. Methods Phys. Res. Sect. A 542:353–360. [Google Scholar]
- Hassanein R, Meyer HO, Carminati A, Estermann M, Lehmann E, and Vontobel P. 2006b. Investigation of water imbibitions in porous stone by thermal neutron radiography. J. Phys. D: Appl. Phys 39:4284–4291. doi: 10.1088/0022-3727/39/19/023 [DOI] [Google Scholar]
- Heller AK, Shi L, Brenizer JS, and Mench MM. 2009. Initial water quantification results using neutron computed tomography. Nucl. Instrum. Methods Phys. Res. A 605:99–102. doi: 10.1016/j.nima.2009.01.166 [DOI] [Google Scholar]
- Hincapié I, and Germann P. 2009. Gravity-driven viscous flow in sand boxes assessed with neutron radiography. Vadose Zone J 8:891–901. doi: 10.2136/vzj2009.0003 [DOI] [Google Scholar]
- Hincapié I, and Germann P. 2010. Water content wave approach applied to neutron radiographs of finger flow. Vadose Zone J 9:278–284. doi: 10.2136/vzj2009.0102 [DOI] [Google Scholar]
- Hussey DS, Jacobson DL, Coakley KJ, Vecchia DF, and Arif M. 2010. In situ fuel cell water metrology at the NIST-NCNR neutron imaging facility. J. Fuel Cell Sci. Technol 7(2):021024. doi: 10.1115/1.3007898 [DOI] [Google Scholar]
- Kim F, Penumadu D, and Hussey DS. 2011. Water distribution variation in partially saturated granular materials using neutron imaging. J. Geotech. Geoenviron. Eng 138:147. doi: 10.1061/(ASCE)GT.1943-5606.0000583 [DOI] [PMC free article] [PubMed] [Google Scholar]
- Lewis JT, and Krinitzsky EL. 1976. Neutron radiation in the study of soil and rock. In: Berger H (editor) Practicial applications of neutron radiography and gaging. ASTM STP 586. Am. Soc Testing Mat., W. Conshohocken, PA. p. 241–251. [Google Scholar]
- Mukundan R, and Borup RL. 2009. Visualizing liquid water in PEM fuel cells using neutron imaging. Fuel Cells 9:499–505. doi: 10.1002/fuce.200800050 [DOI] [Google Scholar]
- Oswald SE, Menon M, Carminati A, Vontobel P, Lehmann E, and Schulin R. 2008. Quantitative imaging of infiltration, root growth, and root water uptake via neutron radiography. Vadose Zone J 7:1035–1047. doi: 10.2136/vzj2007.0156 [DOI] [Google Scholar]
- Reynolds WD, and Elrick DE. 2002. Constant head soil core (tank) method. In: Dane JH and Topp GC, editors, Methods of soil analysis. Part 4. Physical methods. SSSA Book Ser 5. SSSA, Madison, WI. p. 804–808. [Google Scholar]
- Riley GV, Hussey DS, and Jacobson D. 2009. In situ neutron imaging of alkaline and lithium batteries. Electrochem. Soc. Trans 25(35):75–83. [Google Scholar]
- Schmugge TJ, Jackson TJ, and McKim HL. 1980. Survey of methods for soil moisture determination. Water Resour. Res 16:961–979. doi: 10.1029/WR016i006p00961 [DOI] [Google Scholar]
- Strobl M, Manke I, Kardjilov N, Hilger A, Dawson M, and Banhart J. 2009. Topical Review: Advances in neutron radiography and tomography. J. Phys. D Appl. Phys 42(24):243001. doi: 10.1088/0022-3727/42/24/243001 [DOI] [Google Scholar]
- Trabold TA, Owejan JP, Gagliardo JJ, Jacobson DL, Hussey DS, and Arif M. 2009. Use of neutron imaging for proton exchange membrane fuel cell (PEMFC) performance analysis and design. In: Vielstich W et al. , editors, Handbook of fuel cells: Advances in electrocatalysis, materials, diagnostics and durability Vol. 5 & 6. John Wiley & Sons, Chichester, UK. p. 658–672. [Google Scholar]
- Tumlinson LG, Liu H, Silk WK, and Hopmans JW. 2008. Thermal neutron computed tomography of soil water and plant roots. Soil Sci. Soc. Am. J 72:1234–1242. doi: 10.2136/sssaj2007.0302 [DOI] [Google Scholar]
- U.S. Silica Company. 2009. Product data sheet: Whole grain silica U.S. Silica Co., Berkeley Springs, WV. [Google Scholar]
- Vasin M, Lehmann P, Kaestner A, Hassanein R, Nowak W, Helmig R, and Neuweiler I. 2008. Drainage in heterogeneous sand columns with different geometric structures. Adv. Water Resour 31: 1205–1220. doi: 10.1016/j.advwatres.2008.01.004 [DOI] [Google Scholar]
- van Genuchten M.Th. 1980. A closed-form equation for predicting the hydraulic conductivity of unsaturated soils. Soil Sci. Soc. Am. J 44:892–898. doi: 10.2136/sssaj1980.03615995004400050002x [DOI] [Google Scholar]


