

Abstract
There are conflicting results regarding how APOE genotype, the strongest genetic risk factor for Alzheimer’s disease (AD), influences spatial and longitudinal amyloid-β (Aβ) deposition and its impact on the selection of biomarker cut-points. In our study, we sought to determine the impact of APOE genotype on cross-sectional and longitudinal florbetapir positron emission tomography (PET) amyloid measures and its impact in classification of patients and interpretation of clinical cohort results. We included 1,019 and 1,072 Alzheimer’s Disease Neuroimaging Initiative participants with cerebrospinal fluid Aβ1–42 and florbetapir PET values, respectively. 623 of these subjects had a second florbetapir PET scans two years after the baseline visit. We evaluated the effect of APOE genotype on Aβ distribution pattern, pathological biomarker cut-points, cross-sectional clinical associations with Aβ load, and longitudinal Aβ deposition rate measured using florbetapir PET scans. 1) APOE ε4 genotype influences brain amyloid deposition pattern; 2) APOE ε4 genotype does not modify Aβ biomarker cut-points estimated using unsupervised mixture modeling methods if white matter and brainstem references are used (but not when cerebellum is used as a reference); 3) findings of large differences in Aβ biomarker value differences based on APOE genotype are due to increased probability of having AD neuropathology and are most significant in mild cognitive impairment subjects; and 4) APOE genotype and age (but not gender) were associated with increased Aβ deposition rate. APOE ε4 carrier status affects rate and location of brain Aβ deposition but does not affect choice of biomarker cut-points if adequate references are selected for florbetapir PET processing.
Keywords: Alzheimer’s disease, amyloid-β, cerebrospinal fluid, diagnosis, mild cognitive impairment, positron emission tomography
INTRODUCTION
The presence of the apolipoprotein E gene (APOE) ε4 allele is considered to be the strongest sporadic genetic risk factor for Alzheimer’s disease (AD). The presence of one or two APOE ε4 allele copies leads to earlier amyloid-β (Aβ) deposition as measured by cerebrospinal fluid (CSF) and positron emission tomography (PET) Aβ biomarkers [1, 2], but not to brain structural changes in the preclinical disease phase [3]. In addition, CSF Aβ1–42 decrease seems to precede an increase in Aβ PET standardized uptake value ratio (SUVR) [4], although CSF and PET Aβ measures show a high agreement to classify healthy and cognitively impaired subjects based on amyloid pathology [5, 6].
Previous studies have reported that APOE genotype modifies the association between CSF Aβ1–42 values and PET SUVRs in the same subjects [6, 7]. This could indicate that based on the APOE genotype brain amyloid deposition is captured differently by these two different Aβ amyloid biomarkers. The gold standard to assess amyloid brain deposition is through neuropathology and several studies have shown that CSF Aβ1–42 values [8] and Aβ PET measures [9] are strongly correlated with brain amyloid deposits. However, there are no large studies with CSF and PET amyloid measures obtained at the same time, close to time of death, and with quantitative neuropathological brain amyloid deposition assessment.
In addition, even if the association between APOE genotype and AD risk has been consistently replicated, the results regarding its association with biomarker measures are conflicting. The results in clinically diagnosed AD subjects on the effects of APOE genotype on Aβ PET burden [10–13] are inconsistent, and there is additional conflicting data on how APOE ε4 carrier status affects the overall Aβ burden and deposition in cognitively impaired subjects [11, 14–16]. Contradictory results could be related to sample selection, analytical methods, and the disease stage at which patients are recruited. Finally, there is limited evidence on spatial differences in APOE-related Aβ PET distribution patterns, based on small samples of clinically diagnosed AD subjects [12, 13]. For all of the analyses, it is important to account for age in the model of biomarker changes, since age is the strongest demographic AD risk factor. This important adjustment for dementia biomarker research would call for studies with larger sample sizes and detailed imaging as well as genotyping approaches.
Based on the described conflicting results, we aimed to investigate in a large biomarker cohort with longitudinal CSF and PET Aβ biomarkers measurements if APOE genotype differentially affects: 1) Aβ spatial distribution patterns, 2) Aβ biomarker cut-points, 3) Aβ burden in the different clinically defined groups, and 4) Aβ PET deposition rate.
MATERIAL AND METHODS
Subjects
1,396 Alzheimer’s Disease Neuroimaging Initiative (ADNI) participants with CSF Aβ1–42 (n = 1,019) and/or florbetapir PET scans (n = 1,072) were included in this study (Table 1). Cognitively normal (CN) subjects with and without subjective memory complaints were analyzed together in the same group. A diagnosis of mild cognitive impairment (MCI) and AD was established as previously described [17]. Data was downloaded August 2015. The ADNI has been extensively reviewed elsewhere [18] (http://www.adni-info.org and Supplementary Methods).
Table 1.
Demographics of the sample
| Participants (n = 1,396) | |
|---|---|
|
| |
| CSF Aβ1–42 (%) | 73.0% |
| PET scan (%) | 76.8% |
| Age at baseline (y)a | 73.3 (7.2) |
| Gender (% male) | 55.4% |
| Diagnosis | 330 CN no SMC |
| 103 SMC | |
| 667 MCI | |
| 296 AD | |
| APOE ε4 carriers (%) | 54.9% |
| AV-45 Average CBb | 1.25 (1.13–1.51) |
| AV-45 Average WMb | 0.71 (0.65–0.84) |
| AV-45 Summary CBb | 1.13 (1.01–1.39) |
| AV-45 Summary Compositeb | 0.80 (0.71–0.99) |
| Aβ1–42 (pg/mL)b | 157.5 (130.0–220.0) |
AD, Alzheimer disease; CB, cerebellum; CN, cognitively normal; CSF, cerebrospinal fluid; Coef., coefficient; MCI, mild cognitive impairment; SE, standard deviation; WM, white matter.
Standard protocol approvals, registrations, and patient consents
Protocols were submitted to Institutional Review Boards for each participating location and their written unconditional approval obtained and submitted to Regulatory Affairs at the ADNI Coordinating Center (ADNI-CC) prior to commencement of the study. Written informed consent for the study was obtained from all subjects and/or authorized representatives.
CSF collection and Aβ1–42 measurement
CSF samples were processed as previously described [19] (http://www.adni-info.org/ and Supplementary Methods). Aβ1–42, was measured using the multiplex xMAP Luminex platform (Luminex Corp, Austin, TX) with Innogenetics (INNO-BIA AlzBio3; Ghent, Belgium; for research use–only reagents) immunoassay kit–based reagents.
Florbetapir PET scans processing
As previously described [6], we included florbetapir adjusted SUVRs developed in two different laboratories, i.e., the University of Utah (UU) and the University of California (UC) Berkeley.
The UU laboratory processed images using 3-dimensional stereotactic surface projections computed using Neurostat [20]. PET scans were downloaded from LONI using the post-processed group 4 images, i.e., coregistered and averaged frames, standardized image orientation and voxel size, and uniform resolution smoothed to 8 mm. Neurostat aligned the brain images along the AC-PC line and non-linearly warped the image into standard Talairach space. Longitudinal scans, for each subject, were coregistered to the baseline scan and a multi-step normalization was used to create a mean template. A peak pixel template was created from the mean template and applied to intra-subject serial scans to produce surface projection maps, SSPs. Neurostat pre-defined brain regions in Talairach space were used to calculate the ROI regional values based on the SSP maps. Florbetapir images were normalized using both cerebellar and white matter (WM) values. Neurostat automatically defined the averaged cerebellar value. WM values were determined by sampling pixels from the amyloid image, in Talairach-space, starting at a much greater depth, thus bypassing the cortical ribbon. The Neurostat generated global value was used for the whole brain WM value. Averaged regional values from medial and lateral frontal, temporal and parietal cortices were normalized either using the cerebellum (CB) or WM as reference regions, to obtain the average CB and WM measures, respectively.
UC Berkeley laboratory used SPM5 software to co-register the florbetapir PET scans with the corresponding MRI scans, that previously were segmented and parcellated with Freesurfer (v 4.5) as described [21]. Fully pre-processed format (series description in LONI Advanced Search: “AV45 Coreg, Avg, Std Img and Vox Siz, Uniform Resolution”) were downloaded. Each subject’s first florbetapir image was coregistered using SPM5 to that subject’s MRI image (series description: ADNI 1scans *N3;* and ADNI GO/2 scans *N3*) that was closest in time to the florbetapir scan. Freesurfer processing was carried out to skull-strip, segment, and delineate cortical and subcortical regions in all MRI scans. The UC Berkeley laboratory estimated florbetapir means from grey matter in subregions were extracted within 4 large regions (frontal, anterior/posterior cingulate, lateral parietal, lateral temporal) [22]. Conventional (nonweighted) average of whole CB was selected as reference for the summary CB measure. Means from three Freesurfer-defined reference regions (whole CB, brainstem/pons, and eroded subcortical WM) were selected as reference for the summary composite measure. In addition, uptake values for 19 regions of interest (ROIs) in each brain hemispheres were estimated using Freesurfer software defined areas [23], and normalized using whole CB and composite reference.
623 and 621 participants had a second scan processed after a two-year follow-up at the UU and UC Berkeley laboratories, respectively.
Statistical analysis
Cut-points were estimated using an unsupervised mixture modeling approach that empirically estimates the presence of different populations in the data [6, 24]. To compare the cut-points between the APOE ε4 carrier and non-carrier groups, we calculated 1,000 bootstrapped samples with replacement for each APOE group and calculated the cut-point in each of the 1,000 bootstrapped samples. Linear regression models were applied to analyze associations with quantitative variables, as was the case of the comparison of amyloid burden in the different ROIs. Power transformations were applied as needed to normalize data distributions. A squared SUVR term was included to account for the nonlinear rate of amyloid deposition. False discovery rate (FDR) Benjamini-Hochberg correction was applied when multiple non hypothesis-based comparisons were performed. Results were considered significant if two-tailed p-values were ≤0.05. Analyses were performed using R v. 3.2.2.
RESULTS
Florbetapir PET deposition patterns based on APOE genotype
APOE ε4 carriers showed higher amyloid burden in all studied PET ROIs compared to non-carriers in analyses adjusted for age and clinical diagnosis (p < 0.0001 for all areas). However, when adjusting for total amyloid burden instead of clinical diagnosis, APOE ε4 non-carriers showed higher adjusted SUVRs for both CB and composite summary in two of the three parietal lobe regions compared to APOE ε4 carriers who showed higher adjusted SUVRs in anterior cingulate and frontal regions (Table 2).
Table 2.
Differences in florbetapir PET adjusted SUVRs based on APOE ε4 in models adjusted for total amyloid load. Positive coefficients indicate higher amyloid burden in ε4 carriers, whereas negative coefficients represent higher amyloid burden in ε4 non-carriers
| Whole cerebellum normalized ROIs |
Composite reference normalized ROIs |
|||
|---|---|---|---|---|
| Coefficient | p | Coefficient | p | |
|
| ||||
| Rostral anterior cingulate | 0.029 | <0.0001 | 0.027 | <0.0001 |
| Medial Orbitofrontal region | 0.023 | <0.0001 | 0.019 | <0.0001 |
| Caudal anterior cingulate | 0.014 | 0.014 | 0.019 | <0.0001 |
| Superior parietal lobe | −0.013 | 0.021 | −0.015 | 0.0009 |
| Rostral middle frontal | 0.019 | <0.0001 | 0.012 | 0.0014 |
| Supramarginal gyrus | −0.011 | 0.0014 | −0.009 | 0.0031 |
| Inferior parietal gyrus | −0.005 | 0.38 | −0.009 | 0.031 |
| Superior frontal gyrus | 0.009 | 0.019 | 0.006 | 0.036 |
| Middle temporal region | 0.000 | 0.96 | −0.006 | 0.12 |
| Lateral orbitofrontal region | 0.003 | 0.73 | 0.006 | 0.16 |
| Pars orbitalis | −0.001 | 0.96 | −0.005 | 0.54 |
| Isthmus cingulate | 0.001 | 0.96 | 0.003 | 0.54 |
| Pars triangularis | −0.004 | 0.42 | −0.002 | 0.71 |
| Pars opercularis | −0.006 | 0.18 | −0.002 | 0.76 |
| Caudal middle frontal lobe | −0.001 | 0.93 | −0.001 | 0.81 |
| Superior temporal gyrus | 0.002 | 0.73 | 0.001 | 0.81 |
| Precuneus | 0.003 | 0.72 | −0.001 | 0.81 |
| Frontal pole | 0.011 | 0.29 | −0.002 | 0.81 |
| Posterior cingulate | −0.002 | 0.89 | 0.0003 | 0.94 |
Adjusted for multiple comparisons using False discovery rate (FDR) Benjamini-Hochberg correction.
Unbiased evaluation of Aβ biomarker cut-points based on APOE genotype
The distribution of the 1,000 calculated CSF Aβ1–42 and florbetapir PET cut-points overlapped between APOE ε4 carriers and non-carriers for the CSF Aβ1–42 values and the PET SUVRs when using WM and brainstem as references (average WM and summary composite) (Supplementary Figure 1), which lead to insignificant differences in cut-point values (<0.6%) between genotypes and less than 0.4% of the subjects were reclassified (Supplementary Table 1). Conversely, cut-points for PET indices with CB as reference (average CB and summary CB) showed a non-overlapping distribution, differing 3.2–7.9% based on APOE ε4 carrier status, which led to a reclassification of 2.5 to 5.6% of the participants.
Cross-sectional associations of Aβ biomarker measures
Figure 1A and B depicts the distribution of CSF Aβ1–42 and the summary composite SUVR values in the complete cohort as well as stratified by APOE ε4 carrier status (Supplementary Figure 2 shows all biomarkers). Most of the Aβ biomarker measures showed bimodal distributions for the three groups, although the frequencies, depicted by the height of the peaks, were reversed in APOE ε4 carrier versus non-carrier groups. When further stratified by clinical diagnosis (Fig. 1C–H), subjects diagnosed as MCI and AD had more pathological Aβ biomarker values and presented a higher peak in the pathological range (higher for PET adjusted SUVRs and lower for CSF Aβ1–42 values) than CN participants indicating an increase of amyloid biomarker positivity across diagnostic categories.
Fig. 1.
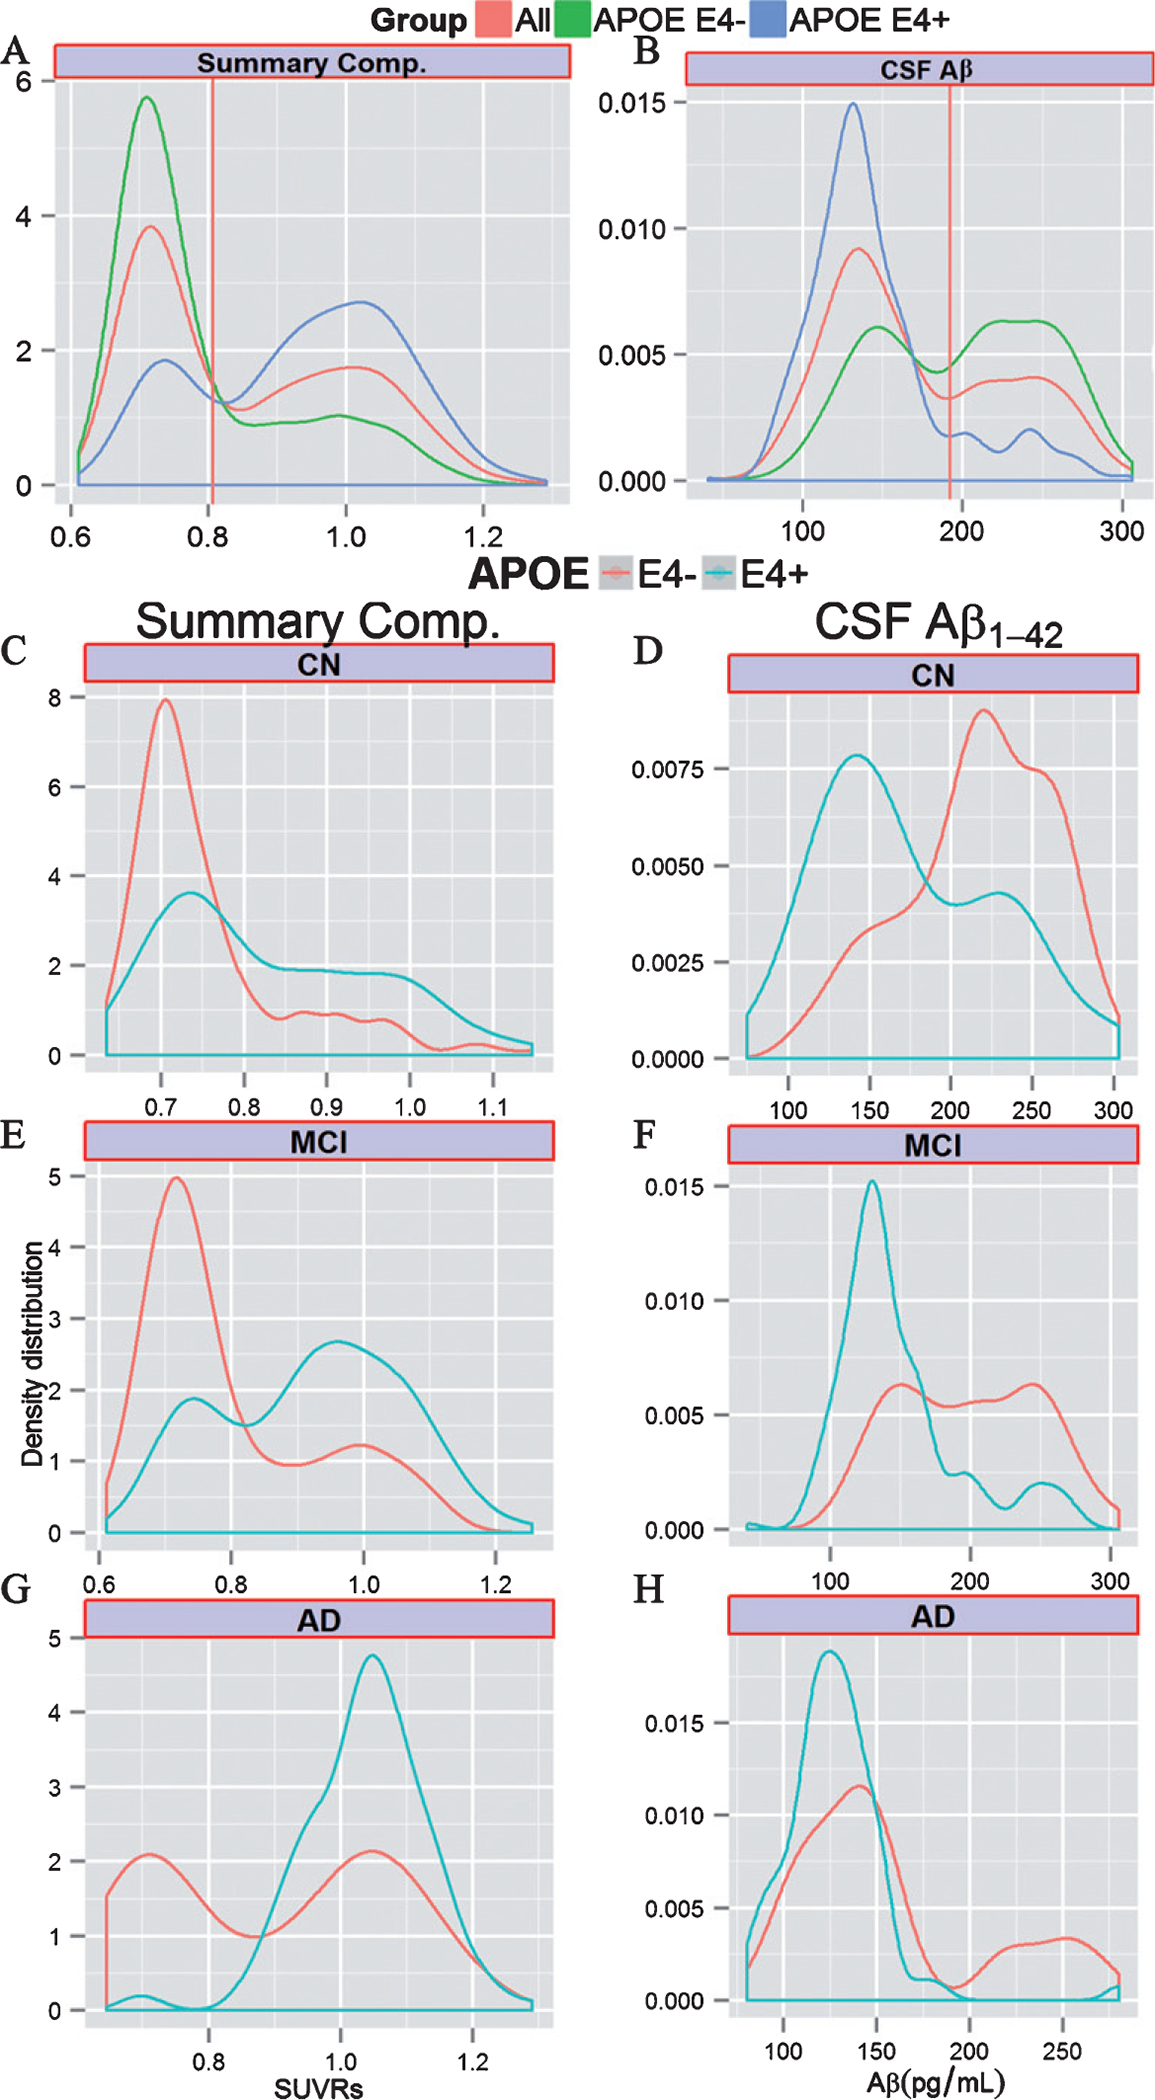
Cross-sectional Aβ biomarker values. Density distribution of Aβ amyloid biomarker values in the whole cohort (red) and stratified by APOE ε4 carrier status (green for non-carriers and blue for carriers) for the summary composite florbetapir (A) and CSF Aβ1–42 values (B). Distribution of summary composite florbetapir and CSF CSF Aβ1–42 values in the different clinical groups in the different clinical groups (C-H). The vertical red line represents the cut-point estimated using the whole sample. CB, cerebellum; CSF, cerebrospinal fluid; WM, white matter.
In a multivariate model, we evaluated the association between different APOE genotypes and Aβ biomarker values (Table 3). Overall the presence of one or more ε4 alleles was associated with increased Aβ burden and the ε2 allele was only associated with a lower amyloid burden in the absence of the ε4 allele. An interaction with clinical diagnosis was observed only in the APOE ε4 carrier/non-carrier model (Supplementary Table 2). Interestingly, AD APOE ε4 non-carriers showed a bimodal distribution of CSF and PET Aβ values that was not present in APOE ε4 carriers, while MCI subjects showed different frequencies of the bimodal distribution peaks based on APOE ε4 carrier status (Fig. 1C–H). Older age and female gender were also associated with pathological Aβ biomarker values.
Table 3.
Association with cross-sectional and longitudinal PET SUVR values
| Cross-sectional associations with PET SUVR values |
||||||||||
| Average CB |
Average WM |
Summary CB |
Summary Comp. |
CSF Aβ1–42 |
||||||
| Coef. (SE) | p | Coef. (SE) | p | Coef. (SE) | p | Coef. (SE) | p | Coef. (SE) | p | |
|
| ||||||||||
| Age (10 y) | 0.032 (0.005) | <0.0001 | 0.060 (0.006) | <0.0001 | 0.027 (0.005) | <0.0001 | 0.037 (0.007) | <0.0001 | −0.007 (0.001) | <0.0001 |
| Gender (Female) | 0.014 (0.008) | 0.069 | 0.023 (0.009) | 0.009 | 0.027 (0.008) | 0.0009 | 0.047 (0.010) | <0.0001 | 0.0009 (0.019) | 0.96 |
| MCI | 0.042 (0.009) | <0.0001 | 0.080 (0.010) | <0.0001 | 0.056 (0.009) | <0.0001 | 0.086 (0.011) | <0.0001 | −0.12 (0.021) | <0.0001 |
| AD | 0.11 (0.014) | <0.0001 | 0.20 (0.013) | <0.0001 | 0.13 (0.012) | <0.0001 | 0.21 (0.015) | <0.0001 | −0.26 (0.030) | <0.0001 |
| APOE ε2/ε2 & ε2/ε3 | −0.022 (0.014) | 0.12 | −0.046 (0.016) | 0.004 | −0.02 (0.015) | 0.12 | −0.05 (0.019) | 0.006 | 0.088 (0.035) | 0.012 |
| APOE ε2/ε4 | 0.11 (0.03) | <0.0001 | 0.11 (0.032) | 0.0006 | 0.12 (0.03) | 0.0001 | 0.14 (0.037) | 0.0001 | −0.20 (0.083) | 0.013 |
| APOE ε3/ε4 | 0.092 (0.009) | <0.0001 | 0.12 (0.001) | <0.0001 | 0.11 (0.009) | <0.0001 | 0.14 (0.011) | <0.0001 | −0.22 (0.022) | <0.0001 |
| APOE ε4/ε4 | 0.11 (0.014) | <0.0001 | 0.18 (0.016) | <0.0001 | 0.15 (0.015) | <0.0001 | 0.22 (0.019) | <0.0001 | −0.43 (0.035) | <0.0001 |
|
| ||||||||||
| Longitudinal associations with PET SUVR values |
||||||||||
| Average CB |
Average WM |
Summary CB |
Summary comp. |
|||||||
| Coef. (SE) | p | Coef. (SE) | p | Coef. (SE) | p | Coef. (SE) | p | |||
|
| ||||||||||
| Age (10 y) | 0.0009 (0.003) | 0.75 | 0.0015 (0.0007) | 0.026 | 0.002 (0.002) | 0.38 | 0.0002 (0.00008) | 0.02 | ||
| Gender (Female) | −0.0007 (0.004) | 0.86 | 0.0005 (0.0009) | 0.61 | 0.0006 (0.003) | 083 | 0.0007 (0.001) | 0.53 | ||
| Baseline SUVR | 0.18 (0.086) | 0.036 | 0.20 (0.084) | 0.019 | 0.23 (0.075) | 0.002 | 0.38 (0.053) | <0.0001 | ||
| Baseline SUVR^2 | −0.077 (0.030) | 0.011 | −0.13 (0.055) | 0.017 | −0.10 (0.029) | 0.0009 | −0.21 (0.030) | <0.0001 | ||
| APOE ε2/ε2 & ε2/ε3 | −0.002 (0.007) | 0.75 | −0.002 (0.002) | 0.26 | −0.004 (0.005) | 0.46 | −0.002 (0.002) | 0.36 | ||
| APOE ε2/ε4 | −0.0009 (0.015) | 0.95 | 0.004 (0.004) | 0.27 | −0.04 (0.012) | 0.73 | −0.002 (0.004) | 0.60 | ||
| APOE ε3/ε4 | 0.011 (0.005) | 0.017 | 0.004 (0.001) | 0.0005 | 0.006 (0.004) | 0.11 | 0.003 (0.001) | 0.035 | ||
| APOE ε4/ε4 | 0.024 (0.008) | 0.002 | 0.004 (0.002) | 0.0499 | 0.015 (0.006) | 0.014 | 0.005 (0.002) | 0.020 | ||
AD, Alzheimer disease; CB, cerebellum; CSF, cerebrospinal fluid; Coef., coefficient; MCI, mild cognitive impairment; SE, standard deviation; SE, standard deviation; SUVR, standardized uptake value ratios; WM, white matter. Transformations differed in the different models.
Longitudinal Aβ burden changes associated with APOE
The baseline PET SUVRs plotted as a function of yearly changes showed the characteristic inverted “u” shape (Fig. 2). We observed that APOE ε4 carriers (one or two copies) showed a statistically significant upward shift of the values in three of the four analyses indicating that this group has a faster Aβ deposition rate compared to APOE ε4 non-carriers when accounting for baseline biomarker values (Table 3), whereas the was no significant effect for the ε2 allele. Gender was not associated with longitudinal florbetapir PET changes in any of the analyses, whereas age was associated with increased deposition rates for measures that included WM as a reference.
Fig. 2.
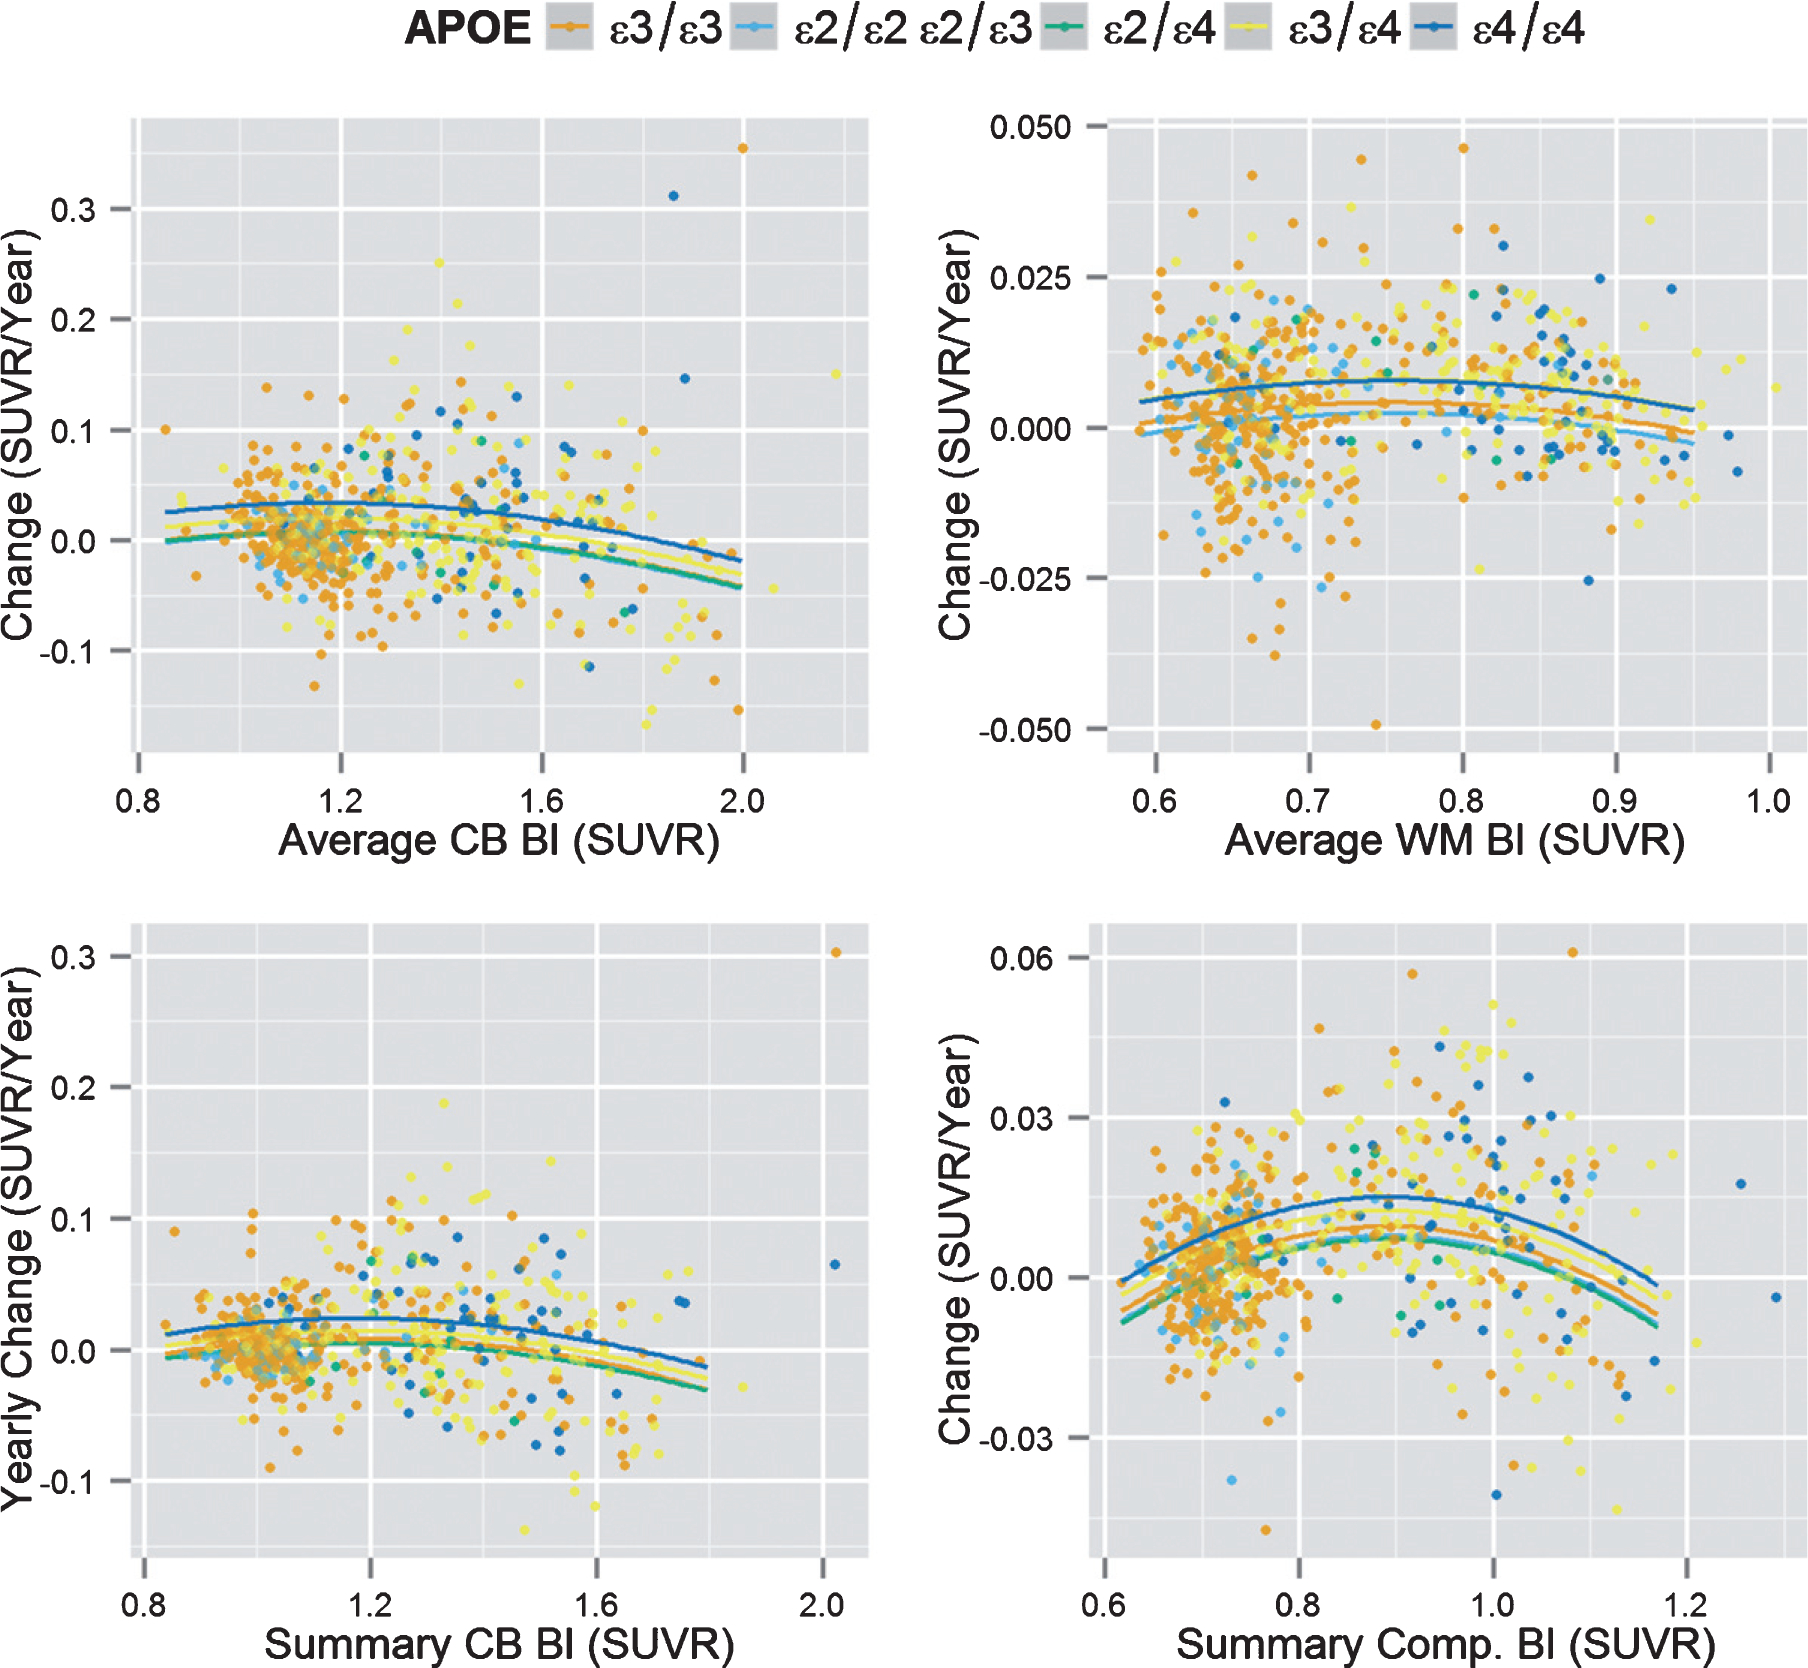
Longitudinal Aβ biomarker deposition. Baseline PET SUVR values (x-axis) versus longitudinal PET SUVR changes (y-axis) based on APOE genotype. Bl, baseline; CB, cerebellum; CSF, cerebrospinal fluid; SUVR, standardized uptake value ratio; WM, white matter.
DISCUSSION
In this study, we found that 1) APOE ε4 influences brain amyloid deposition pattern, 2) APOE ε4 does not modify Aβ biomarker cut-points estimated using unsupervised mixture modeling methods when WM and brainstem were included as references, 3) large differences in Aβ biomarker values based on APOE genotype are due to increased probability of having AD neuropathology and are most significant in MCI subjects and 4) APOE ε4 and age (but not gender) were associated with Aβ deposition rate.
Aβ distribution patterns
Different brain Aβ deposition patterns based on APOE genotype were only identified when the analysis was adjusted for total Aβ burden. Two previous studies, including 52 and 84 AD subjects described increased Aβ PET values in frontal and lateral frontotemporal regions [12, 13] in APOE ε4 carriers whereas a third one described overall greater diffuse cortical Aβ PET values in APOE ε4 carriers [25]. Subject selection criteria and analytical approaches can explain differences between our results and these studies: two studies included only demented subjects [13], when APOE ε4 carriers and non-carriers are close to the biomarker plateaus, in addition one of the former studies included atypical AD cases. The third study did include CN subjects for a wide range of ages, but did not adjust for global amyloid burden [25].
There are several explanations for discordant results between the adjusted and unadjusted models. Because the APOE ε4 allele is such a strong risk factor for sporadic AD, the odds of having preclinical AD pathology in CN subjects and of having underlying AD pathology in cognitively impaired subjects is increased and therefore PET SUVRs may be higher [2, 26, 27]. Previously, APOE genotype has been described to be associated with different patterns of cognitive impairment and brain atrophy [28] with varying frequencies in different neuropathologically defined AD subtypes [29]. Therefore, it is not surprising that APOE genotype is associated with differences in amyloid deposition. This might indicate that vulnerability varies based on the presence or absence of APOE ε4 and this can lead to differences in clinical expression. Nevertheless, the putative mechanisms suggested to lead to increased amyloid deposition in AD, such as decreased amyloid clearance [30], and the association of CSF ApoE levels with cognitive and MRI structural changes [31] do not explain why there is a preferential spatial vulnerability associated with APOE genotype.
Selections of Aβ biomarker cut-points based on APOE genotype
The mixture modeling analysis that we applied is an unsupervised, unbiased statistical approach to study independently the effect of APOE genotype with each studied Aβ biomarkers cut-points, which has been successfully applied to estimate Aβ biomarker cut-points and has shown less than 1% difference with previous cut-points estimated based on neuropathological cases [6, 9, 19]. This approach has not been applied separately to APOE ε4 carriers and non-carriers.
Only CB-referenced florbetapir PET values showed differences in the distribution of the cut-points based on APOE genotype, which led to 2.5–5.6% of the participants being reclassified, whereas similar cut-points (<0.6% difference) were obtained for WM-referenced florbetapir PET and CSF Aβ1–42 values in APOE ε4 carriers and non-carriers.
A previous study analyzed the effect of APOE genotype on CSF and PET amyloid values [32] reporting no effects of APOE genotype using a different approach. This study was conditioned by the a priori choice of using CSF Aβ1–42 cut-points to stratify PET Aβ values, therefore conditioning the comparison of PET values based on APOE genotype and did not analyze each of these Aβ biomarkers independently. In addition, the previous study looked at differences based on APOE genotype and not at changes in cut-points values. Last, it might have been underpowered to detect differences as the population with PET values included only 165 subjects and only one PET processing pipeline was evaluated.
There are several biological and technical factors such as acquisition, instrument, and image processing factors that can lead to differences between studies, which could explain why florbetapir PET cut-points were only affected when CB was selected as a reference [33]. Recent studies involving the same study population have evaluated differences based on the selected reference region to calculate Aβ PET SUVRs [6, 34, 35]. Although there is a high correlation between cross-sectional amyloid measures using different pipelines on the same PET scans [6] and between scans of the same subjects obtained using different ligands [36], this is not the case for longitudinal changes [6, 34]. CB has been the most commonly used reference to calculate SUVRs, but it has several potential drawbacks [33, 35]: it is located close to the scanner’s field of view limit (and therefore susceptible to truncation and scatter-related noise), has low signal level (cerebellar gray matter), and Aβ deposits in CB are present in the latest Aβ deposition stages, Thal phase 5 [37]. The latter would lead to lower SUVR values in the most advanced cases due to the presence of Aβ deposition in the CB.
Using WM as the reference region has been compared to CB showing that reference selection may be important to detect alterations that are more likely linked to AD pathobiology [34] and increase statistical power to detect longitudinal changes [35]. Our results regarding Aβ PET cut-points add further evidence for the use of WM references when florbetapir scans are processed.
Cross-sectional associations with baseline biomarker values
Associations with APOE genotype have been reported to vary depending on the clinical status of the studied subjects. Whereas CN and MCI APOE ε4 carriers consistently show higher Aβ PET SUVRs than APOE ε4 non-carriers, studies that included AD participants have described higher Aβ PET SUVRs in APOE ε4 carriers [10], higher Aβ PET SUVRs in APOE ε4 non-carriers [12], or a lack of differences [11].
Our results showed that in the different groups stratified by clinical diagnosis APOE ε4 carriers had more pathological Aβ biomarker values compared to APOE ε4 non-carriers with patterns that clearly showed bimodal distributions belonging to two different populations, one with normal and another with pathological Aβ values. MCI and AD APOE ε4 non-carriers showed a large variance in Aβ biomarker values with two distinct peaks (Fig. 1E–H), whereas only MCI APOE ε4 carriers showed a low frequency for the peak in the normal range of values and no bimodal distribution was observed in AD APOE ε4 carriers. Interestingly, the peaks in the pathological Aβ range had a similar mode in APOE ε4 carriers and non-carriers, indicating a similar distribution of the values in this population.
We infer that these observations are the consequence of Aβ biomarker characteristics and/or clinical misdiagnosis. Based on the current AD biomarker model [26], it is expected that MCI and AD subjects with underlying AD pathology already have Aβ biomarker values in the pathological ranges, because AD pathology in described autopsy assessed subjects begins decades before the onset of cognitive decline. Therefore, those cognitively impaired individuals diagnosed with MCI and AD with values in the normal range would likely not have AD pathology. Clinical misdiagnosis has been observed in clinico-pathological studies of subjects with a clinical diagnosis of AD [38] and there are several pathologies that can lead to MCI. Factors described above and differences in selection criteria and analytical approaches can explain divergent results previously observed for AD Aβ biomarker studies.
Longitudinal Aβ deposition
We found a faster amyloid deposition in APOE ε4 carriers, in a model that accounted for baseline amyloid levels and non-linear trajectories. There have been conflicting results regarding the association between APOE genotype and longitudinal amyloid biomarker changes [15, 39–42] that can be attributed to analytical and statistical aspects. For example, CSF Aβ1–42 values reach a plateau earlier than PET amyloid values [6]. Therefore, it is not surprising that a high percentage of elderly AD and control APOE ε4 carriers have reached this plateau and therefore do not show any further decrease in CSF Aβ1–42 [41]. While PET SUVRs might reach a plateau at later stage, there is still a decreased amyloid deposition rate with increasing brain amyloid load [6, 15, 40]. Another important factor is the inclusion of baseline values when longitudinal changes are evaluated, because these lead to a large reduction in APOE genotype associated changes [40].
Conclusions
Our results indicate that APOE ε4 carrier status is associated with a preferential distribution of amyloid in the frontal cortex and anterior cingulate and leads to increased rate of amyloid deposition, which agrees with cross-sectional findings of higher amyloid burden in ε4 carriers, without affecting Aβ biomarker cut-points when adequate PET references are used in the processing pipeline. The neuropathological heterogeneity underlying subjects classified based on a clinical diagnosis can explain conflicting findings regarding APOE associations found in different studies.
Supplementary Material
ACKNOWLEDGMENTS
JBT is supported by P01 AG032953, P01 AG017586, P30 AG010124, and P50 NS053488. JQT is the William Maul Measey-Truman G. Schnabel, Jr., Professor of Geriatric Medicine and Gerontology. MB is supported by the Swedish Brain Foundation and the Sweden-America Foundation.
The ADNI is funded by the National Institute on Aging, the National Institute of Biomedical Imaging and Bioengineering, and through generous contributions from the following: Alzheimer’s Association; Alzheimer’s Drug Discovery Foundation; Araclon Biotech; BioClinica, Inc.; Biogen Idec Inc.; Bristol-Myers Squibb Company; Eisai Inc.; Elan Pharmaceuticals, Inc.; Eli Lilly and Company; EuroImmun; F. Hoffmann-La Roche Ltd and its affiliated company Genentech, Inc.; Fujirebio; GE Healthcare; IXICO Ltd.; Janssen Alzheimer Immunotherapy Research & Development, LLC.; Johnson & Johnson Pharmaceutical Research & Development LLC.; Medpace, Inc.; Merck & Co., Inc.; Meso Scale Diagnostics, LLC.; NeuroRx Research; Neurotrack Technologies; Novartis Pharmaceuticals Corporation; Pfizer Inc.; Piramal Imaging; Servier; Synarc Inc.; and Takeda Pharmaceutical Company. The Canadian Institutes Health Research is providing funds to support ADNI clinical sites in Canada. Private sector contributions are facilitated by the Foundation for the National Institutes of Health (http://www.fnih.org). The grantee organization is the Northern California Institute for Research and Education, and the study is coordinated by the Alzheimer’s Disease Cooperative Study at the University of California, San Diego. ADNI data are disseminated by the Laboratory for Neuro Imaging at the University of Southern California. MH was supported in part by “Alfried Krupp von Bohlen und Halbach” foundation and by The Allen H. and Selma W. Berkman Charitable Trust (Accelerating Research on Vascular Dementia) and NIH (grant no. 1RF1AG054409 and grant no. R01 HL127659-04S1).
Footnotes
Authors’ disclosures available online (https://www.j-alz.com/manuscript-disclosures/18-1282r1).
SUPPLEMENTARY MATERIAL
The supplementary material is available in the electronic version of this article: http://dx.doi.org/10.3233/JAD-181282.
REFERENCES
- [1].Toledo JB, Zetterberg H, van Harten AC, Glodzik L, Martinez-Lage P, Bocchio-Chiavetto L, Rami L, Hansson O, Sperling R, Engelborghs S, Osorio RS, Vanderstichele H, Vandijck M, Hampel H, Teipl S, Moghekar A, Albert M, Hu WT, Monge Argiles JA, Gorostidi A, Teunissen CE, De Deyn PP, Hyman BT, Molinuevo JL, Frisoni GB, Linazasoro G, de Leon MJ, van der Flier WM, Scheltens P, Blennow K, Shaw LM, Trojanowski JQ (2015) Alzheimer’s disease cerebrospinal fluid biomarker in cognitively normal subjects. Brain 138, 2701–2715. [DOI] [PMC free article] [PubMed] [Google Scholar]
- [2].Jack CR Jr, Wiste HJ, Weigand SD, Rocca WA, Knopman DS, Mielke MM, Lowe VJ, Senjem ML, Gunter JL, Preboske GM, Pankratz VS, Vemuri P, Petersen RC (2014) Age-specific population frequencies of cerebral beta-amyloidosis and neurodegeneration among people with normal cognitive function aged 50–89 years: A cross-sectional study. Lancet Neurol 13, 997–1005. [DOI] [PMC free article] [PubMed] [Google Scholar]
- [3].Habes M, Toledo JB, Resnick SM, Doshi J, Van der Auwera S, Erus G, Janowitz D, Hegenscheid K, Homuth G, Volzke H, Hoffmann W, Grabe HJ, Davatzikos C (2016) Relationship between APOE genotype and structural MRI measures throughout adulthood in the Study of Health in Pomerania population-based cohort. AJNR Am J Neuroradiol 37, 1636–1642. [DOI] [PMC free article] [PubMed] [Google Scholar]
- [4].Sutphen CL, Jasielec MS, Shah AR, Macy EM, Xiong C, Vlassenko AG, Benzinger TL, Stoops EE, Vanderstichele HM, Brix B, Darby HD, Vandijck ML, Ladenson JH, Morris JC, Holtzman DM, Fagan AM (2015) Longitudinal cerebrospinal fluid biomarker changes in preclinical Alzheimer disease during middle age. JAMA Neurol 72, 1029–1042. [DOI] [PMC free article] [PubMed] [Google Scholar]
- [5].Landau SM, Lu M, Joshi AD, Pontecorvo M, Mintun MA, Trojanowski JQ, Shaw LM, Jagust WJ (2013) Comparing positron emission tomography imaging and cerebrospinal fluid measurements of beta-amyloid. Ann Neurol 74, 826–836. [DOI] [PMC free article] [PubMed] [Google Scholar]
- [6].Toledo JB, Bjerke M, Da X, Landau SM, Foster NL, Jagust W, Jack C Jr., Weiner M, Davatzikos C, Shaw LM, Trojanowski JQ (2015) Nonlinear association between cerebrospinal fluid and florbetapir F-18 beta-amyloid measures across the spectrum of Alzheimer disease. JAMA Neurol 72, 571–581. [DOI] [PMC free article] [PubMed] [Google Scholar]
- [7].Weigand SD, Vemuri P, Wiste HJ, Senjem ML, Pankratz VS, Aisen PS, Weiner MW, Petersen RC, Shaw LM, Trojanowski JQ, Knopman DS, Jack CR Jr (2011) Transforming cerebrospinal fluid Abeta42 measures into calculated Pittsburgh Compound B units of brain Abeta amyloid. Alzheimers Dement 7, 133–141. [DOI] [PMC free article] [PubMed] [Google Scholar]
- [8].Tapiola T, Alafuzoff I, Herukka SK, Parkkinen L, Hartikainen P, Soininen H, Pirttila T (2009) Cerebrospinal fluid beta-amyloid 42 and tau proteins as biomarkers of Alzheimer-type pathologic changes in the brain. Arch Neurol 66, 382–389. [DOI] [PubMed] [Google Scholar]
- [9].Clark CM, Schneider JA, Bedell BJ, Beach TG, Bilker WB, Mintun MA, Pontecorvo MJ, Hefti F, Carpenter AP, Flitter ML, Krautkramer MJ, Kung HF, Coleman RE, Doraiswamy PM, Fleisher AS, Sabbagh MN, Sadowsky CH, Reiman EP, Zehntner SP, Skovronsky DM (2011) Use of florbetapir-PET for imaging beta-amyloid pathology. JAMA 305, 275–283. [DOI] [PMC free article] [PubMed] [Google Scholar]
- [10].Drzezga A, Grimmer T, Henriksen G, Muhlau M, Perneczky R, Miederer I, Praus C, Sorg C, Wohlschlager A, Riemenschneider M, Wester HJ, Foerstl H, Schwaiger M, Kurz A (2009) Effect of APOE genotype on amyloid plaque load and gray matter volume in Alzheimer disease. Neurology 72, 1487–1494. [DOI] [PubMed] [Google Scholar]
- [11].Rowe CC, Ellis KA, Rimajova M, Bourgeat P, Pike KE, Jones G, Fripp J, Tochon-Danguy H, Morandeau L, O’Keefe G, Price R, Raniga P, Robins P, Acosta O, Lenzo N, Szoeke C, Salvado O, Head R, Martins R, Masters CL, Ames D, Villemagne VL (2010) Amyloid imaging results from the Australian Imaging, Biomarkers and Lifestyle (AIBL) study of aging. Neurobiol Aging 31, 1275–1283. [DOI] [PubMed] [Google Scholar]
- [12].Ossenkoppele R, van der Flier WM, Zwan MD, Adriaanse SF, Boellaard R, Windhorst AD, Barkhof F, Lammertsma AA, Scheltens P, van Berckel BN (2013) Differential effect of APOE genotype on amyloid load and glucose metabolism in AD dementia. Neurology 80, 359–365. [DOI] [PubMed] [Google Scholar]
- [13].Lehmann M, Ghosh PM, Madison C, Karydas A, Coppola G, O’Neil JP, Huang Y, Miller BL, Jagust WJ, Rabinovici GD (2014) Greater medial temporal hypometabolism and lower cortical amyloid burden in ApoE4-positive AD patients. J Neurol Neurosurg Psychiatry 85, 266–273. [DOI] [PMC free article] [PubMed] [Google Scholar]
- [14].Grimmer T, Tholen S, Yousefi BH, Alexopoulos P, Forschler A, Forstl H, Henriksen G, Klunk WE, Mathis CA, Perneczky R, Sorg C, Kurz A, Drzezga A (2010) Progression of cerebral amyloid load is associated with the apolipoprotein E epsilon4 genotype in Alzheimer’s disease. Biol Psychiatry 68, 879–884. [DOI] [PMC free article] [PubMed] [Google Scholar]
- [15].Villemagne VL, Pike KE, Chetelat G, Ellis KA, Mulligan RS, Bourgeat P, Ackermann U, Jones G, Szoeke C, Salvado O, Martins R, O’Keefe G, Mathis CA, Klunk WE, Ames D, Masters CL, Rowe CC (2011) Longitudinal assessment of Abeta and cognition in aging and Alzheimer disease. Ann Neurol 69, 181–192. [DOI] [PMC free article] [PubMed] [Google Scholar]
- [16].Resnick SM, Bilgel M, Moghekar A, An Y, Cai Q, Wang MC, Thambisetty M, Prince JL, Zhou Y, Soldan A, Wong DF, O’Brien RJ, Ferrucci L, Albert MS (2015) Changes in Abeta biomarkers and associations with APOE genotype in 2 longitudinal cohorts. Neurobiol Aging 36, 2333–2339. [DOI] [PMC free article] [PubMed] [Google Scholar]
- [17].Petersen RC, Aisen PS, Beckett LA, Donohue MC, Gamst AC, Harvey DJ, Jack CR Jr, Jagust WJ, Shaw LM, Toga AW, Trojanowski JQ, Weiner MW (2010) Alzheimer’s Disease Neuroimaging Initiative (ADNI): Clinical characterization. Neurology 74, 201–209. [DOI] [PMC free article] [PubMed] [Google Scholar]
- [18].Weiner MW, Veitch DP, Aisen PS, Beckett LA, Cairns NJ, Green RC, Harvey D, Jack CR, Jagust W, Liu E, Morris JC, Petersen RC, Saykin AJ, Schmidt ME, Shaw L, Shen L, Siuciak JA, Soares H, Toga AW, Trojanowski JQ (2013) The Alzheimer’s Disease Neuroimaging Initiative: A review of papers published since its inception. Alzheimers Dement 9, e111–194. [DOI] [PMC free article] [PubMed] [Google Scholar]
- [19].Shaw LM, Vanderstichele H, Knapik-Czajka M, Clark CM, Aisen PS, Petersen RC, Blennow K, Soares H, Simon A, Lewczuk P, Dean R, Siemers E, Potter W, Lee VM, Trojanowski JQ (2009) Cerebrospinal fluid biomarker signature in Alzheimer’s disease neuroimaging initiative subjects. Ann Neurol 65, 403–413. [DOI] [PMC free article] [PubMed] [Google Scholar]
- [20].Minoshima S, Frey KA, Koeppe RA, Foster NL, Kuhl DE (1995) A diagnostic approach in Alzheimer’s disease using three-dimensional stereotactic surface projections of fluorine-18-FDG PET. J Nucl Med 36, 1238–1248. [PubMed] [Google Scholar]
- [21].Landau SM, Mintun MA, Joshi AD, Koeppe RA, Petersen RC, Aisen PS, Weiner MW, Jagust WJ (2012) Amyloid deposition, hypometabolism, and longitudinal cognitive decline. Ann Neurol 72, 578–586. [DOI] [PMC free article] [PubMed] [Google Scholar]
- [22].Jagust WJ, Landau SM, Shaw LM, Trojanowski JQ, Koeppe RA, Reiman EM, Foster NL, Petersen RC, Weiner MW, Price JC, Mathis CA (2009) Relationships between biomarkers in aging and dementia. Neurology 73, 1193–1199. [DOI] [PMC free article] [PubMed] [Google Scholar]
- [23].Mormino EC, Kluth JT, Madison CM, Rabinovici GD, Baker SL, Miller BL, Koeppe RA, Mathis CA, Weiner MW, Jagust WJ (2009) Episodic memory loss is related to hippocampal-mediated beta-amyloid deposition in elderly subjects. Brain 132, 1310–1323. [DOI] [PMC free article] [PubMed] [Google Scholar]
- [24].Fraley C, Raftery AE (2002) Model-based clustering, discriminant analysis, and density estimation. J Am Stat Assoc 97, 611–631. [Google Scholar]
- [25].Fleisher AS, Chen K, Liu X, Ayutyanont N, Roontiva A, Thiyyagura P, Protas H, Joshi AD, Sabbagh M, Sadowsky CH, Sperling RA, Clark CM, Mintun MA, Pontecorvo MJ, Coleman RE, Doraiswamy PM, Johnson KA, Carpenter AP, Skovronsky DM, Reiman EM (2013) Apolipoprotein E epsilon4 and age effects on florbetapir positron emission tomography in healthy aging and Alzheimer disease. Neurobiol Aging 34, 1–12. [DOI] [PubMed] [Google Scholar]
- [26].Jack CR Jr, Knopman DS, Jagust WJ, Petersen RC, Weiner MW, Aisen PS, Shaw LM, Vemuri P, Wiste HJ, Weigand SD, Lesnick TG, Pankratz VS, Donohue MC, Trojanowski JQ (2013) Tracking pathophysiological processes in Alzheimer’s disease: An updated hypothetical model of dynamic biomarkers. Lancet Neurol 12, 207–216. [DOI] [PMC free article] [PubMed] [Google Scholar]
- [27].Montine TJ, Phelps CH, Beach TG, Bigio EH, Cairns NJ, Dickson DW, Duyckaerts C, Frosch MP, Masliah E, Mirra SS, Nelson PT, Schneider JA, Thal DR, Trojanowski JQ, Vinters HV, Hyman BT (2012) National Institute on Aging-Alzheimer’s Association guidelines for the neuropathologic assessment of Alzheimer’s disease: A practical approach. Acta Neuropathol 123, 1–11. [DOI] [PMC free article] [PubMed] [Google Scholar]
- [28].Wolk DA, Dickerson BC (2010) Apolipoprotein E (APOE) genotype has dissociable effects on memory and attentional-executive network function in Alzheimer’s disease. Proc Natl Acad SciUSA 107, 10256–10261. [DOI] [PMC free article] [PubMed] [Google Scholar]
- [29].Murray ME, Graff-Radford NR, Ross OA, Petersen RC, Duara R, Dickson DW (2011) Neuropathologically defined subtypes of Alzheimer’s disease with distinct clinical characteristics: A retrospective study. Lancet Neurol 10, 785–796. [DOI] [PMC free article] [PubMed] [Google Scholar]
- [30].Castellano JM, Kim J, Stewart FR, Jiang H, DeMattos RB, Patterson BW, Fagan AM, Morris JC, Mawuenyega KG, Cruchaga C, Goate AM, Bales KR, Paul SM, Bateman RJ, Holtzman DM (2011) Human apoE isoforms differentially regulate brain amyloid-beta peptide clearance. Sci Transl Med 3, 89ra57. [DOI] [PMC free article] [PubMed] [Google Scholar]
- [31].Toledo JB, Da X, Weiner MW, Wolk DA, Xie SX, Arnold SE, Davatzikos C, Shaw LM, Trojanowski JQ (2014) CSF Apo-E levels associate with cognitive decline and MRI changes. Acta Neuropathol 127, 621–632. [DOI] [PMC free article] [PubMed] [Google Scholar]
- [32].Lautner R, Palmqvist S, Mattsson N, Andreasson U, Wallin A, Palsson E, Jakobsson J, Herukka SK, Owenius R, Olsson B, Hampel H, Rujescu D, Ewers M, Landen M, Minthon L, Blennow K, Zetterberg H, Hansson O (2014) Apolipoprotein E genotype and the diagnostic accuracy of cerebrospinal fluid biomarkers for Alzheimer disease. JAMA Psychiatry 71, 1183–1191. [DOI] [PubMed] [Google Scholar]
- [33].Schmidt ME, Chiao P, Klein G, Matthews D, Thurfjell L, Cole PE, Margolin R, Landau S, Foster NL, Mason NS, De Santi S, Suhy J, Koeppe RA, Jagust W; Alzheimer’s Disease Neuroimaging Initiative (2015) The influence of biological and technical factors on quantitative analysis of amyloid PET: Points to consider and recommendations for controlling variability in longitudinal data. Alzheimers Dement 11, 1050–1068. [DOI] [PubMed] [Google Scholar]
- [34].Landau SM, Fero A, Baker SL, Koeppe R, Mintun M, Chen K, Reiman EM, Jagust WJ (2015) Measurement of longitudinal beta-amyloid change with 18F-Florbetapir PET and standardized uptake value ratios. J Nucl Med 56, 567–574. [DOI] [PMC free article] [PubMed] [Google Scholar]
- [35].Chen K, Roontiva A, Thiyyagura P, Lee W, Liu X, Ayutyanont N, Protas H, Luo JL, Bauer R, Reschke C, Bandy D, Koeppe RA, Fleisher AS, Caselli RJ, Landau S, Jagust WJ, Weiner MW, Reiman EM (2015) Improved power for characterizing longitudinal amyloid-beta PET changes and evaluating amyloid-modifying treatments with a cerebral white matter reference region. J Nucl Med 56, 560–566. [DOI] [PubMed] [Google Scholar]
- [36].Landau SM, Thomas BA, Thurfjell L, Schmidt M, Margolin R, Mintun M, Pontecorvo M, Baker SL, Jagust WJ (2014) Amyloid PET imaging in Alzheimer’s disease: A comparison of three radiotracers. Eur J Nucl Med Mol Imaging 41, 1398–1407. [DOI] [PMC free article] [PubMed] [Google Scholar]
- [37].Thal DR, Rub U, Orantes M, Braak H (2002) Phases of A beta-deposition in the human brain and its relevance for the development of AD. Neurology 58, 1791–1800. [DOI] [PubMed] [Google Scholar]
- [38].Toledo JB, Brettschneider J, Grossman M, Arnold SE, Hu WT, Xie SX, Lee VM, Shaw LM, Trojanowski JQ (2012) CSF biomarkers cutoffs: The importance of coincident neuropathological diseases. Acta Neuropathol 124, 23–35. [DOI] [PMC free article] [PubMed] [Google Scholar]
- [39].Villemagne VL, Burnham S, Bourgeat P, Brown B, Ellis KA, Salvado O, Szoeke C, Macaulay SL, Martins R, Maruff P, Ames D, Rowe CC, Masters CL (2013) Amyloid beta deposition, neurodegeneration, and cognitive decline in sporadic Alzheimer’s disease: A prospective cohort study. Lancet Neurol 12, 357–367. [DOI] [PubMed] [Google Scholar]
- [40].Jack CR Jr, Wiste HJ, Lesnick TG, Weigand SD, Knopman DS, Vemuri P, Pankratz VS, Senjem ML, Gunter JL, Mielke MM, Lowe VJ, Boeve BF, Petersen RC (2013) Brain beta-amyloid load approaches a plateau. Neurology 80, 890–896. [DOI] [PMC free article] [PubMed] [Google Scholar]
- [41].Toledo JB, Xie SX, Trojanowski JQ, Shaw LM (2013) Longitudinal change in CSF Tau and Abeta biomarkers for up to 48 months in ADNI. Acta Neuropathol 126, 659–670. [DOI] [PMC free article] [PubMed] [Google Scholar]
- [42].Seppala TT, Koivisto AM, Hartikainen P, Helisalmi S, Soininen H, Herukka SK (2011) Longitudinal changes of CSF biomarkers in Alzheimer’s disease. J Alzheimers Dis 25, 583–594. [DOI] [PubMed] [Google Scholar]
Associated Data
This section collects any data citations, data availability statements, or supplementary materials included in this article.