

Abstract
Background
While Athletic Trainers’ (ATs) education emphasizes sport event coverage, Physical Therapists’ (PTs) education may prepare them for event coverage responsibilities. The objectives of this study were to compare the perceived preparedness and decision-making related to acute injury/medical condition management among ATs and PTs and evaluate the relationship between perceived preparedness and decision-making.
Hypothesis
ATs would report greater perceived preparedness and appropriate decision-making related to acute injury/medical conditions compared to PTs.
Study Design
Cross-sectional, Online survey
Methods
An electronic survey was disseminated to licensed ATs (n=2,790) and PTs (n=10,207). Survey questions focused on perceived preparedness for management of acute injuries/medical conditions. Respondents also completed questions that assessed clinical decision-making related to acute injury case scenarios. Kruskal-Wallis H-Tests and Spearman’s Rho Correlations were used for the analysis. Significance was set to p<0.003 after adjustment for family-wise error.
Results
Six-hundred and fifty-five respondents (292 ATs, 317 PTs, 46 dual credentialed PT/ATs) completed the entire survey. ATs had the highest level of perceived preparedness of all the groups (p<0.0003). Greater than 75% of PTs responded either “appropriately” or “overly cautious” to 10 of the 17 case scenarios, as opposed to 11 of the 17 case scenarios by ATs. Greater than 75% of the PTs who were board specialty certified in sports responded either “appropriately” or “overly cautious” to 13 case scenarios.
Conclusion
More ATs than PTs perceived themselves to be prepared to manage acute injuries/ medical conditions. Further, results indicate that PTs may be an effective and safe provider of event coverage. Conditions/injuries with low perceived preparedness or poor performance may offer both ATs and PTs an opportunity to identify areas for future training and education to optimize care for athletes with acute injuries or medical conditions.
Level of Evidence
Level 3b
Keywords: sports physical therapy, residency, event coverage, decision-making, athletic training, acute injuries
Background
Over 7.9 million students participate in high school athletics.1 Having appropriate personnel, facilities, and plans for the emergency management and care of injuries sustained by student athletes is imperative for their safety and well-being.2,3 Injuries occur at a rate of 2.3 injuries per 1,000 athlete exposures in secondary school sports4; however, there continues to be a lack of event coverage provided by qualified medical professionals to manage acute injury situations that may occur with student athletes across the country.5 Often a coach may be the person responsible for providing medical coverage during a practice or competition.6 Data from the Athletic Training Location and Services (ATLAS) database from 2018 showed 69% of public secondary schools and 55% of private secondary schools provide specific event coverage with athletic trainer (AT) services for their student-athletes.5 Of these, only 37% of public schools and 27% of private schools offered a full-time AT on an every-afternoon basis.5 Many factors have been identified related to a lack of ATs in these settings.5,7–9 Having additional qualified healthcare providers may limit this gap in coverage and support the health and safety of student-athletes.5,7,10–13
Physical therapists (PTs) may also provide athletic event coverage.7,12,14,15 However, knowledge regarding the frequency and prevalence of PTs’ involvement in secondary school event coverage is limited.12,14 While ATs are specifically trained in acute sports injury management, there are educational areas of overlap between ATs and PTs.16–18 However, substantial differences in entry-level educational training exists between ATs and PTs. ATs receive education on providing immediate and emergency care for athletes suffering from acute injuries or medical conditions, while PT entry-level training typically lacks the content for emergency care of athletes in on-field or sideline situations.19 Some PTs do participate in specialized training through elective coursework and/or post-professional residencies and fellowships to obtain advanced, board specialty certification in sports (SCS) and training in the field of sports injury management.20–22
However, despite both ATs and PTs providing event coverage, there is limited understanding of their perceived preparedness in the management of acute injuries and medical conditions.10 In addition, it is unknown how clinical decision-making and management of emergency situations by both ATs and PTs may differ. Lastly, there is a lack of understanding of which injuries or medical conditions certain medical professionals may struggle to manage. A better understanding of the above is necessary to be able to provide the best management for the healthcare needs of athletes.
The primary purpose of this study was to compare the perceived preparedness and decision-making skills related to acute injury and medical condition management by ATs and PTs. The secondary purpose was to evaluate the relationship between a provider’s perceived preparedness and responses on case scenarios focused on acute medical scenarios. The underlying rationale for this project was to better understand both perceived preparedness and clinical decision making by both ATs and PTs. First, it was hypothesized that ATs would report greater perceived preparedness and choose more appropriate responses in the management of acute/emergency situations compared to PTs. Second, it was hypothesized that greater perceived preparedness would positively correlate to more appropriate injury management responses.
METHODS
Participants
This study was a cross-sectional design electronic exploratory survey study of licensed ATs and PTs in the state of Ohio during the 2019 calendar year. An e-mail database was obtained from the Ohio Occupational Therapy, Physical Therapy, and Athletic Trainers board. Current AT or PT students registered through the board were excluded from the data. Physical therapist assistants (PTA) that were not also credentialed as an AT or PT were also excluded.
Instrumentation
All participants completed an online questionnaire (QualtricsXM, Provo, UT) (Appendix A). The study utilized an adapted version of the survey developed by Cross and colleagues10,23–25 (with permission) which has been validated and previously used with high school coaches, PTs, and PT students. In addition to demographics, the survey included questions related to involvement in performing athletic event coverage, frequency of coverage, and coverage responsibilities. Participants were also asked to rate their perceived preparedness on a 5-point scale; “prepared (1),” “somewhat prepared (2),” “neutral (3),” “somewhat unprepared (4),” “not prepared (5)”.10,23–25 Participants were presented a set of case scenarios and were asked to determine what they believe to be an appropriate course of action for a particular medical situation. The scenarios were developed so that the participant needed to account for player type (starter/non-starter) and competition significance (important/non important competition). Each participant evaluated the case scenario and chose what they believed to be the appropriate course of action for the athlete. Participants chose one of four options: “hold out and refer” “hold out and monitor symptoms,” “return to competition and monitor,” or “return to competition and not monitor” (Figure 1) (Appendix A, Section 3). The correct/appropriate responses to these scenarios were determined and validated in a previous study by Cross et al.25
Figure 1. Case Scenario Example.

The project and study protocol were reviewed, and permission to conduct the study was granted by The Ohio State University Institutional Review Board. Potential participants were provided a consent letter via e-mail and consented electronically prior to beginning their participation in the study.
Data Collection
Potential participants received an e-mail describing the study and a link to begin the survey. All potential participants were notified that their participation in the study was voluntary and that no incentive would be given for completion of the survey. Reminder emails were sent two and three weeks following the initial email. Only those participants that fully completed the perceived preparedness and case scenario sections were included in the analysis.
Data Analysis
Using an online sample size calculator, 95% confidence interval, 5% margin of error, and a population size of 9,888 PTs, and 2,985 ATs it was determined that a total of 374 surveys would need to be completed for the primary purpose.26 IBM SPSS Statistics Version 25 (SPSS, Inc, Chicago, IL) was used to analyze the data. Frequencies and descriptive statistics were used to analyze demographic information, perceived preparedness, and responses to the case scenarios.
Cross tabulations were used to analyze profession-specific responses for perceived preparedness and the case responses. For the primary purpose a Kruskal-Wallis H-Test for one-way analysis of the variance (ANOVA) was used to analyze the differences in distribution of the perceived preparedness between the ATs and PTs. As PTs who are board specialty certified in Sports (SCS-PTs) have specific training in acute injury management, a secondary preliminary analysis was also performed using a Kruskal-Wallis H-Test to compare ATs and SCS-PTs, and SCS-PTs and NonSCS-PTs. For the secondary purpose a Spearman’s Rho Correlation was used to determine if a correlation exists between a participant’s perceived preparedness and their ability to choose an appropriate decision regarding an athlete’s return to play or referral status. Values of correlation analysis were interpreted as poor (<0.25), fair (0.25-0.49), moderate to good (0.05-0.74), and good to excellent (>0.75).27 The categories from the perceived preparedness section were paired with the case study question that pertained to the similar medical condition to determine the correlation between a respondent’s answers. Data from participants that identified as dual-credentialed (AT/PT) were included in the demographic results; however, they were not included in the perceived preparedness and case scenario analysis as their results did not meet the aims of this study. A Sidak’s adjustment for multiple comparisons was made for each of the family-wise analyses accounting for the different comparisons or correlations. After the adjustment significance was set p≤0.003.
Similar to Cross and colleagues,10,23–25 the term “at least somewhat prepared” is used throughout the analysis, and indicates that a respondent replied as either “prepared” or “somewhat prepared”.10,25 These two responses were pooled together at times during the analysis in that they indicate that a respondent feels comfortable managing the specific injury category with their current knowledge base and skill set. The responses to the case scenarios were graded as either “appropriate”, “inappropriate”, or “overly cautious”.25 In some instances during the case scenario section, a case had both a “most appropriate” response, and an “appropriate” response. In these instances, both answers were grouped together to form an “appropriate” response. An “appropriate” response indicates that the return to play decision provided by the medical professional was a safe decision for the health and well-being of the athlete. Lastly, 75% was used as a benchmark when comparing responses among the groups as the authors felt it would best represent a large majority of the respondents in each group to be able to compare results to previous literature.10,25
RESULTS
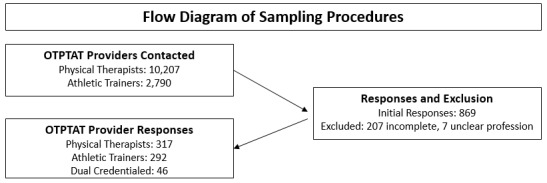
Of the 869 initial responses, 214 were removed for not meeting the inclusion criteria or for not completing 100% of the perceived preparedness questions and case scenarios. This resulted in a final sample size of 655 participants (5.0%) (Figure 2). The survey was completed by 292 ATs, 317 PTs, and 46 dual-credentialed providers (AT/PT) (Table 1).
Figure 2. Flow Diagram of Sampling Procedures.
OTPTAT = State of Ohio Occupational Therapy, Physical Therapy, and Athletic Trainers Board. The survey was only sent to Physical Therapists and Athletic Trainers. Average Percent Perception of Perceived Preparedness for Athletic Trainers and Physical Therapists. Seventy-seven percent of the Athletic Trainers felt “Prepared” while only 34% of the Physical Therapists felt prepared. Nineteen percent of the Athletic Trainers felt “Somewhat Prepared” vs. 35% of the Physical Therapists. Three percent of the Athletic Trainers and 13% of the Physical Therapists felt “Neutral.” While only 1% of the Athletic Trainers felt “Somewhat Underprepared” vs. 10% of the Physical Therapists. Finally, less than 1% (0.12%) of the Athletic Trainers felt “Not Prepared” compared to 8% of the Physical Therapists. These results suggest that Physical Therapists felt less prepared to management acute injury situations than Athletic Trainers. More specific results are presented in Table 4.
Table 1. Demographic Data.
| Category | n (%) | Category | n (%) |
|---|---|---|---|
| Gender (n= 655) | Age (n= 654) | ||
| Male | 244 (37.3) | Under 25 | 46 (7.0) |
| Female | 405 (61.8) | 25-29 | 146 (22.3) |
| Prefer not to Answer | 6 (0.9) | 30-34 | 118 (18.0) |
| 35-39 | 67 (10.2) | ||
| Profession (n= 655) | 40-44 | 73 (11.2) | |
| Athletic Trainer | 292 (44.6) | 45-49 | 62 (9.5) |
| Physical Therapist | 317 (48.5) | 50-54 | 53 (8.0) |
| AT/PT | 46 (7.0) | 55-59 | 46 (7.0) |
| 60-64 | 25 (3.8) | ||
| Job duties more closely align with weekly (AT/PT Only) (n=46) | 65+ | 19 (2.9) | |
| Athletic Trainer | 8 (17.4) | ||
| Physical Therapist | 38 (82.6) | Current Employment Status (n= 655) | |
| Full-time salaried | 417 (63.7) | ||
| Highest Degree Earned (n= 654) | Part-time salaried | 32 (5.0) | |
| Baccalaureate | 175 (26.9) | Full-time hourly | 104 (15.8) |
| Master's | 268 (41.0) | Part-time hourly | 64 (9.7) |
| DAT | 3 (.5) | Full-time self-employed | 13 (2.0) |
| DPT (Entry-Level) | 171 (26.1) | Part-time self-employed | 8 (1.2) |
| PhD (or equivalent) | 23 (3.5) | Unemployed | 6 (0.9) |
| Other | 14 (2.1) | Not working (retired) | 11 (1.7) |
| AT Primary Practice Setting (n= 304) | PT Primary Practice Setting (n= 351) | ||
| Secondary School | 124 (40.8) | Hospital system or hospital based OP facility | 157 (44.7) |
| 2- Year Institution | 5 (1.6) | Acute care hospital | 29 (8.3) |
| 4- Year Institution | 77 (25.3) | Subacute rehab hospital | 17 (4.8) |
| Outpatient/Rehabilitation/ Ambulatory Clinic | 25 (8.2) | Private OP or group practice | 66 (18.8) |
| Hospital System or physician's office | 41 (13.5) | Academic Institution | 23 (6.6) |
| Professional Sports | 7 (2.3) | Health and wellness facility | 4 (1.1) |
| Industry | 5 (1.6) | Industry | 2 (0.6) |
| Other | 20 (6.6) | Other | 53 (15.1) |
AT= Athletic Trainer; PT= Physical Therapist; AT/PT= Dual credentialed athletic trainer and physical therapist; DAT= Doctorate of Athletic Training, DPT= Doctorate of Physical Therapy; OP= Outpatient
Seventy-three (20%) of the PT and AT/PT respondents had obtained specialty certification (e.g. Sports, Orthopedic, Geriatric, Neurology, Womens Health) through the American Boards of Physical Therapy Specialties (ABPTS) (Table 2). There were a total of 23 PTs (including dual credentialed PT/AT) who were SCS credentialed in the initial sample. Seventeen (5.4%) were PTs only and included in the final analysis. (Table 2). Further, 251 (86%) ATs indicated they provided sports event coverage whereas 22 (6.9%) of PTs indicated that they provided event coverage (Table 3) As part of the survey, the participants were asked which sports they considered to be their “primary” or “secondary” responsibilities. Responses indicated 26 different sports or events (Table 3).
Table 2. Professional Practice and Certification Information.
| Category | n (%) | Category | n (%) | ||||
|---|---|---|---|---|---|---|---|
| Years of Practice (n= 654) | Years in current position (n= 649) | ||||||
| <1 | 34 (5.2) | < 1 | 104 (16.0) | ||||
| 1-3 | 106 (16.2) | 1-3 | 206 (31.7) | ||||
| 4-5 | 61 (9.3) | 4-5 | 77 (11.9) | ||||
| 6-10 | 118 (18.0) | 6-10 | 94 (14.5) | ||||
| 11-15 | 62 (9.5) | 11-15 | 68 (10.5) | ||||
| 16-20 | 80 (12.2) | 16-20 | 36 (5.5) | ||||
| 21-30 | 105 (16.1) | 21-30 | 49 (7.6) | ||||
| 31+ | 88 (13.5) | 31+ | 15 (2.3) | ||||
| Graduated from ABPTRFE program (PT AT/PT Only) (n= 73) | ABPTS Board specialization (PT AT/PT Only) (n= 363) | ||||||
| Yes | 18 (24.6) | Yes | 73 (20.1) | ||||
| No | 55 (75.3) | No | 290 (79.9) | ||||
| ABPTS Specialization Certification (PT AT/PT Only) (n= 73) | Additional Certifications (n= 655) | ||||||
| Sports | 23 (31.5) | ACLS | 37 (5.6) | ||||
| Orthopedic | 36 (49.3) | Paramedic | 3 (0.5) | ||||
| Orthopedic Manual | 4 (5.4) | EMT | 11 (1.7) | ||||
| Geriatric | 7 (9.5) | First Responder | 59 (9.0) | ||||
| Neurology | 5 (6.8) | Personal Trainer | 6 (0.9) | ||||
| Women's health | 1 (1.3) | CSCS | 63 (9.6) | ||||
| PES | 11 (1.7) | ||||||
| Other | 147 (22.3) | ||||||
| None | 110 (16.7) | ||||||
AT= Athletic Trainer; PT= Physical Therapist; AT/PT= Dual credentialed athletic trainer and physical therapist; ABPTRFE=American Board of Physical Therapy Residency and Fellowship Education; ABPTS= American Board of Physical Therapy Specialties; ACLS= Advanced Cardiovascular Life Support; EMT= Emergency Medical Technician; CSCS= Certified Strength and Conditioning Specialist; PES= Performance Enhancement Specialist
Table 3. Athletic Trainer and Physical Therapist Event Coverage Data.
| Category | AT n (%) |
PT n (%) |
Category | AT n (%) |
PT n (%) |
|---|---|---|---|---|---|
| Coverage for Sporting Events (n= 609) | Frequency of Sporting Event Coverage (n= 273) | ||||
| Yes | 251 (86.0) | 22 (6.9) | 4-6 times a week | 199 (79.3) | 1 (4.5) |
| No | 41 (14.0) | 295 (93.1) | 2-3 times a week | 23 (9.2) | 6 (27.3) |
| Once a week | 7 (2.8) | 1 (4.5) | |||
| Once a month | 10 (4.0) | 4 (18.2) | |||
| Every other month | 5 (2.0) | 4 (18.2) | |||
| Once every three months | 5 (2.0) | 3 (13.6) | |||
| Twice a year | 1 (0.4) | 3 (13.6) | |||
| Once a year | 1 (0.4) | 0 (0.0) | |||
| Category | n (%) | Category | n (%) | ||
| Primary Sport Responsibility (n= 278) | Secondary Sport Responsibility (n= 246) | ||||
| All | 13 (4.6) | All | 12 (4.8) | ||
| Baseball | 19 (6.8) | Baseball | 5 (1.8) | ||
| Basketball | 15 (5.4) | Basketball | 73 (26.5) | ||
| Community Events | 5 (1.8) | Community Events | 9 (3.3) | ||
| Cross Country | 2 (.7) | Cross Country | 4 (1.5) | ||
| Fencing | Fencing | 1 (.4) | |||
| Field Hockey | 1 (.4) | Field Hockey | 3 (1.1) | ||
| Football | 136 (48.9) | Football | 9 (3.3) | ||
| Golf | Golf | 2 (.7) | |||
| Gymnastics | 1 (.4) | Gymnastics | 3 (1.1) | ||
| Ice Hockey | 10 (3.6) | Ice Hockey | 6 (2.2) | ||
| Lacrosse | 8 (2.9) | Lacrosse | 16 (5.8) | ||
| Rugby | 3 (1.1) | Rugby | 5 (1.8) | ||
| Soccer | 35 (12.6) | Soccer | 41 (14.9) | ||
| Swimming/Diving | 1 (.4) | Swimming/Diving | 7 (2.5) | ||
| Tennis | 1 (.4) | Tennis | 5 (1.8) | ||
| Track and Field | 3 (1.1) | Track and Field | 17 (6.2) | ||
| Wrestling | 3 (1.1) | Wrestling | 9 (3.3) | ||
| Volleyball | 7 (2.5) | Volleyball | 6 (2.2) | ||
| Other | 13 (4.6) | Other | 6 (2.2) | ||
AT = Athletic Trainer; PT = Physical Therapist
Comparison of Perceived Preparedness
Over 75% of all the participants claimed to be either “prepared” or “somewhat prepared” to manage 13 of the 16 injuries and medical conditions (Table 4). At least 75% of ATs responded that they felt “prepared” to respond to an athlete with nine of the 16 conditions (Table 4) while approximately 75% of PTs felt “prepared” for sprains and strains. Over 75% of ATs felt at least “somewhat prepared” for all 16 of the injuries and medical conditions, while over 75% of PT’s felt at least “somewhat prepared” for five of the 16 injuries and medical conditions. The distribution of perceived preparedness responses were different for all 16 conditions when comparing ATs and PTs, with a greater percentage of ATs reporting they were “Prepared” for all 16 of the categories compared to the PTs (Figure 3 and Table 4).
Table 4. Athletic Trainers and Physical Therapist’s Perceived Preparedness.
|
Prepared n (%) |
SomewhatPrepared n (%) |
Neutral n (%) |
SomewhatUnprepared n (%) |
NotPrepared n (%) |
P-Value | ||||||
|---|---|---|---|---|---|---|---|---|---|---|---|
| AT | PT | AT | PT | AT | PT | AT | PT | AT | PT | ||
| Concussions | 279 (95.5) |
74 (23.3) |
10 (3.4) |
124 (39.1) |
2 (0.7) |
41 (12.9) |
1 (0.3) |
44 (13.9) |
0 | 34 (10.7) |
<.0.001* |
| Dislocations | 190 (65.1) |
66 (20.7) |
86 (29.5) |
101 (31.9) |
12 (4.1) |
53 (16.7) |
4 (1.4) |
54 (17.0) |
0 | 43 (13.6) |
<.0.001* |
| Fatigue/Dehydration | 260 (89.0) |
124 (38.9) |
31 (10.6) |
117 (36.9) |
1 (0.3) |
44 (13.9) |
0 | 16 (5.0) |
0 | 16 (5.0) |
<.0.001* |
| Fractures | 247 (84.6) |
108 (34.1) |
42 (14.4) |
121 (38.2) |
3 (1.0) |
33 (10.4) |
0 | 27 (8.5) |
0 | 28 (8.8) |
<.0.001* |
| Open Wounds | 276 (94.5) |
99 (31.2) |
15 (5.1) |
123 (38.8) |
0 | 44 (13.9) |
1 (0.3) |
30 (9.5) |
0 | 21 (6.6) |
<.0.001* |
| Sprains | 292 (100) |
237 (74.8) |
0 | 68 (21.5) |
0 | 7 (2.2) |
0 | 2 (0.6) |
0 | 3 (0.9) |
<.0.001* |
| Strains | 291 (99.7) |
238 (75.1) |
1 (0.3) |
61 (19.2) |
0 | 11 (3.5) |
0 | 4 (1.3) |
0 | 3 (0.9) |
<.0.001* |
| Asthma Attacks | 209 (71.6) |
47 (14.8) |
73 (25.0) |
121 (38.2) |
8 (2.7) |
63 (19.9) |
2 (0.7) |
43 (13.6) |
0 | 43 (13.6) |
<.0.001* |
| Cardiac Arrest | 216 (74.0) |
149 (47.0) |
67 (22.9) |
112 (35.3) |
6 (2.0) |
32 (10.1) |
2 (0.7) |
15 (4.7) |
1 (0.3) |
9 (2.8) |
<.0.001* |
| Head Injury | 263 (90.1) |
82 (25.9) |
26 (8.9) |
121 (38.2) |
3 (1.0) |
53 (16.7) |
0 | 36 (11.4) |
0 | 25 (7.9) |
<.0.001* |
| Heat Stroke | 228 (78.1) |
70 (22.1) |
60 (20.5) |
118 (37.2) |
3 (1.0) |
54 (17.0) |
1 (0.3) |
42 (13.2) |
0 | 33 (10.4) |
<.0.001* |
| Neck Injuries | 231 (79.1) |
114 (36.0) |
54 (18.5) |
115 (36.3) |
4 (1.4) |
37 (11.7) |
3 (1.0) |
35 (11.0) |
0 | 16 (5.0) |
<.0.001* |
| Seizures | 161 (55.1) |
88 (27.8) |
102 (34.9) |
123 (38.8) |
24 (8.2) |
50 (15.8) |
5 (1.7) |
28 (8.8) |
0 | 28 (8.8) |
<.0.001* |
| Spinal Cord | 207 (70.9) |
75 (23.7) |
67 (22.9) |
129 (40.7) |
14 (4.8) |
43 (13.6) |
4 (1.4) |
40 (12.6) |
0 | 30 (9.5) |
<.0.001* |
| Diabetes | 153 (52.4) |
139 (43.8) |
118 (40.4) |
109 (34.4) |
17 (5.8) |
34 (10.7) |
2 (0.7) |
19 (6.0) |
2 (0.7) |
16 (5.0) |
<.0.001* |
| Internal Organs | 86 (29.5) |
20 (6.3) |
148 (50.7) |
96 (30.3) |
42 (14.4) |
68 (21.5) |
14 (4.8) |
66 (20.8) |
2 (0.7) |
67 (21.1) |
<.0.001* |
AT= Athletic Trainer; PT= Physical Therapists *p≤0.003
Figure 3. Distribution of the Average Perception of Perceived Preparedness for Athletic Trainers and Physical Therapists.

Seventy-seven percent of the Athletic Trainers felt “Prepared” while only 34% of the Physical Therapists felt prepared. Nineteen percent of the Athletic Trainers felt “Somewhat Prepared” vs. 35% of the Physical Therapists. Three percent of the Athletic Trainers and 13% of the Physical Therapists felt “Neutral.” While only 1% of the Athletic Trainers felt “Somewhat Underprepared” vs. 10% of the Physical Therapists. Finally, less than 1% (0.12%) of the Athletic Trainers felt “Not Prepared” compared to 8% of the Physical Therapists. These results suggest that Physical Therapists felt less prepared to management acute injury situations than Athletic Trainers. More specific results are presented in Table 4.
At least 75% of the SCS-PTs responded as being at least “somewhat prepared” for 14 of the 16 categories, excluding concussion and asthma attacks (Appendix B - Table 8). When comparing the distribution between ATs and SCS-PT’s responses regarding perceived preparedness, the responses were significantly different for four of the 16 categories (concussion, open wounds, asthmas, and head injury). Finally, at least 75% of NonSCS-PTs answered that they were at least somewhat prepared for four of the 16 categories. When comparing the distribution between the SCS-PTs and the NonSCS-PTs responses regarding perceived preparedness, the responses were different for four of the 16 categories (dislocations, fractures, heat stroke, and internal organs) (Appendix B - Table 11) with a greater percentage of SCS-PTs reporting they were at least “somewhat prepared” for all 16 of the categories compared to the NonSCS-PTs.
Comparison of Responses to Acute Case Scenarios
Responses for nine out of the 17 cases were different when comparing the ATs and PTs and responses to the acute case scenarios (Table 5 and Figure 4). ATs provided more “inappropriate” than “appropriate” responses for three of the case scenarios: neck injury, second concussion, and dislocation. PTs had more “appropriate” than “inappropriate” responses. Greater than 75% of ATs responded either “appropriately” or “overly cautious” to 11 case scenarios while greater than 75% of PTs responded “appropriately” or “overly cautious” to nine case scenarios (Table 5). In addition, a greater percentage (p≤0.003) of ATs provided the “Most Appropriate” answer on six of the 17 cases compared to the PTs (asthma, first concussion, fracture, heat stroke, ankle sprain, and internal organ) whereas a greater percentage of PTs provided the “Most Appropriate” answer for only three of the 17 cases (dehydration, cardiac arrest, and second concussion) compared to the ATs Table 5). Further, a greater percentage of ATs provided the “Most Appropriate” answer on one case (spinal cord injury) when compared to the SCS-PTs while the SCS-PTs did not provide more “Most Appropriate” answers when compared to the ATs (Appendix B – Table 9). No case scenarios were different when comparing SCS-PTs and NonSCS-PTs (Appendix B- Table 12). However, these results should be interpreted with caution as this sub-analysis is likely underpowered for sub-analysis. The NonSCS-PT group had zero instances where the majority of respondents answered the case scenarios incorrectly.
Table 5. Athletic Trainers and Physical Therapist’s Responses to Case Scenarios.
| Question & Scenario | Hold Out & Refer n (%) | Hold Out & Monitor n (%) | Return & Monitor n (%) | Return & Not Monitor n (%) | P-Value | ||||
|---|---|---|---|---|---|---|---|---|---|
| AT | PT | AT | PT | AT | PT | AT | PT | ||
| 1. Dehydration | 160 (54.8)^A | 242 (76.3)^A | 131 (44.9) I | 73 (23.0) I | 1 (0.3) I | 2 (0.6) I | 0I | 0I | <.0.001* |
| 2. Asthma | 0 O | 1 (0.3) O | 10 (3.4) O | 31 (9.8) O | 270 (92.5) ^A | 275 (86.8)^A | 12(4.1)I | 10 (3.2) I | 0.003* |
| 3. Cardiac Arrest | 206 (70.5) ^A | 263 (83.0) ^A | 83 (28.4) I | 52 (16.4) I | 3 (1.0) I | 2 (0.6) I | 0I | 0I | <.0.001* |
| 4. 1st Concussion | 43 (14.7) A | 99 (31.2) A | 248 (84.9)^A | 216 (68.1)^A | 1 (0.3) I | 2 (0.6) I | 0I | 0I | <.0.001* |
| 5. Neck Injury | 134 (45.9)^A | 180 (56.8)^A | 133 (45.5) I | 111 (35.0) I | 25 (8.6) I | 25 (7.9) I | 0I | 1 (0.3)I | 0.02 |
| 6. Diabetes | 1 (0.3) O | 2 (0.6) O | 7 (2.4) O | 16 (5.0) O | 272 (93.2)^A | 263 (83.0)^A | 12 (4.1)I | 36 (11.3)I | 0.11 |
| 7. Fracture | 141 (48.1)A | 198 (62.5) A | 140 (47.9)^A | 116 (36.6)^A | 10 (3.4) I | 3 (0.9) I | 1 (0.3)I | 0I | <.0.001* |
| 8. Spinal Cord Injury | 233 (79.8) ^A | 237 (74.1)^A | 57 (19.5) I | 79 (24.9) I | 2 (0.7) I | 3 (0.9) I | 0I | 0I | 0.10 |
| 9. Head Injury | 234 (80.1)^A | 230 (72.6)^A | 58 (19.9) I | 77 (24.1) I | 0 I | 10 (3.1) I | 0I | 0I | 0.02 |
| 10. Knee Sprain | 2 (0.7) O | 1 (0.3) O | 21 (7.2) O | 19 (6.0) O | 179 (61.3)^A | 174 (54.9)^A | 90 (30.8)I | 123 (38.8)I | 0.04 |
| 11. 2nd Concussion | 3 (1.0) A | 15 (4.7) A | 140 (47.9)^A | 174 (54.9)^A | 145 (49.7) I | 126 (39.7) I | 4 (1.4)I | 2 (0.6)I | 0.002* |
| 12. Dislocation | 8 (2.7) A | 17 (5.4) A | 132 (45.2)^A | 167 (52.7) ^A | 151 (51.7) I | 133 (42.0) I | 1 (0.3)I | 0I | 0.007 |
| 13. Heat Exhaustion | 23 (7.9) A | 28 (8.8) A | 258 (88.4)^A | 277 (87.4)^A | 11 (3.8) I | 12 (3.8) I | 0 I | 0I | 0.73 |
| 14. Heat Stroke | 249 (85.3)^A | 236 (74.4)^A | 42 (14.4) I | 79 (24.9) I | 1 (0.3) I | 2 (0.6) I | 0 I | 0I | 0.001* |
| 15. Ankle Sprain | 0 O | 0 O | 40 (13.7) A | 87 (27.4) A | 231 (79.1)^A | 212 (66.9)^A | 21 (7.2) I | 18 (5.7)I | <.0.001* |
| 16. Eye Injury | 263 (90.1)^A | 271 (85.5)^A | 28 (9.6) I | 43 (13.6) I | 1 (0.3) I | 3 (0.9) I | 0 I | 0I | 0.08 |
| 17. Internal Organ | 256 (87.7)^A | 230 (72.6)^A | 35 (12.0) I | 84 (26.5) I | 1 (0.3) I | 3 (0.9) I | 0 I | 0I | <.0.001* |
^A= Most Appropriate Answer; A= Appropriate; I=Inappropriate; O= Overly Cautious
*p≤0.003;
Figure 4. Distribution of Responses to Case Scenarios for Athletic Trainers and Physical Therapists.

Average percentage of response types to case scenarios of Athletic Trainers and Physical Therapists. This chart summarizes the average percentage of “Most Appropriate,” “Appropriate,” “Inappropriate,” and “Overly Cautious” responses to the case scenarios. In some instances during the case scenario section, a case had both a “Most Appropriate” response, and an “Appropriate” response.25 For example scenarios: 4 (1st Concussion), 7 (Fracture), 11 (2nd Concussion), 12 (Dislocation), 13 (Heat Exhaustion), and 15 (Ankle Sprain) had both “Most Appropriate” and “Appropriate” responses. Only 3 scenarios had “Overly Cautious” responses. These included scenarios: 2 (Asthma), 6 (Diabetes), 10 (Knee Sprain), and 15 (Ankle Sprain). These results suggest that the overall responses of Physical Therapists were appropriate. More specific results are presented in Table 5.
Correlation between Perceived Preparedness and Appropriateness
When examining whether perceived preparedness was correlated to “appropriate” answers on the cases, the ATs and PTs responses were initially pooled together. Results demonstrated significant, yet poor relationships for the case involving dehydration (ρ=-0.14; p=0.001). Each of the groups were explored separately as a secondary analysis. There was a positive weak correlation between perceived preparedness and “appropriate” response for the case involving a first concussion (ρ=0.27; p<0.001) for the ATs (Table 6). There were no correlations between perceived preparedness and “appropriate” response for PTs, SCS-PTs, or NonSCS-PTs (Table 7, Appendix B - Tables 10 and 13). However, these results should be interpreted with caution as this secondary analysis was likely underpowered.
Table 6. Athletic Trainer’s Preparedness vs Appropriateness.
| Question | Decision | Prepared n (%) | Somewhat Prepared n (%) | Neutral n (%) | Somewhat Unprepared n (%) | Not Prepared n (%) | Spearman | P-Value |
|---|---|---|---|---|---|---|---|---|
| 1. Dehydration | A | 144 (90.0) | 15 (9.4) | 1 (0.6) | 0.03 | 0.58 | ||
| (n= 292) | I | 116 (87.9) | 16 (12.1) | |||||
| 2. Asthma | A | 192 (71.1) | 68 (25.2) | 8 (3.0) | 2(0.7) | -0.04 | 0.51 | |
| (n= 292) | I | 10 (83.3) | 2 (16.7) | |||||
| OC | 7 (70.0) | 3 (30.0) | ||||||
| 3. Cardiac Arrest | A | 153 (74.3) | 48 (23.3) | 2 (1.0) | 2(1.0) | 1(0.5) | 0.02 | 0.79 |
| (n= 292) | I | 63 (73.3) | 19 (22.1) | 4 (4.7) | ||||
| 4. 1st Concussion | A | 279 (95.9) | 9 (3.1) | 2 (0.7) | 1 (0.3) | 0.27 | 0.001* | |
| (n= 292) | I | 1 (100.0) | ||||||
| 5. Neck Injury | A | 106 (79.1) | 27 (20.1) | 1 (0.7) | 0.008 | 0.89 | ||
| (n= 292) | I | 125 (79.1) | 27 (17.1) | 3 (1.9) | 3(1.9) | |||
| 6. Diabetes | A | 141 (51.8) | 113 (41.5) | 15 (5.5) | 2 (0.7) | 1 (0.4) | -0.01 | 0.81 |
| (n= 292) | I | 9 (75.0) | 1 (8.3) | 1 (8.3) | 1 (8.3) | |||
| OC | 3 (37.5) | 4 (50.0) | 1(12.5) | |||||
| 7. Fracture | A | 238 (84.7) | 40 (14.2) | 3 (1.1) | 0.01 | 0.81 | ||
| (n= 292) | I | 9 (81.8) | 2 (18.2) | |||||
| 8. Spinal Cord Injury | A | 166 (71.2) | 52 (22.3) | 12 (5.2) | 3 (1.3) | 0.01 | 0.85 | |
| (n= 292) | I | 41 (69.5) | 15 (25.4) | 2 (3.4) | 1 (1.7) | |||
| 9. Head Injury | A | 251 (89.6) | 26 (9.3) | 3 (1.1) | -0.07 | 0.24 | ||
| (n= 292) | I | 12 (100.0) | ||||||
| 10. Knee Sprain | A | 179(100.0) | ||||||
| (n= 292) | I | 90 (100.0) | ||||||
| OC | 23 (100.0) | |||||||
| 11. 2nd Concussion | A | 138 (96.5) | 5 (3.5) | 0.05 | 0.42 | |||
| (n= 292) | I | 141 (94.6) | 5 (3.4) | 2 (1.3) | 1 (0.7) | |||
| 12. Dislocation | A | 93 (66.4) | 37 (26.4) | 9 (6.4) | 1 (0.7) | 0.02 | 0.80 | |
| (n= 292) | I | 97 (63.8) | 49 (32.2) | 3 (2.0) | 3 (2.0) | |||
| 13. Heat Exhaustion | A | 220 (78.3) | 57 (20.3) | 3 (1.1) | 1 (0.4) | 0.02 | 0.69 | |
| (n= 292) | I | 8 (72.7) | 3 (27.3) | |||||
| 14. Heat Stroke | A | 195 (78.3) | 50 (20.1) | 3 (1.2) | 1 (0.4) | 0.01 | 0.86 | |
| (n= 292) | I | 33 (76.7) | 10 (23.3) | |||||
| 15. Ankle Sprain | A | 271 (100.0) | ||||||
| (n= 292) | I | 21 (100.0) | ||||||
| 16. Eye Injury | A | 235 (89.4) | 25 (9.5) | 3 (1.1) | -0.07 | 0.22 | ||
| (n= 292) | I | 28 (96.6) | 1 (3.4) | |||||
| 17. Internal Organ | A | 78 (30.5) | 128 (50.0) | 34 (13.3) | 14 (5.5) | 2 (0.8) | 0.04 | 0.45 |
| (n= 292) | I | 8 (22.2) | 20 (55.6) | 8 (22.2) | ||||
A= Appropriate; I=Inappropriate; OC= Overly Cautious
*p≤0.003
Table 7. Physical Therapist’s Preparedness vs Appropriateness.
| Question | Decision | Prepared n (%) | Somewhat Prepared n (%) | Neutral n (%) | Somewhat Unprepared n (%) | Not Prepared n (%) | Spearman | P-Value |
|---|---|---|---|---|---|---|---|---|
| 1. Dehydration | A | 92 (38.0) | 87 (36.0) | 38 (15.7) | 11 (4.5) | 14 (5.8) | -0.07 | 0.24 |
| (n= 317) | I | 32 (42.7) | 30 (40.0) | 6 (8.0) | 5 (6.7) | 2 (2.7) | ||
| 2. Asthma | A | 41 (14.9) | 106 (38.5) | 56 (20.4) | 40 (14.5) | 32 (11.6) | 0.06 | 0.30 |
| (n= 317) | I | 3 (30.0) | 3 (30.0) | 2 (20.0) | 2 (20.0) | |||
| OC | 3 (9.4) | 12 (37.5) | 5 (15.6) | 1 (3.1) | 11 (34.4) | |||
| 3. Cardiac Arrest | A | 123 (46.8) | 94 (35.7) | 27 (10.3) | 12 (4.6) | 7 (2.7) | -0.002 | 0.97 |
| (n= 317) | I | 26 (48.1) | 18 (33.3) | 5 (9.3) | 3 (5.6) | 2 (3.7) | ||
| 4. 1st Concussion | A | 73 (23.2) | 124 (39.4) | 41 (13.0) | 44 (14.0) | 33 (10.5) | 0.009 | 0.87 |
| (n= 317) | I | 1 (50.0) | 1 (50.0) | |||||
| 5. Neck Injury | A | 62 (34.4) | 64 (35.6) | 17 (9.4) | 25 (13.9) | 12 (6.7) | -0.07 | 0.20 |
| (n= 317) | I | 52 (38.0) | 51 (37.2) | 20 (14.6) | 10 (7.3) | 4 (2.9) | ||
| 6. Diabetes | A | 111 (42.2) | 90 (34.2) | 32 (12.2) | 15 (5.7) | 15 (5.7) | -0.09 | 0.11 |
| (n= 317) | I | 19 (52.8) | 13 (36.1) | 2 (5.6) | 1 (2.8) | 1 (2.8) | ||
| OC | 9 (50.0) | 6 (33.3) | 3 (16.7) | |||||
| 7. Fracture | A | 106 (33.8) | 120 (38.0) | 33 (10.5) | 27 (8.6) | 28 (8.9) | -0.08 | 0.18 |
| (n= 317) | I | 2 (66.7) | 1 (33.3) | |||||
| 8. Spinal Cord Injury | A | 55 (23.4) | 97 (41.3) | 33 (13.9) | 28 (11.9) | 22 (9.4) | 0.008 | 0.89 |
| (n= 317) | I | 20 (24.4) | 32 (39.0) | 10 (12.2) | 12 (14.6) | 8 (9.6) | ||
| 9. Head Injury | A | 75 (25.7) | 112 (38.4) | 46 (15.8) | 34 (11.6) | 25 (8.6) | -0.03 | 0.57 |
| (n= 317) | I | 7 (28.0) | 9 (36.0) | 7 (28.0) | 2 (8.0) | |||
| 10. Knee Sprain | A | 129 (74.1) | 38 (21.8) | 3 (1.7) | 1 (0.6) | 3 (1.7) | -0.01 | 0.84 |
| (n= 317) | I | 94 (76.4) | 24 (19.5) | 4 (3.3) | 1 (0.8) | |||
| OC | 14 (70.0) | 6 (30.0) | ||||||
| 11. 2nd Concussion | A | 42 (22.2) | 77 (40.7) | 22 (11.6) | 27 (14.3) | 21 (11.1) | -0.02 | 0.77 |
| (n= 317) | I | 32 (24.8) | 47 (36.4) | 19 (14.7) | 18 (14.0) | 13 (10.1) | ||
| 12. Dislocation | A | 37 (20.1) | 64 (34.8) | 30 (16.3) | 29 (15.8) | 24 (13.0) | 0.03 | 0.59 |
| (n= 317) | I | 29 (21.6) | 37 (27.6) | 24 (17.9) | 25 (18.7) | 19 (14.2) | ||
| 13. Heat Exhaustion | A | 67 (22.0) | 115 (37.7) | 49 (16.1) | 41 (13.4) | 32 (10.8) | -0.01 | 0.81 |
| (n= 317) | I | 3 (25.0) | 3 (25.0) | 5 (41.7) | 1 (8.3) | |||
| 14. Heat Stroke | A | 55 (23.3) | 86 (36.4) | 33 (14.0) | 36 (15.3) | 26 (11.0) | 0.001 | 0.99 |
| (n= 317) | I | 15 (18.5) | 32 (39.5) | 21 (25.9) | 6 (7.4) | 7 (8.6) | ||
| 15. Ankle Sprain | A | 224 (74.9) | 65 (21.7) | 7 (2.3) | 1 (0.3) | 2 (0.7) | 0.03 | 0.65 |
| (n= 317) | I | 13 (72.2) | 3 (16.7) | 1 (5.6) | 1 (5.6) | |||
| 16. Eye Injury | A | 69 (25.5) | 103 (38.0) | 46 (17.0) | 29 (10.7) | 24 (8.9) | -0.04 | 0.51 |
| (n= 317) | I | 13 (28.3) | 18 (39.1) | 7 (15.2) | 7 (15.2) | 1 (2.2) | ||
| 17. Internal Organ | A | 13 (5.7) | 71 (30.9) | 51 (22.2) | 41 (17.8) | 55 (23.5) | -0.03 | 0.61 |
| (n= 317) | I | 7 (8.0) | 25 (28.7) | 17 (19.5) | 25 (28.7) | 13 (14.9) | ||
A= Appropriate; I=Inappropriate; OC= Overly Cautious
DISCUSSION
This is the first study to examine both ATs’ and PTs’ perceived preparedness to manage acute athletic injuries, as well as their ability to appropriately manage emergency situations using case scenarios. All participants perceived themselves to be the least prepared to manage athletes suffering from an injury to an internal organ (58.8%), dislocation (74.4%), and an asthma attack (75%). Cross and colleagues findings indicated that their participants felt least prepared to manage internal organ (56.7%), seizures (66.9%) and spinal cord injury (72.7%) .10 In the current study, ATs perceived themselves to be more prepared for the management of acute injuries and medical conditions compared to PTs, as well as SCS-PTs. However, SCS-PTs had a higher reported perceived preparedness in comparison to their NonSCS-PT colleagues.
Similar to Cross and colleagues, the four cases with the highest “inappropriate” responses for PTs were neck injury (43.2% “inappropriate”), dislocation (42% “inappropriate”), 2nd concussion (40.4% “inappropriate”) and knee sprain (38.8% “inappropriate”).10,23 Similarly ATs had the highest number of “inappropriate” responses to the cases pertaining to neck injury (54.1% “inappropriate”), dislocation (52.1% “inappropriate”) and second concussion (51% “inappropriate”). NonSCS-PTs provided the most “overly-cautious” responses to the case scenarios, but were the only group that did not have a majority “inappropriate” response to a case scenario.
Findings from this study may support focused education of both ATs and PTs who provide event coverage in particular regarding injuries or conditions that individuals perceive to be less prepared to manage and/or with scenarios. Further, there is limited entry-level training in acute sports injury management for PTs. Mulligan and DeVahl surveyed 241 entry-level PT education programs and only 43% of the responding programs indicated that they offered some form of sports physical therapy coursework.19 Further, only 52% of the programs discussed management of life-threatening emergencies and only 9% of the courses focused on athletic injury prevention.19 This combined with the current study findings suggest that if PTs desire to participate in event coverage then additional training (either in entry-level programs or with post-professional educational opportunities) may be important to best prepare them to appropriately manage acute athletic injuries as part of the sports medicine team.18 Specifically, PTs interested in working directly with the athletic population may participate in a sports physical therapy residency and/or related sub-subspecialty area fellowships through the American Board of Physical Therapy Residency and Fellowship Education.22,28 These post-professional education programs provide didactic and “on-the-job” mentoring and training in the care and management of athletes in the clinic and during sporting events as well as emergency management of athletes.22,28 Further, PTs (with or without sports residency training) may also obtain the SCS credential through the American Board of Physical Therapy Specialties.21,29 This credential indicates that PTs who are SCS have extensive knowledge in the rehabilitation and management of acute injuries and illnesses, medical/surgical considerations, injury prevention, sports performance enhancement, and professional roles and responsibilities in an athletic/sports population.20,29 Additionally, SCS-PTs are required to have direct sports event coverage and have passed emergency responder training in order to obtain and maintain specialty certification.21,29
Finally, poor to no correlations were identified between a provider’s perceived preparedness and their ability to appropriately respond to acute injury scenarios in written cases. Thus, higher levels of perceived preparedness did not relate to more “appropriate” responses for the case scenarios. This is consistent in other studies examining self-perception of performance and actual performance in medicine.30–33 This disconnect between self-perception of preparedness and case scenarios responses suggests there may be a need to for practitioners to be more mindful in practical situations, reflect on their performance, and obtain objective feedback.
Limitations and Future Research
There were several limitations to this study. First, the sample consisted of licensed ATs and PTs in the state of Ohio and cannot be presumed represent the entire United States or other countries. This study utilized cases that required a participant to choose between four options, while in a real-life scenario a medical professional may have additional options to determine an athlete’s return to play or need for referral. Further, there may have been flaws in the survey/scenarios that were not known. However, it was expected that any major flaws of issue were addressed during the survey validation by Cross et al.25 In addition, survey fatigue may have impacted participants focus. Further, in the survey it was not delineated if the ATs or PTs who provided event coverage in their current position were the sole provider of event coverage. Understanding this may have offered insight into the depth of event coverage experience of the respondents. Further, a low percentage (6.9%) of PTs who responded to the survey indicated they provided event coverage. Thus, there is likely a low potential for selection bias of PTs who have event coverage experience within the study sample. A sample of PTs with more or less exposure to event coverage may have responded differently to the survey and cases. Lastly, the SCS PTs comprised a small subgroup of the ABPTS credentialed PTs in the sample and the analysis was not powered to fully examine their responses. Thus, results should be interpreted cautiously. However, the percentage of SCS PTs (5.4%) within the sample was greater than the total percentage of physical therapists with the SCS credential in the United States (1%).34,35
Although dual credentialed providers (PT/AT) were excluded from the analysis due to potential confounding, comparing their responses to those of the other groups may provide insight into how such background and experience influence perceived preparedness and decision-making. Future research should be conducted on a sample beyond one state to improve generalizability and/or to identify variations across the United States. Furthermore, a qualitative examination would allow insight on the thought process of whether to refer, return, monitor, or take additional action for an injured athlete. Lastly, examining of real-time practical situations may provide additional insights into the decision-making process and other external factors that may influence provider responses.
Conclusion
Overall, ATs had a high level of perceived preparedness whereas PTs overall had a low perceived level of preparedness regarding the management of some acute injuries and medical conditions. Further, both ATs and PTs overall performed well on acute injury case scenarios, yet SCS-PTs performed better than NonSCS-PTs on select scenarios. While ATs are commonly the providers of event coverage for sporting events, PTs that are interested in event coverage should be encouraged to seek out additional training /mentoring opportunities (e.g. entry-level opportunities, post-professional residency training, continuing education courses, etc.) to increase their perceived preparedness for the management of acute injuries and medical conditions. Further, conditions/injuries with low perceived preparedness or poor performance may offer both ATs and PTs an opportunity to identify areas for future training and education to optimize care for athletes with acute injuries or medical conditions.
IRB Statement
This study was approved through the Institutional Review Board at The Ohio State University within the exempt research category.
Conflicts of Interest/Disclosure
Alan Wallace declares relevant financial activities outside of submitted work with payments made to him by his current employer (Kent State University).
Matthew Briggs declares relevant financial activities outside the submitted work with payments made to him by his current employer (The Ohio State University Wexner Medical Center) and Allied Health Education LLC; grant/grants pending paid to his employer by the National Institutes of Health, Ohio Physical Therapy Association, and American Physical Therapy Academy of Physical Therapy Education for support for unrelated projects; and travel/accommodations/ meeting expenses unrelated to this project by the American Board of Physical Therapy Specialties.
James Onate declares board membership and ownership of stock/stock options with to Human Elements.
John Dewitt no disclosure or conflicts of interest
Laurie Rinehart-Thompson no disclosure or conflicts of interest
Corresponding Author:
Matt Briggs PT, DPT, PhD, AT
The Ohio State University Wexner Medical Center
Jameson Crane Sports Medicine Institute
Sports Medicine Research Institute
Columbus, OH 43210
Matt.Briggs@osumc.edu
Supplementary Material
References
- National Federation of State High School Associations [2020-1-6];2018-19 High School Athletics Participation Survey. High School Participation Survey Archive. https://www.nfhs.org/media/1020412/2018-19_participation_survey.pdf
- Pryor Riana R., Casa Douglas J., Vandermark Lesley W., Stearns Rebecca L., Attanasio Sarah M., Fontaine Garrett J., Wafer Alex M. Journal of Athletic Training. 2. Vol. 50. Journal of Athletic Training/NATA; Athletic training services in public secondary schools: A benchmark study; pp. 156–162. [DOI] [PMC free article] [PubMed] [Google Scholar]
- National Athletic Trainers’ Association position statement: Emergency planning in athletics. Andersen J. C., Courson R.W, Kleiner D.M, et al. 2002J Athl Train. 37(1):99–104. doi: 10.4085/1062-6050-46.1.99. doi: 10.4085/1062-6050-46.1.99. [DOI] [PMC free article] [PubMed] [Google Scholar]
- The first decade of web-based sports injury surveillance: Descriptive epidemiology of injuries in United States high school football (2005-2006 through 2013-2014) and National collegiate athletic association football (2004-2005 through 2013-2014) Kerr Zachary Y., Wilkerson Gary B., Caswell Shane V., Currie Dustin W., Pierpoint Lauren A., Wasserman Erin B., Knowles Sarah B., Dompier Thomas P., Comstock R. Dawn, Marshall Stephen W. Aug 1;2018 J Athl Train. 53(8):738–751. doi: 10.4085/1062-6050-144-17. doi: 10.4085/1062-6050-144-17. [DOI] [PMC free article] [PubMed] [Google Scholar]
- Athletic trainer services in the secondary school setting: The athletic training locations and services project. Huggins Robert A., Coleman Kelly A., Attanasio Sarah M., Cooper G. Larry, Endres Brad D., Harper Ronald C., Huemme Kasey L., Morris Rachel F., Pike Lacy Alicia M., Peterson Bart C., Pryor Riana R., Casa Douglas J. Nov 1;2019 J Athl Train. 54(11):1129–1139. doi: 10.4085/1062-6050-12-19. doi: 10.4085/1062-6050-12-19. [DOI] [PMC free article] [PubMed] [Google Scholar]
- The level of medical services and secondary school-aged athletes. DeWitt Terry L., Unruh Scott A., Seshadri Srivatsa. Jan 1;2012 J Athl Train. 47(1):91–95. doi: 10.4085/1062-6050-47.1.91. doi: 10.4085/1062-6050-47.1.91. [DOI] [PMC free article] [PubMed] [Google Scholar]
- Athletic trainer services in public and private secondary schools. Pike Alicia M., Pryor Riana R., Vandermark Lesley W., Mazerolle Stephanie M., Casa Douglas J. Jan 1;2017 J Athl Train. 52(1):5–11. doi: 10.4085/1062-6050-51.11.15. doi: 10.4085/1062-6050-51.11.15. [DOI] [PMC free article] [PubMed] [Google Scholar]
- Schneider Kyle, Meeteer Wesley, Nolan Jill A, Campbell H David. Rural and Remote Health. 1. Vol. 17. Rural and Remote Health; Health care in high school athletics in West Virginia. [DOI] [PubMed] [Google Scholar]
- Athletic directors’ barriers to hiring athletic trainers in high schools. Mazerolle Stephanie M., Raso Samantha R., Pagnotta Kelly D., Stearns Rebecca L., Casa Douglas J. Oct 1;2015 J Athl Train. 50(10):1059–1068. doi: 10.4085/1062-6050-50.10.01. doi: 10.4085/1062-6050-50.10.01. [DOI] [PMC free article] [PubMed] [Google Scholar]
- Management of acute sports injuries and medical conditions by physical therapists: Assessment via case scenarios. Cross P.S., Karges J.R, Salsbery M.A.., et al. 2011Int J Sports Phys Ther. 6(3):158–172. [PMC free article] [PubMed] [Google Scholar]
- Summary Statement: Appropriate Medical Care for the Secondary School-Aged Athlete. Almquist Jon, Valovich McLeod Tamara C., Cavanna Angela, Jenkinson Dave, Lincoln Andrew E., Loud Keith, Peterson Bart C., Portwood Craig, Reynolds John, Woods Thomas S. Jul 1;2008 J Athl Train. 43(4):416–427. doi: 10.4085/1062-6050-43.4.416. doi: 10.4085/1062-6050-43.4.416. [DOI] [PMC free article] [PubMed] [Google Scholar]
- Medical Care in the Secondary School Setting: Who Is Providing Care in Lieu of an Athletic Trainer? Vandermark Lesley W., Pryor Riana R., Pike Alicia M., Mazerolle Stephanie M., Casa Douglas J. Mar;2017 Athletic Training & Sports Health Care. 9(2):89–96. doi: 10.3928/19425864-20170103-01. doi: 10.3928/19425864-20170103-01. [DOI] [Google Scholar]
- Deficiency of athletic trainers in california secondary schools. Pryor Riana R., Runestad Summer, Chong Gum Bethany A., Fuller Nathan J., Kang Moon, Beck Jennifer J. Jul 1;2019 Int J Athl Ther Train. 24(4):169–173. doi: 10.1123/ijatt.2018-0106. doi: 10.1123/ijatt.2018-0106. [DOI] [Google Scholar]
- Invited clinical suggestion: “on the sidelines”- emergency care basics for the sports physical therapist. Smith D.D. 2011Int J Sports Phys Ther. 6(1):59–62. http://www.ncbi.nlm.nih.gov/pubmed/21655458%0Ahttp://www.pubmedcentral.nih.gov/articlerender.fcgi?artid=PMC3105367 [PMC free article] [PubMed] [Google Scholar]
- The role of the sports physical therapist-marathon events. Smith D.D., Schuemann T., Hoogenboom B.J. 2013 [2021-8-20];Int J Sports Phys Ther. 8(4):531–536. http://www.ncbi.nlm.nih.gov/pubmed/24175136%0Ahttp://www.pubmedcentral.nih.gov/articlerender.fcgi?artid=PMC3812832 Accessed August 20, 2021. [PMC free article] [PubMed] [Google Scholar]
- American Physical Therapy Association. Vision, Mission, and Strategic Plan. [2020-1-26]. https://www.apta.org/apta-and-you/leadership-and-governance/vision-mission-and-strategic-plan
- National Athletic Trainers’ Association Education Overview. [2020-1-26]. https://www.nata.org/about/athletic-training/education-overview
- Are all physical therapists qualified to provide sideline coverage of athletic events? Smith D. 2012Int J Sports Phys Ther. 7(1):120–123. http://www.ncbi.nlm.nih.gov/pubmed/22319685%0Ahttp://www.pubmedcentral.nih.gov/articlerender.fcgi?artid=PMC3273887 [PMC free article] [PubMed] [Google Scholar]
- Sports Physical Therapy Curricula in Physical Therapist Professional Degree Programs. Mulligan Edward P., DeVahl Julie. Oct;2017 International Journal of Sports Physical Therapy. 12(5):787–797. doi: 10.26603/ijspt20170787. doi: 10.26603/ijspt20170787. [DOI] [PMC free article] [PubMed] [Google Scholar]
- American Board of Physical Therapy Specialties. Sports Physical Therapy Description of Specialty Practice. [2020-1-26]. http://aptaapps.apta.org/SpecialistCertification/Files/KIT-SPORTS.pdf
- APTA Specialist Certification: 2022 Sports Physical Therapy Specialist Certification Candidate Guide. [2021-10-25]. https://specialization.apta.org/become-a-specialist/candidate-guide Accessed October 25, 2021.
- American Board of Physical Therapy Residency and Fellowship Education. Description of Residency Practice: Sports. [2020-3-6]. https://abptrfe.apta.org/for-programs/clinical-programs/sports Accessed March 6, 2020.
- Effectiveness of The Emergency Response Course in Improving Student Physical Therapists’ and Licensed Physical Therapists’ Decision-Making Related to Acute Sports Injuries and Medical Conditions. Karges J.R, Stephen P. 2013Int J Sport Phys Ther. 8(3):277–289. [PMC free article] [PubMed] [Google Scholar]
- Assessing the need for knowledge on injury management among high school athletic coaches in South Dakota. Cross P.S., Karges JR, Adamson A.J.., et al. 2010South Dakota Med. 63(7):241–245. [PubMed] [Google Scholar]
- Management of Acute Sports Injuries and Medica l Conditions by South Dakota High School Head Coaches: Assessment via Case Scenarios. Cross P.S., Karges JR, Horkey M.A.., et al. 2012South Dakota Med. 65(3):7,97–99,101. [PubMed] [Google Scholar]
- Sample Size Calculator: Understanding Sample Sizes | SurveyMonkey. [2020-3-2]. https://www.surveymonkey.com/mp/sample-size-calculator/ Accessed March 2, 2020.
- Pharmacists' self-perception of their professional role: Insights into community pharmacy culture. Rosenthal Meagen M., Breault Rene R., Austin Zubin, Tsuyuki Ross T. May;2011 Journal of the American Pharmacists Association. 51(3):363–368a. doi: 10.1331/japha.2011.10034. doi: 10.1331/japha.2011.10034. [DOI] [PubMed] [Google Scholar]
- American Board of Physical Therapy Residency and Fellowship Education. [2020-3-6]. http://www.abptrfe.org/home.aspx Accessed March 6, 2020.
- American Board of Physical Therapy Specialties Specialist Certification: Sports. [2020-3-6]. https://specialization.apta.org/become-a-specialist/sports Accessed March 6, 2020.
- Gazibara Tatjana, Nurković Selmina, Marić Gorica, Kurtagić Ilma, Kovačević Nikolina, Kisić-Tepavčević Darija, Pekmezović Tatjana. Croatian Medical Journal. 4. Vol. 56. Croatian Medical Journals; Ready to work or not quite? Self-perception of practical skills among medical students from Serbia ahead of graduation; pp. 375–382. [DOI] [PMC free article] [PubMed] [Google Scholar]
- Evaluation of perceived and actual competency in a family medicine objective structured clinical examination. Graves L., Lalla L., Young M. 2017Can Fam Physician. 63(4):e238–e243. [PMC free article] [PubMed] [Google Scholar]
- Can medical students accurately predict their learning? A study comparing perceived and actual performance in neuroanatomy. Hall Samuel R., Stephens Jonny R., Seaby Eleanor G., Andrade Matheus Gesteira, Lowry Andrew F., Parton Will J.C., Smith Claire F., Border Scott. Apr 1;2016 Anatomical Sciences Education. 9(5):488–495. doi: 10.1002/ase.1601. doi: 10.1002/ase.1601. [DOI] [PubMed] [Google Scholar]
- Katowa-Mukwato Patricia, Banda Sekelani. International Journal of Medical Education. Vol. 7. International Journal of Medical Education; Self-perceived versus objectively measured competence in performing clinical practical procedures by final year medical students; pp. 122–129. [DOI] [PMC free article] [PubMed] [Google Scholar]
- Occupational Employment and Wages. U.S. Bureau of Labor Statistics 2019Occupational Employment Statistics: Physical Therapists. https://www.bls.gov/oes/current/oes291123.htm Published 2019.
- American Board of Physical Therapy Speciatlies. 2018Certified Specialists Statistics. Published. https://specialization.apta.org/about-abpts/abpts-certified-specialists-statistics Accessed June 16, 2020.
Associated Data
This section collects any data citations, data availability statements, or supplementary materials included in this article.