

Abstract
Acute myocardial infarction (AMI) is a severe cardiovascular disease. This study aimed to identify crucial microRNAs (miRNAs) and mRNAs in AMI by establishing a miRNA-mRNA network. The microarray datasets GSE31568, GSE148153, and GSE66360 were downloaded from the Gene Expression Omnibus (GEO) database. We identified differentially expressed miRNAs (DE-miRNAs) and mRNAs (DE-mRNAs) in AMI samples compared with normal control samples. The consistently changing miRNAs in both GSE31568 and GSE148153 datasets were selected as candidate DE-miRNAs. The interactions between the candidate DE-miRNAs and DE-mRNAs were analyzed, and a miRNA-mRNA network and a protein-protein interaction network were constructed, along with functional enrichment and pathway analyses. A total of 209 DE-miRNAs in the GSE31568 dataset, 857 DE-miRNAs in the GSE148153 dataset, and 351 DE-mRNAs in the GSE66360 dataset were identified. Eighteen candidate DE-miRNAs were selected from both the GSE31568 and GSE148153 datasets. Furthermore, miR-646, miR-127-5p, miR-509-5p, miR-509-3-5p, and miR-767-5p were shown to have a higher degree in the miRNA-mRNA network.THBS-1 as well as FOS was a hub gene in the miRNA-mRNA network and the protein-protein interaction (PPI) network, respectively. CDKN1A was important in both miRNA-mRNA network and PPI network. We established a miRNA-mRNA network in AMI and identified five miRNAs and three genes, which might be used as biomarkers and potential therapeutic targets for patients with AMI.
Keywords: acute myocardial infarction, miRNAs, mRNAs, miRNA-mRNA regulatory network
Introduction
Acute myocardial infarction (AMI) is a severe cardiovascular disease[1]. It is one of the most prevalent causes of morbidity and mortality worldwide[2]. Early diagnosis and treatment can significantly reduce mortality and improve the prognosis of patients with AMI[3]. Currently, cardiac troponin I and cardiac troponin T represent the 'gold-standard' for diagnosing AMI. However, false positive results often occur in patients with heart failure, chronic kidney diseases, and sepsis[4]. Therefore, it is critical to identify other novel biomarkers with high sensitivity and specificity for early diagnosis of AMI and thereby to improve clinical outcomes.
MicroRNAs (miRNAs) are reported to have pivotal roles in the regulation of AMI[5]. By using neonatal mice myocytes transfected with agomir or antagomir, Tony et al revealed that miR-208a alters apoptosis gene expression and promotes apoptosis in ischemic cardiomyocytes[6]. Yu et al found that miR-133 can protect cardiomyocytes against myocardial infarction[7]. Qiao et al showed that miR-125b could improve AMI in rats by regulating p38/SIRT1/p53 signaling pathway[8]. Therefore, miRNAs could be one of the potential diagnostic markers and therapeutic targets in AMI. There are many studies on the expression and function of miRNAs in AMI. However, studies on miRNA-mRNA regulatory network in AMI are scarce.
In this study, the results of both miRNA and mRNA expression profiles were integrated by reanalyzing the public datasets (GSE31568, GSE148153, and GSE66360) obtained from the Gene Expression Omnibus (GEO) ( https://www.ncbi.nlm.nih.gov/geoprofiles). We identified the differentially expressed miRNAs (DE-miRNAs) and mRNAs (DE-mRNAs) between the AMI and normal control groups, and constructed the miRNA-mRNA regulatory network. Based on comprehensive bioinformatics analysis, we expected to find potential diagnostic markers and therapeutic targets for AMI.
Materials and methods
Data collection
In this study, the series of matrix files of the GSE31568, GSE148153, and GSE66360 datasets were downloaded from the GEO. The miRNA dataset GSE31568 based on Platform GPL9040 included 70 normal control samples and 20 AMI samples, whereas the miRNA dataset GSE148153 performed on GPL20712 included 7 normal control samples and 5 AMI samples. Additionally, the mRNA expression profile GSE66360 based on GPL570 consists of 50 normal control samples and 49 AMI samples. Both miRNAs and mRNAs were examined from blood samples. The flow diagram of the study design is shown in Fig. 1.
Figure 1.
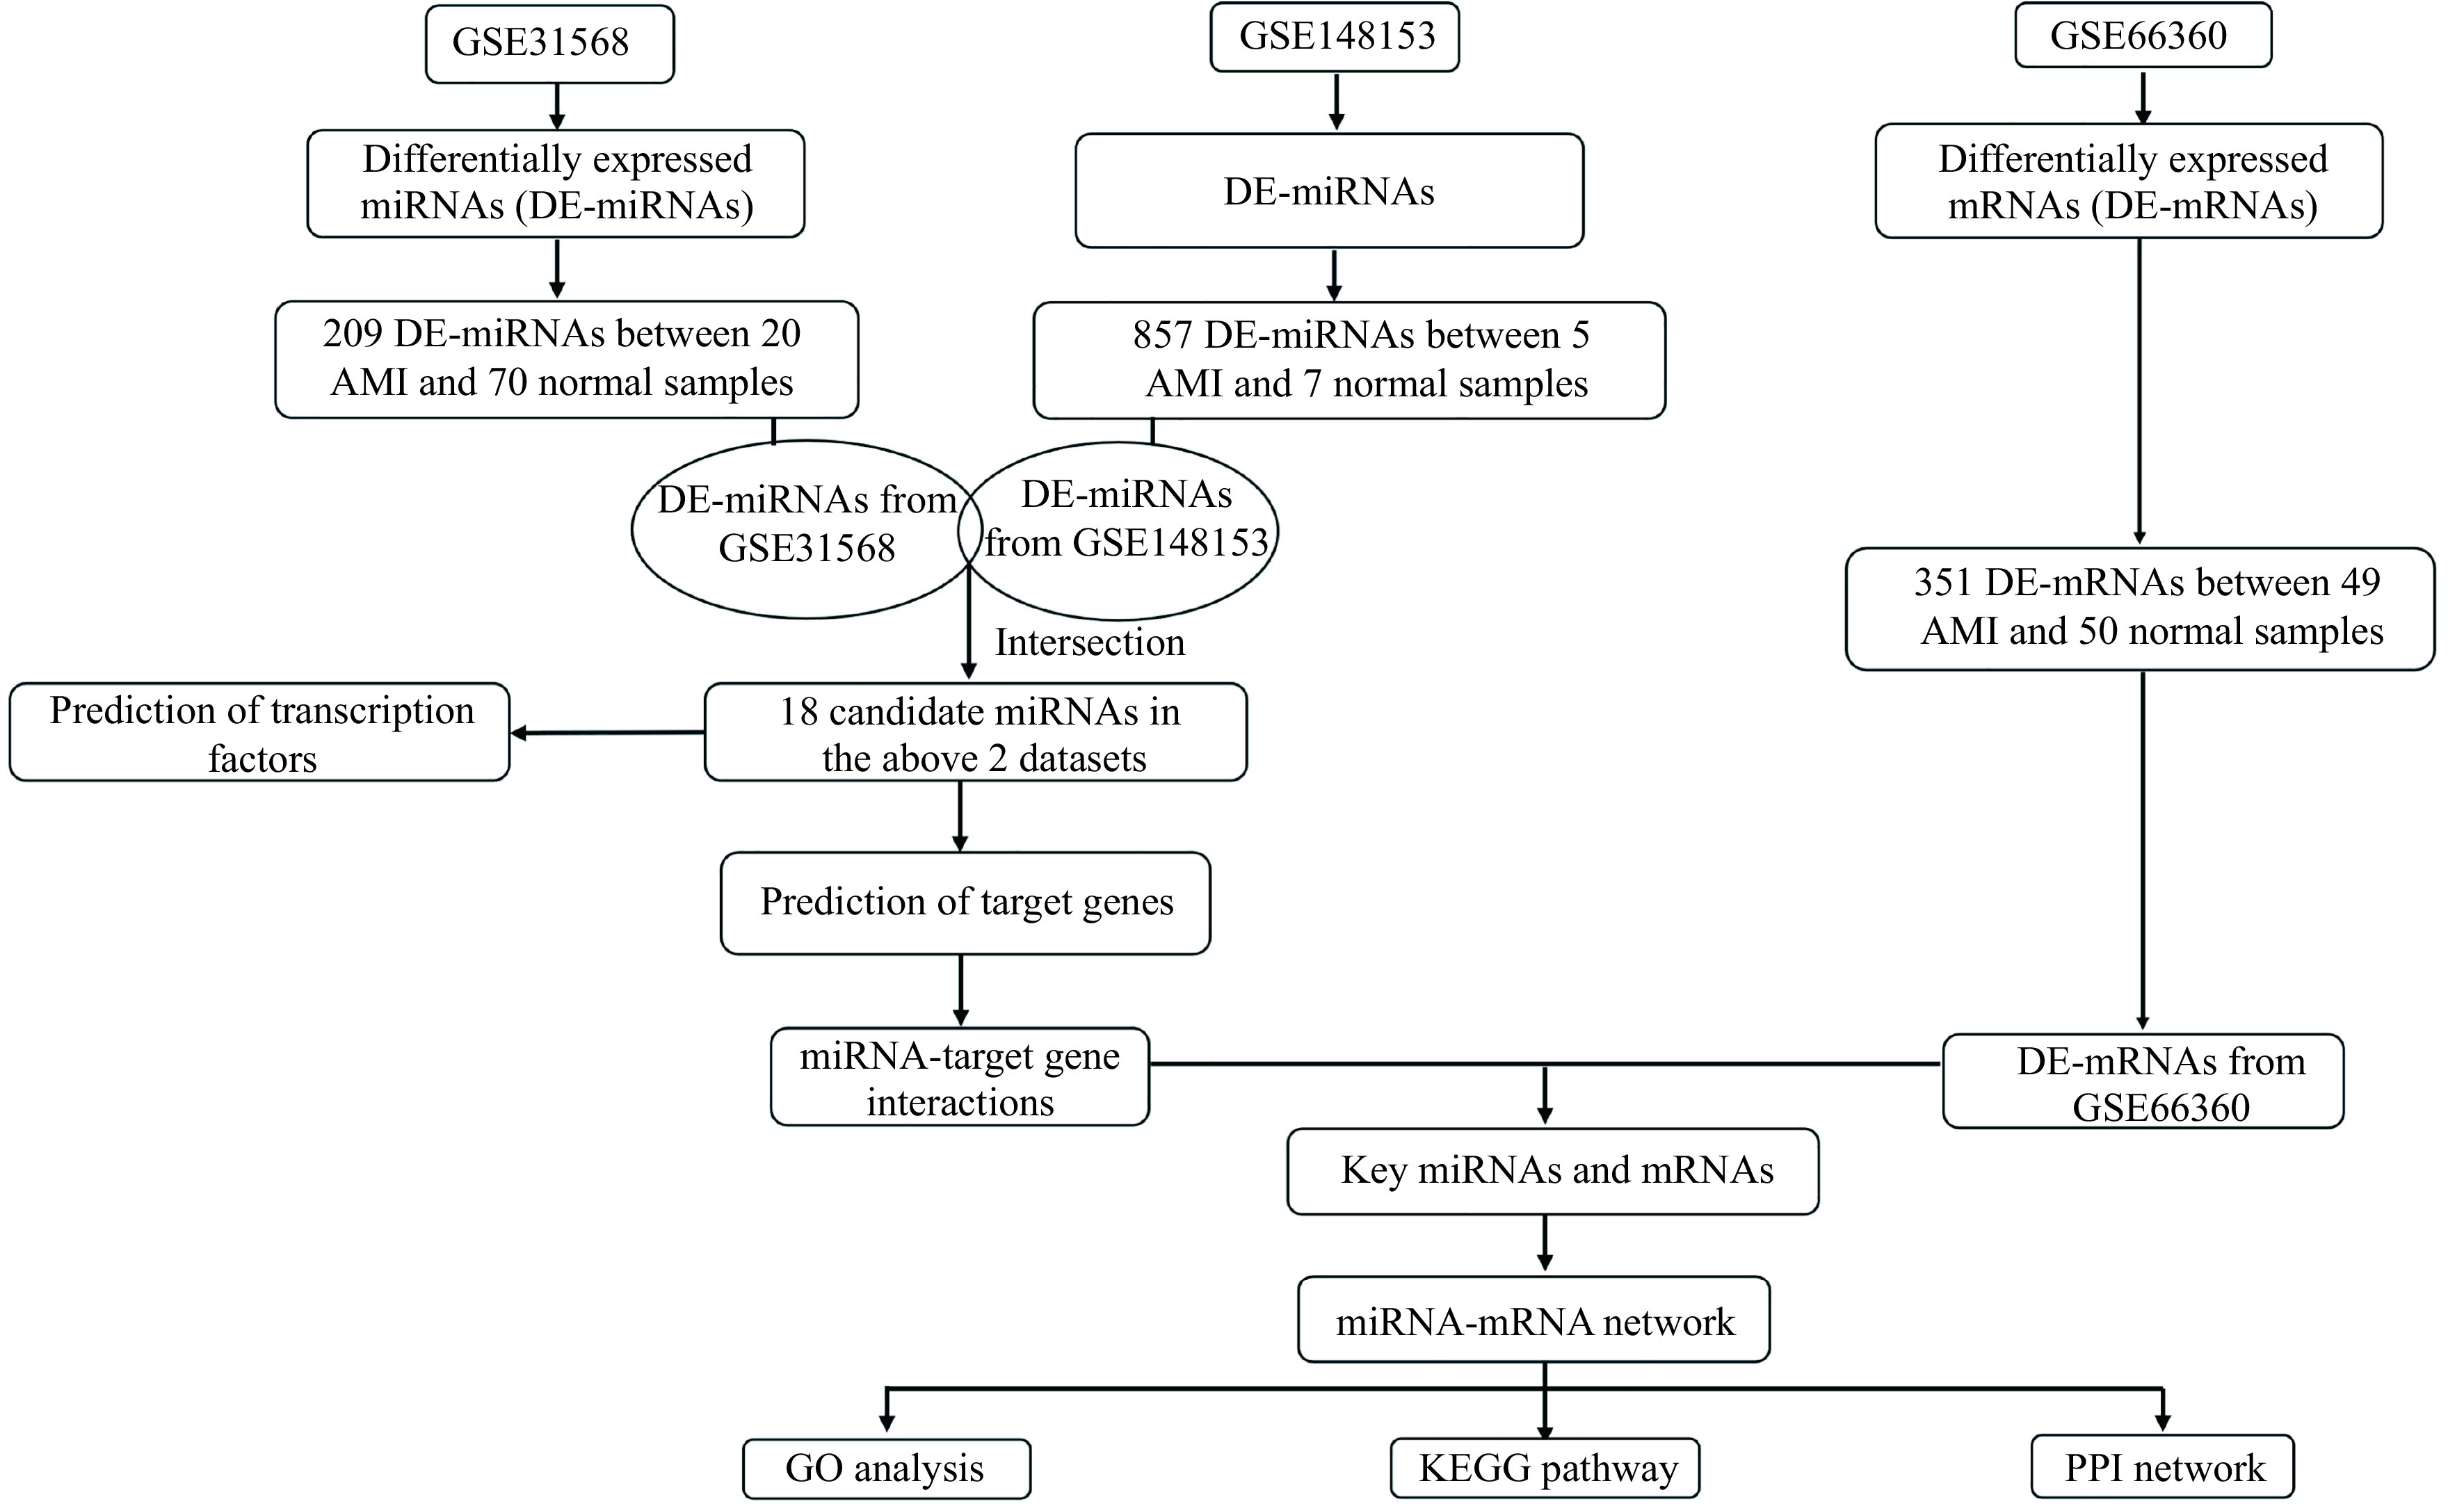
Flow diagram of constructing the miRNA-mRNA regulatory network associated with AMI.
AMI: acute myocardial infarction; GO: Gene Ontology; KEGG: Kyoto Encyclopedia of Genes and Genomes; PPI: protein-protein interaction.
Differential expression analysis
The limma package of R-studio was used to obtain the DE-miRNAs and DE-mRNAs between AMI and control samples. To remove batch effect, Bayesian methods were used. The t-test was applied to calculate the P-values of significant gene expression differences. The DE-miRNAs and DE-mRNAs were screened by the P-values <0.05 and |log 2(fold change)| >1. Meanwhile, DE-miRNAs and DE-mRNAs identified by limma were visualized using heatmaps and volcano plots. The differentially upregulated and downregulated miRNAs identified from GSE31568 and GSE148153 dataset were separately intersected by Venn diagram to obtain the candidate DE-miRNAs that were closely related to MI.
Analysis of transcription factors and DE-miRNA-DE-mRNA pairs
The candidate DE-miRNAs were uploaded to FunRich (Version 3.1.3), a functional enrichment and interaction network analysis tool, to perform transcription factor enrichment analysis[9]. The target mRNAs of candidate DE-miRNAs were predicted by employing three miRNA-target tools: miRDB, miRTarBase, and TargetScan. Then, the obtained miRNA-target relationship was matched with DE-mRNAs obtained by microarray analysis to obtain the interaction between DE-miRNAs and DE-mRNAs (DE-miRNAs-DE-mRNAs relationship pairs).
Construction of the miRNA-mRNA regulatory network
Based on the interaction information of the DE-miRNAs-DE-mRNAs, the miRNA-mRNA network was constructed. Then, the miRNA-mRNA network was visualized by using the Cytoscape 3.7.2 software[10]. The node degrees, betweenness centrality, and closeness centrality of the regulatory network were calculated using the cytoHubba plugin of Cytoscape 3.7.2[11]. The significant miRNAs and genes were selected according to the node degree ranking, betweenness centrality ranking and closeness centrality ranking.
Functional enrichment analysis of genes in the miRNA-mRNA network
In order to investigate the functions of the mRNAs in the network, the Gene Ontology (GO) and the Kyoto Encyclopedia of Genes and Genomes (KEGG) pathway analyses were performed in R-studio. The GO covers three domains: biological process (BP), cellular component (CC), and molecular function (MF). AP-value <0.05 was considered statistically significant.
Construction of protein-protein interaction network
The protein-protein interaction (PPI) network of genes in the miRNA-mRNA network was established by using the STRING database. An interaction score ≥0.4 of PPI pairs was considered statistically significant. Subsequently, Cytoscape software was used to visualize the PPI network. After that, hub genes, considered as the key genes, were obtained by using cytoHubba from Cytoscape.
Statistical analysis
All statistical analyses were performed using R software[12]. Differences between groups were compared using the Student's t-test. The P-values were corrected using the Benjamini & Hochberg method. A value of P<0.05 or an adjustedP-value <0.05 was considered statistically significant.
Results
Identification of DE-miRNAs and DE-mRNAs
After the data preprocessing, 209 DE-miRNAs (94 upregulated and 115 downregulated) in the GSE31568 dataset (Fig. 2A) and 857 DE-miRNAs (191 upregulated and 666 downregulated) in the GSE148153 dataset (Fig. 2B), as well as 351 DE-mRNAs (289 upregulated and 62 downregulated) in the GSE66360 dataset (Fig. 2C and D) were identified, consequently. By using the Venn-diagram, 18 miRNAs were obtained in both GSE31568 dataset and GSE148153 dataset (Fig. 2E and F). All intersecting DE-miRNAs are shown in Table 1.
Figure 2.
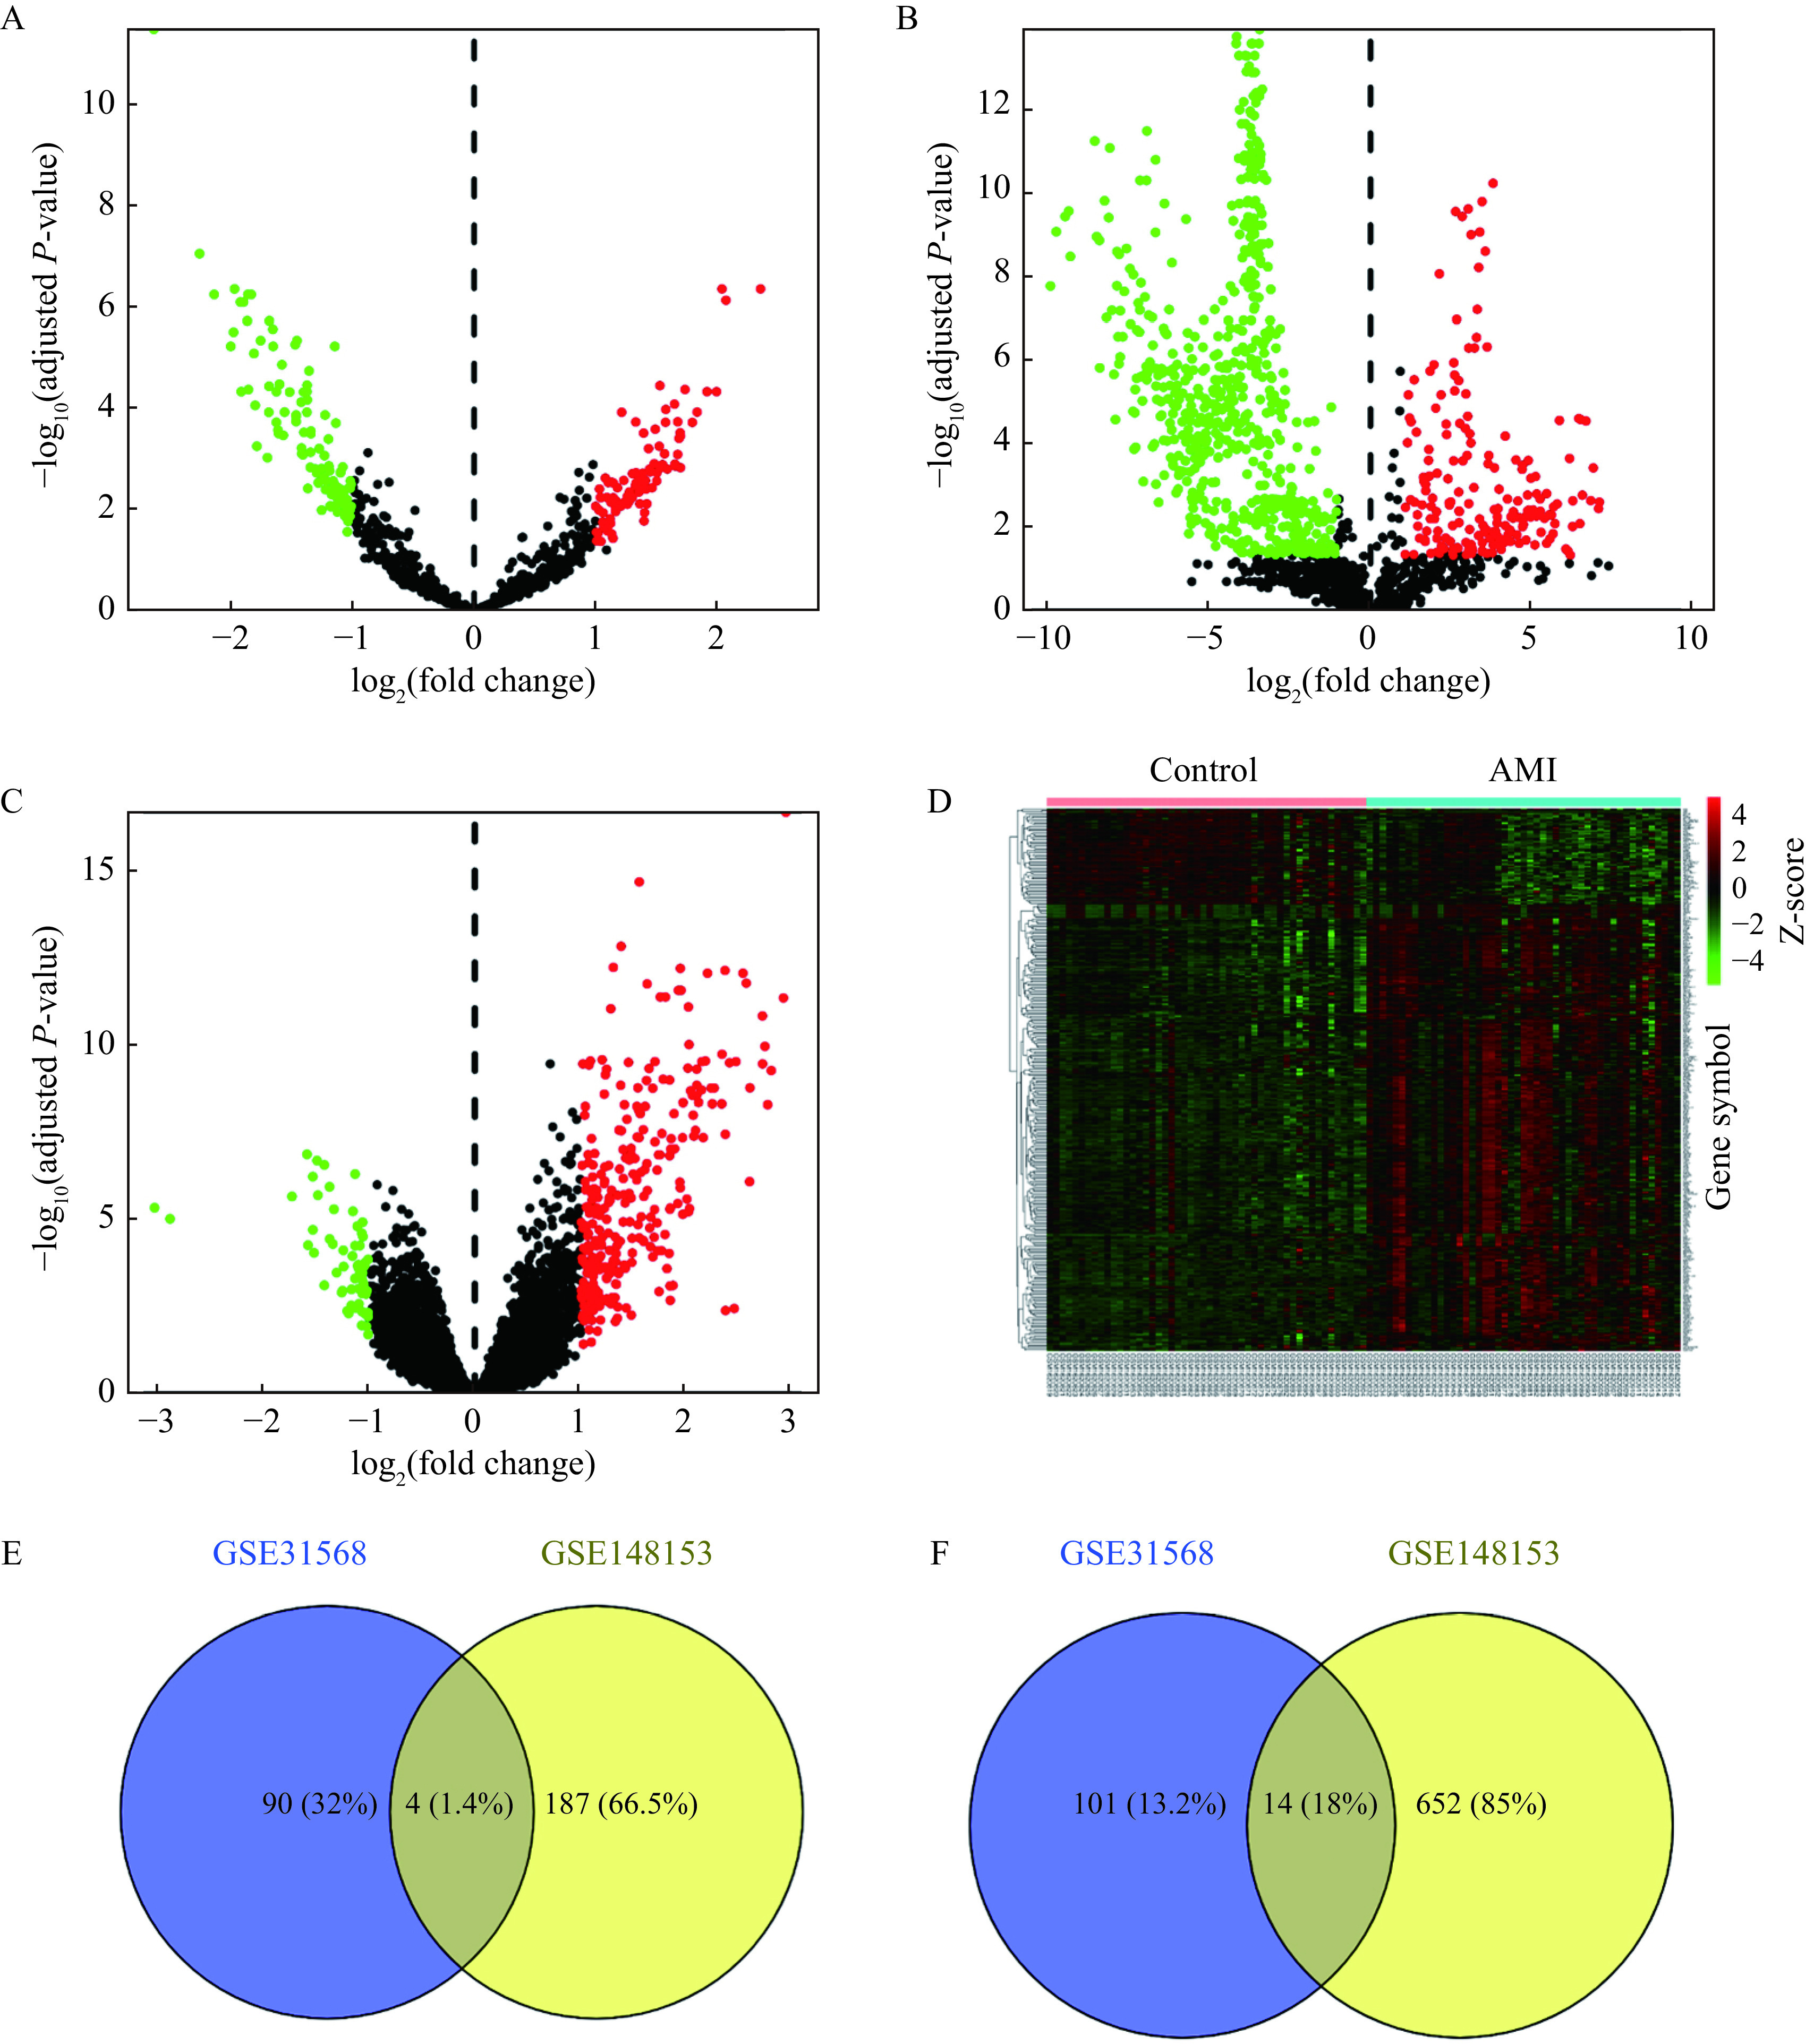
Identification of DE-miRNAs and DE-mRNAs between the AMI and normal control samples.
A–B: Volcano plots of DE-miRNAs in GSE31568 (A) and GSE148153 (B). Red dot indicates upregulated miRNAs and green dot indicates downregulated miRNAs. C: Volcano plot of DE-mRNAs in GSE66360. Red dot represents upregulated mRNAs and green dot represents downregulated mRNAs. D: Heatmap of DE-mRNAs in GSE66360. The horizontal axis represents sample names and the vertical axis represents gene symbol names. The left 50 samples were from the control group, and the right 49 samples were from the AMI group. Red indicates upregulated mRNAs. Green indicates downregulated mRNAs. P-values were determined using the Student's t-test. Adjusted P-value <0.05 and |log 2(fold change)| >1 were considered statistically significant. E and F: Venn-diagram of upregulated (E) and downregulated (F) DE-miRNAs in AMI between GSE31568 and GSE148153. AMI: acute myocardial infarction; DE-miRNAs: differentially expressed miRNAs; DE-mRNAs: differentially expressed mRNAs.
Table 1. The candidate differentially expressed miRNAs in both GSE31568 and GSE148153 datasets.
| miRNA | Up/Down |
| The miRNAs with log2(fold change) >1 were up-regulated and the miRNAs with log 2(fold change) < –1 were down-regulated.
| |
| miR-142-3p | Up |
| miR-455-5p | Up |
| miR-140-5p | Up |
| miR-1281 | Up |
| miR-635 | Down |
| miR-509-3-5p | Down |
| miR-188-3p | Down |
| miR-654-5p | Down |
| miR-127-5p | Down |
| miR-512-5p | Down |
| miR-767-5p | Down |
| miR-934 | Down |
| miR-634 | Down |
| miR-938 | Down |
| miR-646 | Down |
| miR-509-5p | Down |
| miR-298 | Down |
| miR-1291 | Down |
Transcription factor enrichment analysis
Transcription factor enrichment analysis for the candidate DE-miRNAs was performed by FunRich software, which includes three different background databases namely FunRich, UniProt, and Custom[13]. The P-value <0.05 was considered statistically significant. According to the result of FunRich software, there were a total of 15 253 genes in background, while 592 genes were mapped into 196 transcription factors. The top 10 transcription factors which had strong closeness to the candidate DE-miRNAs included EGR1, SP4, SP1, POU2F1, SOX1, NKX6-1, IRF1, FOXK1, STAT1, and SOAT1 (Fig. 3).
Figure 3.

The transcription factor enrichment for candidate differentially expressed miRNAs predicted by Funrich.
The vertical axis represents percentage of genes and the horizontal axis represents the top 10 transcription factors. Percentage of genes: the number of genes associated with transcription factor/the number of all genes in the dataset. P-value <0.05 was considered as statistically significant.
The miRNA-mRNA network in AMI
Based on the three miRNA-target tools, we obtained 8468 miRNA-target gene pairs of candidate 18 miRNAs. Then, the target genes were further filtered by matching the DE-mRNAs. After matching with DE-mRNAs, we obtained 95 pairs of DE-miRNAs-DE-mRNAs, which included 1 upregulated and 12 downregulated miRNAs, as well as 65 upregulated and 3 downregulated mRNAs. For the sake of investigating the role of miRNAs in AMI, a miRNA-mRNA regulatory network, consisting of 81 nodes and 95 interactions, was constructed, which is shown in Fig. 4. We used the plugin cytoHubba in Cytoscape to find hub miRNAs and genes according to parameters such as degree, closeness centrality, and between closeness, etc. The top five miRNAs in the network were miR-646, miR-127-5p, miR-509-5p, miR-509-3-5p, and miR-767-5p, and the top 5 genes were CDKN1A, CREB5, KCNJ2, EPAS1, and THBS1 (Table 2).
Figure 4.
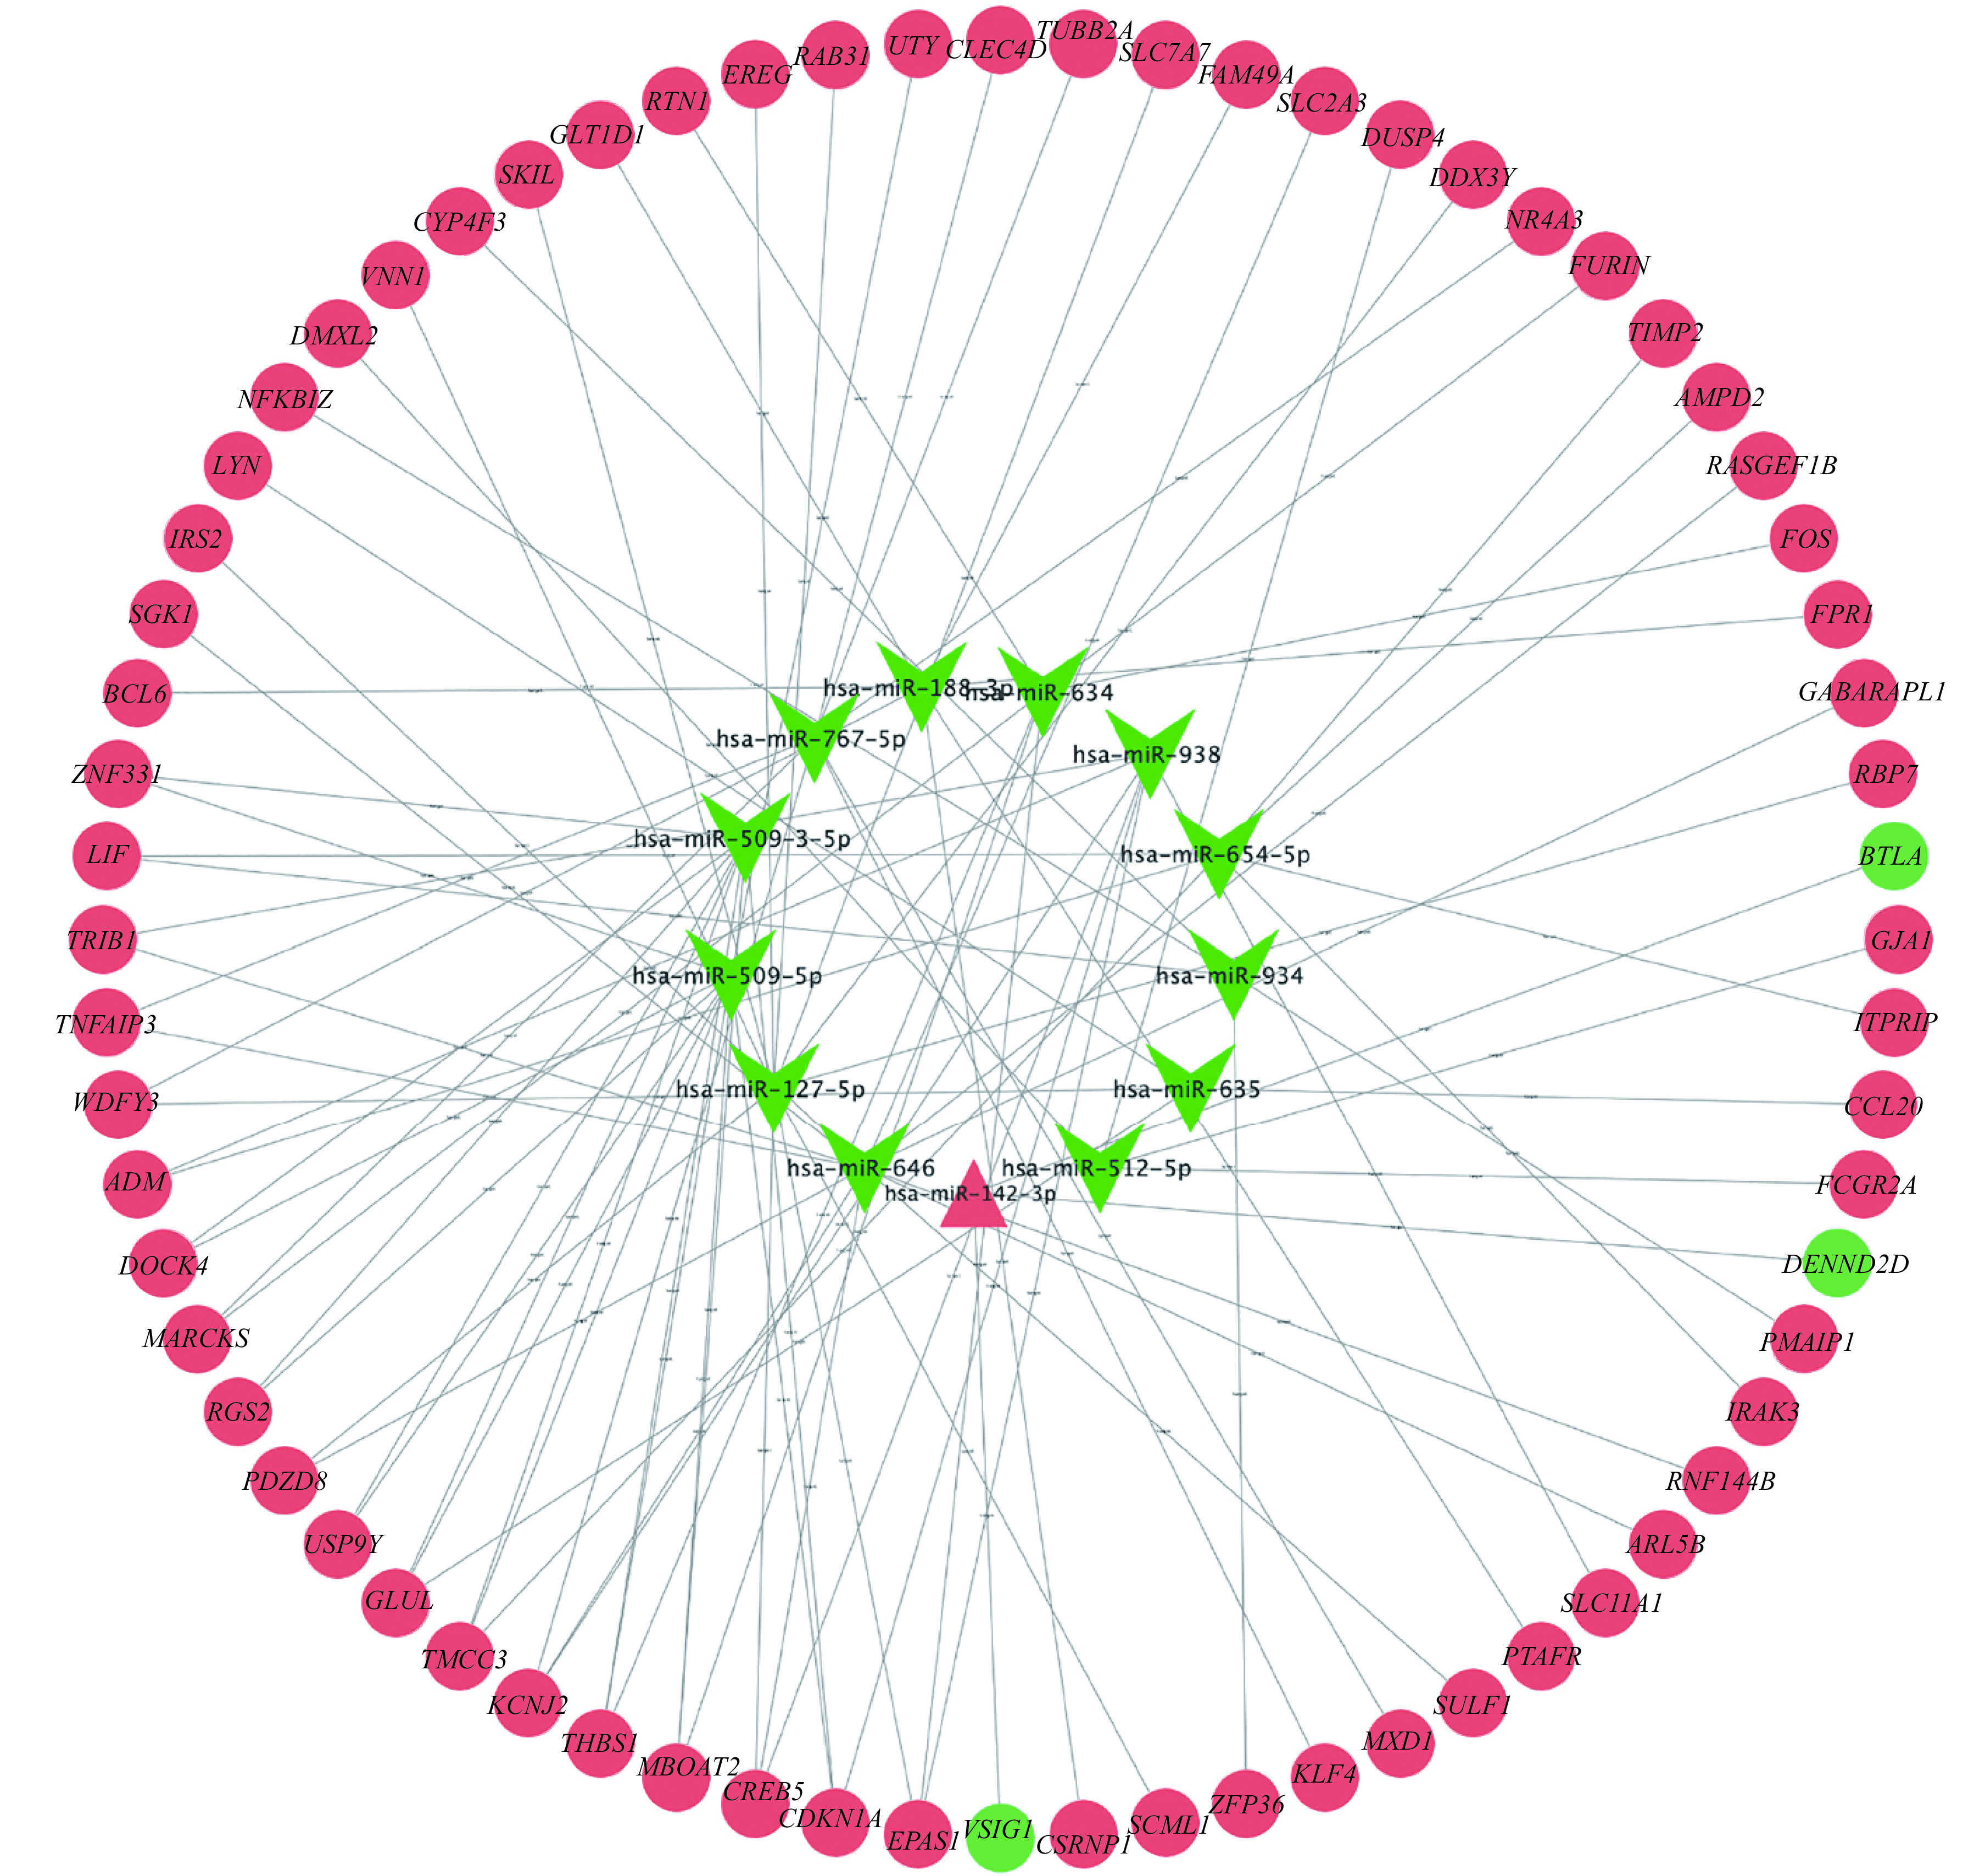
The miRNA-mRNA regulatory network.
Based on the interaction information of the DE-miRNAs-DE-miRNAs, the construction of miRNA-mRNA regulatory network was performed using the Cytoscape software. Red triangle represents upregulated miRNA, green arrows represent downregulated miRNAs, red circles upregulated genes, and green circles downregulated genes.
Table 2. Top five miRNAs and top five genes in the miRNA-mRNA network.
| miRNA/gene | Degree | Closeness
centrality |
Betweenness
centrality |
| miR-646 | 13 | 0.239 | 0.259 |
| miR-127-5p | 11 | 0.236 | 0.232 |
| miR-509-5p | 10 | 0.274 | 0.235 |
| miR-509-3-5p | 9 | 0.272 | 0.207 |
| miR-767-5p | 8 | 0.227 | 0.158 |
| CDKN1A | 3 | 0.272 | 0.186 |
| CREB5 | 3 | 0.268 | 0.134 |
| KCNJ2 | 3 | 0.264 | 0.143 |
| EPAS1 | 3 | 0.262 | 0.151 |
| THBS1 | 3 | 0.253 | 0.069 |
Functional enrichment analysis
In this study, the GO analysis of the genes in the regulatory network showed that a total of 806 BP terms, 35 MF terms, and 30 CC terms were significantly enriched. The BP terms were mainly enriched in the positive regulation of leukocyte activation, negative regulation of transferase activity, regulation of smooth muscle cell proliferation, smooth muscle cell proliferation, and muscle cell proliferation (Fig. 5A and B). The significantly enriched CC terms included secretory granule membrane, tertiary granule, ficolin-1-rich granule, ficolin-1-rich granule membrane and tertiary granule membrane (Fig. 5C). The significantly enriched MF terms included 14-3-3 protein binding, protein kinase inhibitor activity, kinase inhibitor activity, SMAD binding, and cAMP response element binding (Fig. 5D). The five most significantly enriched pathways in KEGG included the TNF signaling pathway, FOXO signaling pathway, colorectal cancer, Kaposi sarcoma-associated herpesvirus infection, and p53 signaling pathway (Fig. 6).
Figure 5.
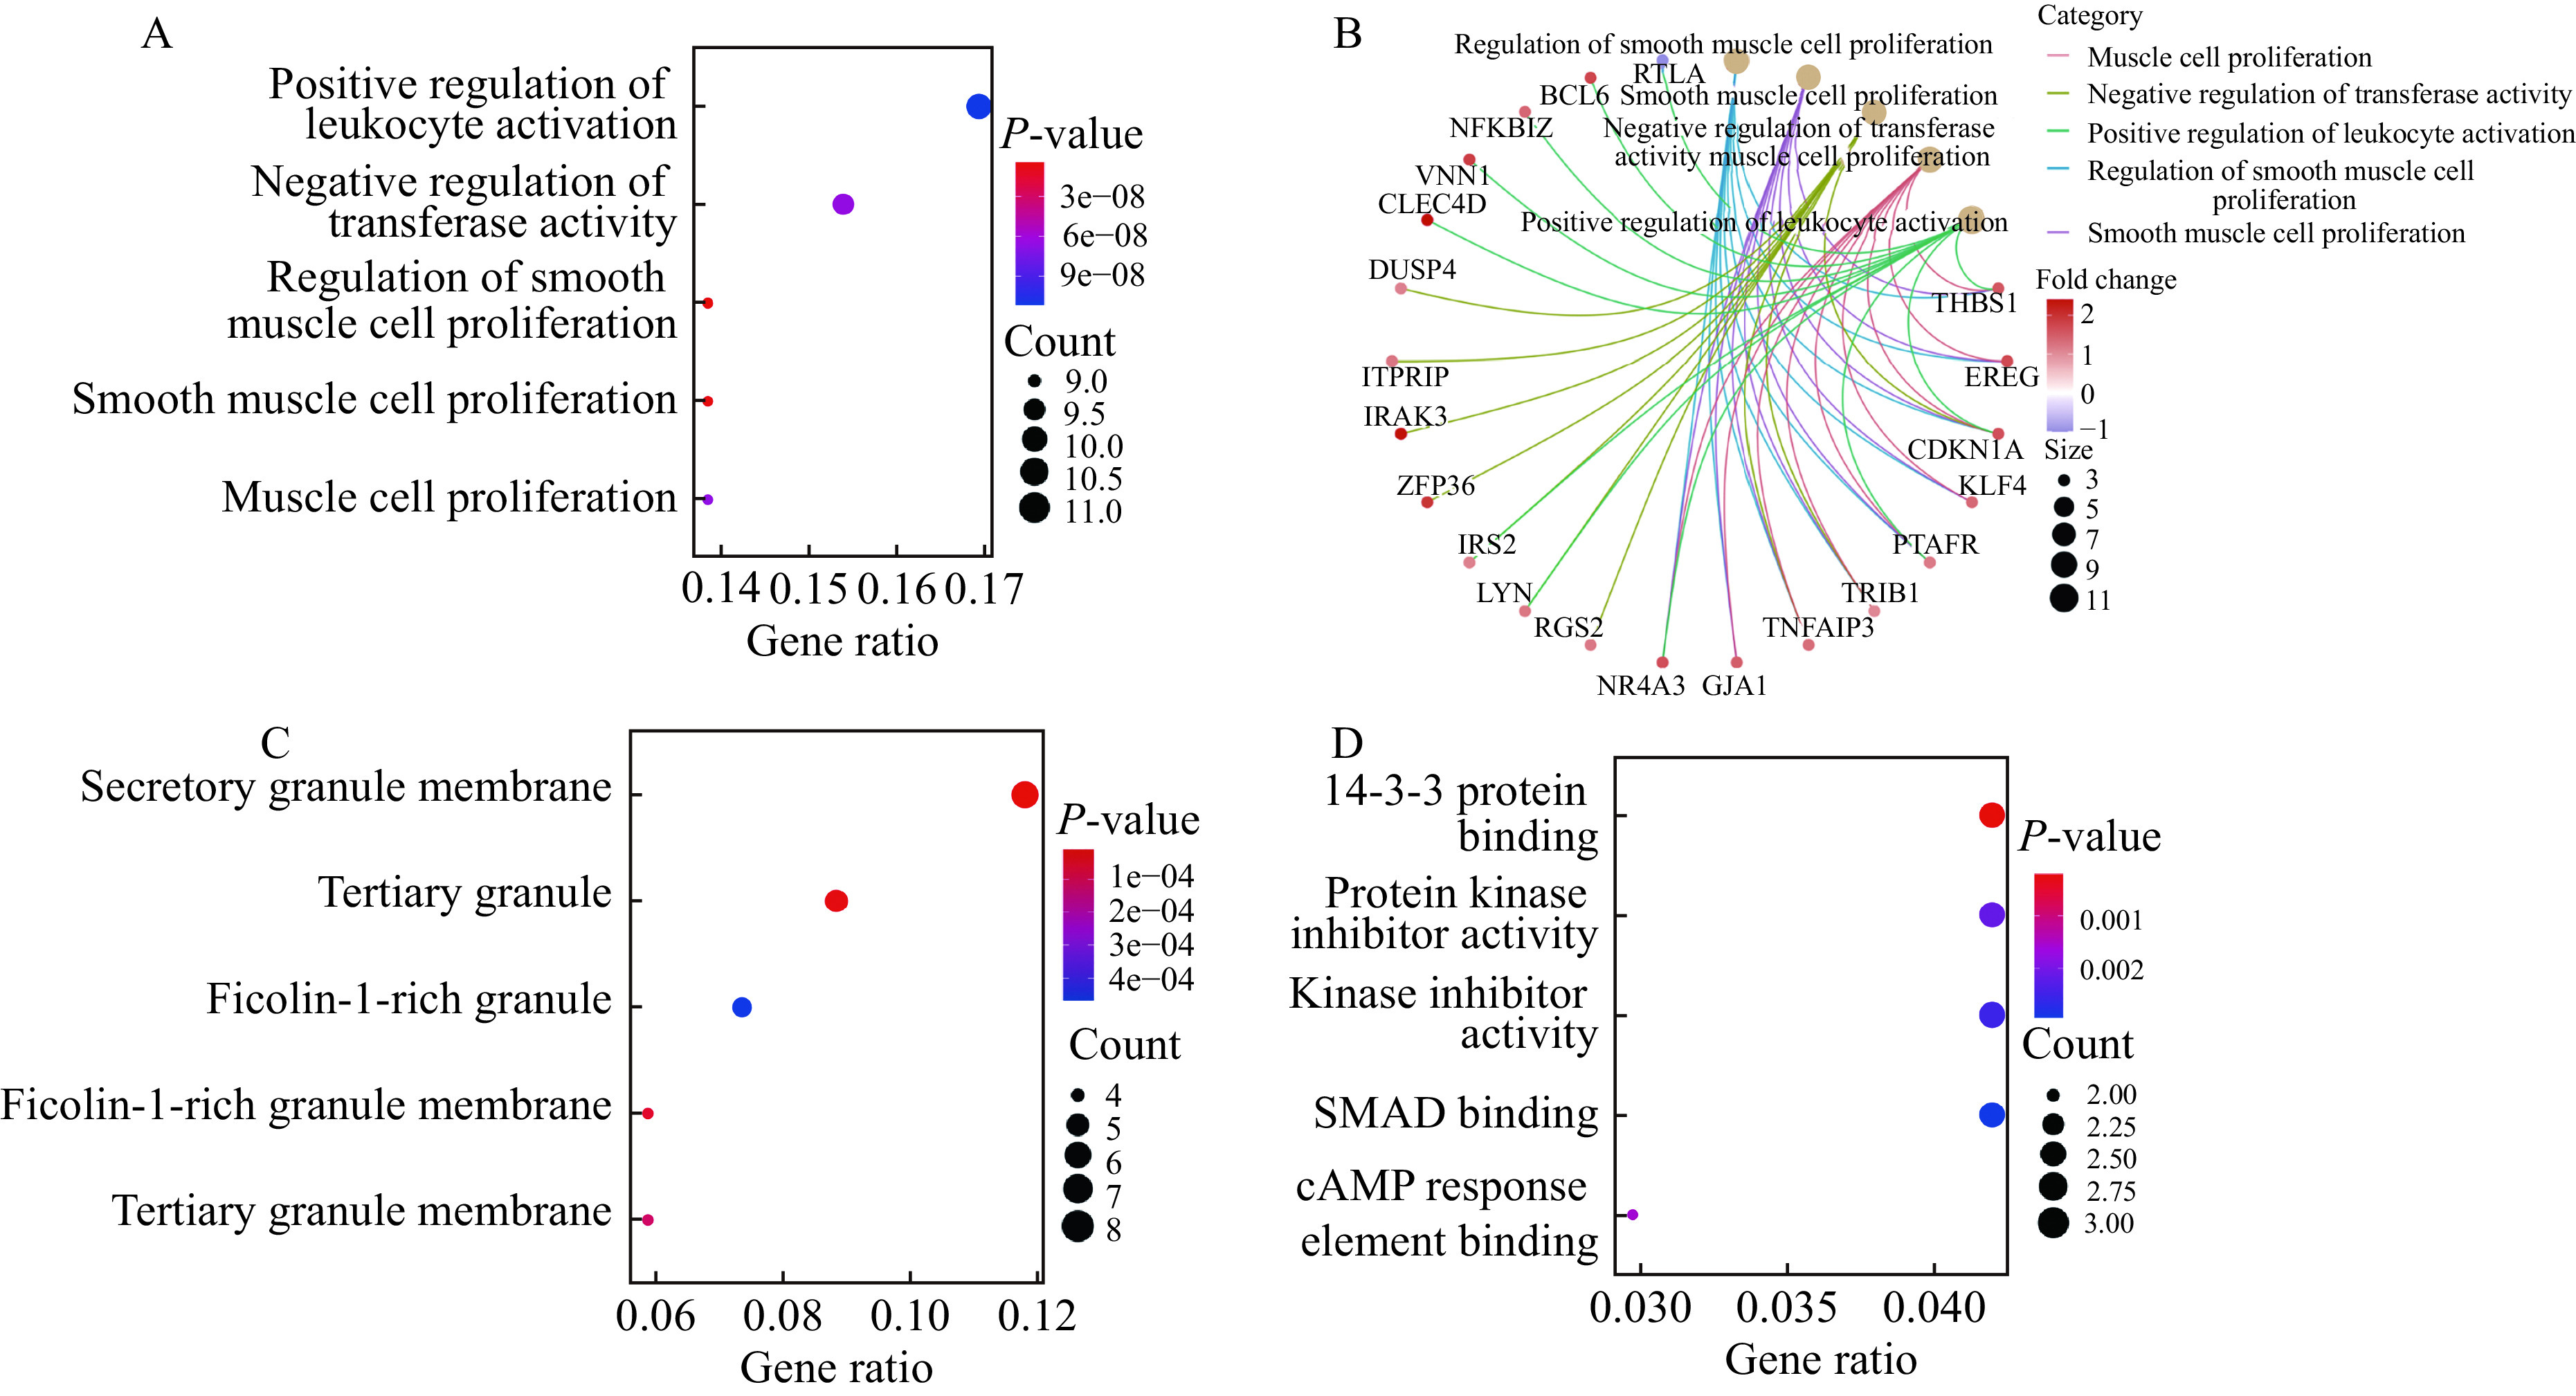
The GO analyses of genes in the miRNA-mRNA network.
The GO analysis of genes involved in the miRNA-mRNA network was carried out using R clusterprofiler package. A–D: The enriched GO terms in biological process (A), the relationship between genes and enriched pathways in biological process terms (B), cellular component (C) and molecular function (D). Gene ratio represents the ratio of the number of genes enriched in one GO term to the total number of differentially expressed genes. P-value <0.05 was considered as statistically significant. GO: Gene Ontology.
Figure 6.

The KEGG pathway analyses for genes in the miRNA-mRNA network.
The KEGG pathway analysis of genes involved in the miRNA-mRNA network was carried out using R clusterprofiler package. The horizontal axis represents the number of genes enriched in one KEGG pathway. P-value <0.05 was considered statistically significant. KEGG: Kyoto Encyclopedia of Genes and Genomes.
PPI network construction
Genes in the miRNA-mRNA network were used to construct a PPI network, which included 50 edges and 39 nodes. The top 10 hub genes ranked by degree method are FOS, LYN, CDKN1A, FPR1, TNFAIP3, CLEC4D, GJA1, KLF4, PTAFR, and SLC11A1 (Fig. 7). The degree score is shown in Table 3.
Figure 7.

PPI network of genes in the miRNA-mRNA network by STRING database.
A: The PPI network. B: The top 10 hub genes in the PPI network. The higher the degree score, the higher the core level of the gene in the network. PPI: protein-protein interaction.
Table 3. Top 10 genes in the PPI network ranked by degree method.
| Rank | Gene symbol | Degree score |
| PPI: protein-protein interaction. | ||
| 1 | FOS | 13 |
| 2 | LYN | 6 |
| 3 | CDKN1A | 5 |
| 3 | FPR1 | 5 |
| 3 | TNFAIP3 | 5 |
| 6 | CLEC4D | 4 |
| 6 | GJA1 | 4 |
| 6 | KLF4 | 4 |
| 6 | PTAFR | 4 |
| 6 | SLC11A1 | 4 |
Discussion
AMI is an acute and severe cardiovascular disease with increasingly high incidence and prevalence[14]. Given the high mortality rate of MI, it is urgently needed to identify effective interventions to prevent and treat MI. Multiple studies proved that miRNAs are involved in the occurrence and development of AMI[15–16]. However, the molecular mechanisms of MI remain unknown and there are still many unidentified miRNAs associated with MI. Therefore, the constructed miRNA-mRNA network, which may unveil the mechanisms of MI, could help identify potential novel biomarkers to improve the accuracy of MI diagnosis.
In this study, we carried out an integrated analysis to identify changes of miRNA and mRNA expression in AMI. A total of 209 DE-miRNAs (94 upregulated and 115 downregulated) in the GSE31568 dataset and 857 DE-miRNAs (191 upregulated and 666 downregulated) in the GSE148153 dataset, as well as 351 DEMs (289 upregulated and 62 downregulated) in the GSE66360 dataset were identified. There were 18 candidate DE-miRNAs in both GSE31568 and GSE148153 datasets. In the miRNA-mRNA network, miR-646, miR-127-5p, miR-509-5p, miR-509-3-5p, and miR-767-5p were shown to have a higher degree. Besides, genes in the miRNA-mRNA network were mainly involved in the regulation of TNF signaling pathway and FOXO signaling pathway. In addition, THBS-1 served as an important regulator in the miRNA-mRNA network and FOS was a significant regulator in the PPI network. Also, CDKN1A was important in both miRNA-mRNA network and PPI network.
Close functional relationships were found between transcription factors and miRNA by some previous studies. They can form regulatory networks and play an important role in the occurrence and development of diseases[17–18]. Thus, transcription factors for candidate DE-miRNAs were predicted. A study showed that EGR-1 could function as a master regulator of remote preconditioning inducing a protective effect against myocardial ischemia reperfusion injury[19]. Additionally, Wang et al revealed that EGR-1 could be involved in coronary microembolization-induced myocardial injury via Bim/Beclin-1 pathway-mediated autophagy inhibition and apoptosis activation. Specificity protein 1 (SP1), a ubiquitous transcription factor, plays an important role in apoptosis[20], fibrosis[21], and inflammation[22]. In 2016, Li et al revealed that miR-7a/b could improve post-myocardial infarction remodeling by inhibiting SP1 and PARP-1 expression[23]. Similarly, previous studies showed that pathological stiffness can upregulate the transcription factor POU2F1 to promote cardiac fibroblast differentiation in mouse myocardial infarction tissue[24]. Therefore, the role of transcription factors is in accord with the importance of the candidate DE-miRNAs in the pathogenesis of AMI.
In addition, we found several miRNAs with a higher degree in the miRNA-mRNA regulatory network, including miR-646, miR-127-5p, miR-509-5p, miR-509-3-5p, and miR-767-5p. Zhao et al found that miR-646 serves an important role in AMI[25]. In their study, they constructed circRNA-miRNA interaction networks and identified crucial cirRNAs in AMI patients. Four upregulated circRNAs were predicted to four miRNAs including miR-491-3p, miR-646, miR-603, and miR-922 at the same time. Similarly, miR-646 was considered as a crucial miRNA in our study. Also, a study showed that the overexpression of miR-646 could downregulate EGFR/Akt pathway and inhibit lung cancer cell proliferation and metastasis[26]. Moreover, EGFR pathway is closely involved in promoting cardiac fibrosis after MI[27]. The miR-646 network might play its role in myocardial infarction via regulating endothelial function. Previous studies showed that miR-127-5p was considered to be potential genetic diagnosis biomarkers for MI[28]. Moreover, TGF-β1/Smad3 signaling pathway is related to left ventricular remodeling after myocardial ischemia-reperfusion[29]. Xuet al proved that miR-127 could aggravate myocardial failure by promoting the TGFβ1/Smad3 signaling pathway[30]. The miR-127 might be significant in myocardial infarction via the TGFβ1/Smad3 signaling pathway. Karolina et al found that miR-509-5p could be a potential contributor of dyslipidemia in metabolic syndrome, which is one of the most dangerous initiators responsible for MI[31–32]. The miR-509-5p may serve as a key function in the progression of MI. Previous studies showed that miR-509-3-5p could cause aberrant mitosis and anti-proliferative effect by suppressing PLK1 in human lung cancer A549 cells. Although MI can result in massive cardiomyocyte loss, several lines of evidence suggest that the heart could be capable of efficient regeneration[33]. PLK1 is an essential component of cardiomyocyte proliferation during heart regeneration[33]. Thus, miR-509-3-5p might be a key regulator for cardiomyocyte proliferation after AMI by targeting PLK1, and miRNA-767-5p is a novel oncogenesis-associated miRNA[34]. However, there is no evidence regarding the role of miR-767-5p in AMI. Nevertheless, miR-646, miR-127-5p, miR-509-5p, miR-509-3-5p, and miR-767-5p may be effective biomarkers and potential therapeutic targets for AMI.
CDKN1A, a cell cycle regulator, was a hub in the miRNA-mRNA network and PPI network. CDKN1A has been linked to human fibroblast proliferation[35]. MI may lead to structural remodeling with fibroblast activation and differentiation[36]. Therefore, CDKN1A may be related to the progression of MI. However, experiment verification should be performed in future. Thrombospondin-1 (THBS-1) and FOS were key genes in miRNA-mRNA network and PPI network, respectively. THBS-1, a potent inhibitor of angiogenesis and activator of transforming growth factor, could prevent the expansion of healing myocardial infarcts. FOS, a proto-oncogene, is related to tissue development and cellular stress, as well as malignant transformation and progression in numerous tumors[37]. Isoyama et al revealed that c-FOS expression was diminished in aged rat hearts compared with young adult hearts against ischemia injury[38], implying its potential role in AMI. Thus, CDKN1A, THBS-1, and FOS may all be necessary for AMI.
KEGG pathway analysis showed that TNF signaling pathway and FOXO signaling pathway were the two most significant pathways. It is well documented that the activation of TNF signaling pathway is involved in AMI. A study performed by Sugano et al showed that the inhibition of TNF-α reduced the infarct size in AMI following ischemia and reperfusion[39]. In contrast, administration of low-dose TNF prior to ischemia reperfusion could reduce the infarct size[40]. Likewise, FOXOs have special functions in ischemia-associated myocardial injury. Hsu et al showed that FOXO1 has a protective effect against cardiac ischemia through its anti-oxidative property[41]. FOXO3 knockout mice exhibit enlarged myocardial infarct sizes upon ischemia/reperfusion[42]. Therefore, the intervention of TNF signaling pathway or FOXO signaling pathway may represent novel therapeutic strategies for AMI.
In conclusion, we constructed the miRNA-mRNA network in AMI and identified several miRNAs (miR-646, miR-127-5p, miR-509-5p, miR-509-3-5p, and miR-767-5p), genes (CDKN1A, THBS1, and FOS), and pathways (TNF signaling pathway and FOXO signaling pathway), which may play a significant role in the occurrence and development of AMI. Therefore, these miRNAs and genes could be used as candidate biomarkers and potential therapeutic targets for patients with AMI.
Limitations
However, there were still some limitations. These findings were identified with relatively small sample size, which may have restricted the generalizability of the results. Further validation is needed with a large sample study when possible. Besides, experimental validation of these findings was not performed due to resource limitation. Molecular biology experiments are expected to validate the findings of this study in the future.
This study was supported by the funds from the National Natural Science Foundation of China (Grant No. 81871359 and No. 81800445). The authors acknowledge the Gene Expression Omnibus (GEO) database for providing data of AMI available.
Acknowledgments
This study was supported by the funds from the National Natural Science Foundation of China (Grant No. 81871359 and No. 81800445). The authors acknowledge the Gene Expression Omnibus (GEO) database for providing data of AMI available.
Footnotes
CLC number: R542.2, Ducument code: A
The authors reported no conflict of interests.
Contributor Information
Jing Zhang, Email: zj_njmu@163.com.
Di Xu, Email: xudi@jsph.org.cn.
References
- 1.Liu X, Gao J, Xia Q, et al Increased mortality and aggravation of heart failure in liver X receptor-α knockout mice after myocardial infarction. Heart Vessels. 2016;31(8):1370–1379. doi: 10.1007/s00380-015-0781-y. [DOI] [PubMed] [Google Scholar]
- 2.Ziegler M, Wang X, Peter K Platelets in cardiac ischaemia/reperfusion injury: a promising therapeutic target. Cardiovasc Res. 2019;115(7):1178–1188. doi: 10.1093/cvr/cvz070. [DOI] [PMC free article] [PubMed] [Google Scholar]
- 3.Liu J, Wu P, Wang Y, et al Ad-HGF improves the cardiac remodeling of rat following myocardial infarction by upregulating autophagy and necroptosis and inhibiting apoptosis. https://www.ncbi.nlm.nih.gov/pmc/articles/PMC5126308/ Am J Transl Res. 2016;8(11):4605–4627. [PMC free article] [PubMed] [Google Scholar]
- 4.Wang C, Jing Q Non-coding RNAs as biomarkers for acute myocardial infarction. Acta Pharmacol Sin. 2018;39(7):1110–1119. doi: 10.1038/aps.2017.205. [DOI] [PMC free article] [PubMed] [Google Scholar]
- 5.Mirzavi F, Ebrahimi S, Ghazvini K, et al Diagnostic, Prognostic, and Therapeutic Potencies of Circulating miRNAs in Acute Myocardial Infarction. Crit Rev Eukaryot Gene Expr. 2019;29(4):333–342. doi: 10.1615/CritRevEukaryotGeneExpr.2019028211. [DOI] [PubMed] [Google Scholar]
- 6.Tony H, Meng K, Wu B, et al MicroRNA-208a Dysregulates Apoptosis Genes Expression and Promotes Cardiomyocyte Apoptosis during Ischemia and Its Silencing Improves Cardiac Function after Myocardial Infarction. Mediators Inflamm. 2015;2015:479123. doi: 10.1155/2015/479123. [DOI] [PMC free article] [PubMed] [Google Scholar]
- 7.Yu Y, Liu H, Yang D, et al Aloe-emodin attenuates myocardial infarction and apoptosis via up-regulating miR-133 expression . Pharmacol Res. 2019;146:104315. doi: 10.1016/j.phrs.2019.104315. [DOI] [PubMed] [Google Scholar]
- 8.Qiao GH, Zhu P, Yue L, et al MiR-125b Improves acute myocardial infarction in rats by regulating P38/Sirtl/P53 signaling pathway. J Biol Regul Homeost Agents. 2020;34(4):1297–1306. doi: 10.23812/20-177-A. [DOI] [PubMed] [Google Scholar]
- 9.Zhu M, Ye M, Wang J, et al Construction of Potential miRNA-mRNA Regulatory Network in COPD Plasma by Bioinformatics Analysis. Int J Chron Obstruct Pulmon Dis. 2020;15:2135–2145. doi: 10.2147/COPD.S255262. [DOI] [PMC free article] [PubMed] [Google Scholar]
- 10.Shannon P, Markiel A, Ozier O, et al Cytoscape: a software environment for integrated models of biomolecular interaction networks. Genome Res. 2003;13(11):2498–2504. doi: 10.1101/gr.1239303. [DOI] [PMC free article] [PubMed] [Google Scholar]
- 11.Chin CH, Chen SH, Wu HH, et al cytoHubba: identifying hub objects and sub-networks from complex interactome. BMC Syst Biol. 2014;8Suppl4(Suppl4):S11. doi: 10.1186/1752-0509-8-S4-S11. [DOI] [PMC free article] [PubMed] [Google Scholar]
- 12.Zhang C, Berndt-Paetz M, Neuhaus J A Comprehensive Bioinformatics Analysis of Notch Pathways in Bladder Cancer. Cancers (Basel) 2021;13(12):3089. doi: 10.3390/cancers13123089. [DOI] [PMC free article] [PubMed] [Google Scholar]
- 13.Pathan M, Keerthikumar S, Ang CS, et al FunRich: An open access standalone functional enrichment and interaction network analysis tool. Proteomics. 2015;15(15):2597–2601. doi: 10.1002/pmic.201400515. [DOI] [PubMed] [Google Scholar]
- 14.Wu L, Xu Y, Yang Z, et al Hydroxytyrosol and olive leaf extract exert cardioprotective effects by inhibiting GRP78 and CHOP expression. J Biomed Res. 2018;32(5):371–379. doi: 10.7555/JBR.32.20170111. [DOI] [PMC free article] [PubMed] [Google Scholar]
- 15.Kowara M, Borodzicz-Jazdzyk S, Rybak K, et al Therapies Targeted at Non-Coding RNAs in Prevention and Limitation of Myocardial Infarction and Subsequent Cardiac Remodeling-Current Experience and Perspectives. Int J Mol Sci. 2021;22(11):5718. doi: 10.3390/ijms22115718. [DOI] [PMC free article] [PubMed] [Google Scholar]
- 16.Parikh M, Pierce GN A Brief Review on the Biology and Effects of Cellular and Circulating microRNAs on Cardiac Remodeling after Infarction. Int J Mol Sci. 2021;22(9):4995. doi: 10.3390/ijms22094995. [DOI] [PMC free article] [PubMed] [Google Scholar]
- 17.Diakos C, Zhong S, Xiao Y, et al TEL-AML1 regulation of survivin and apoptosis via miRNA-494 and miRNA-320a . Blood. 2010;116(23):4885–4893. doi: 10.1182/blood-2009-02-206706. [DOI] [PMC free article] [PubMed] [Google Scholar]
- 18.Guo Z, Maki M, Ding R, et al Genome-wide survey of tissue-specific microRNA and transcription factor regulatory networks in 12 tissues. Sci Rep. 2014;4:5150. doi: 10.1038/srep05150. [DOI] [PMC free article] [PubMed] [Google Scholar]
- 19.Billah M, Ridiandries A, Rayner BS, et al Egr-1 functions as a master switch regulator of remote ischemic preconditioning-induced cardioprotection. Basic Res Cardiol. 2019;115(1):3. doi: 10.1007/s00395-019-0763-9. [DOI] [PubMed] [Google Scholar]
- 20.Kavurma MM, Santiago FS, Bonfoco E, et al Sp1 phosphorylation regulates apoptosis via extracellular FasL-Fas engagement . J Biol Chem. 2001;276(7):4964–4971. doi: 10.1074/jbc.M009251200. [DOI] [PubMed] [Google Scholar]
- 21.Verrecchia F, Rossert J, Mauviel A Blocking sp1 transcription factor broadly inhibits extracellular matrix gene expression in vitro and in vivo: implications for the treatment of tissue fibrosis. J Invest Dermatol. 2001;116(5):755–763. doi: 10.1046/j.1523-1747.2001.01326.x. [DOI] [PubMed] [Google Scholar]
- 22.Xu Q, Ji Y, Schmedtje JF, Jr Sp1 increases expression of cyclooxygenase-2 in hypoxic vascular endothelium. Implications for the mechanisms of aortic aneurysm and heart failure. J Biol Chem. 2000;275(32):24583–24589. doi: 10.1074/jbc.M003894200. [DOI] [PubMed] [Google Scholar]
- 23.Li R, Geng H, Xiao J, et al miR-7a/b attenuates post-myocardial infarction remodeling and protects H9c2 cardiomyoblast against hypoxia-induced apoptosis involving Sp1 and PARP-1. Sci Rep. 2016;6:29082. doi: 10.1038/srep29082. [DOI] [PMC free article] [PubMed] [Google Scholar]
- 24.Li M, Wu J, Hu G, et al Pathological matrix stiffness promotes cardiac fibroblast differentiation through the POU2F1 signaling pathway. Sci China Life Sci. 2020;64(2):242–254. doi: 10.1007/s11427-019-1747-y. [DOI] [PubMed] [Google Scholar]
- 25.Zhao C, Liu J, Ge W, et al Identification of Regulatory circRNAs Involved in the Pathogenesis of Acute Myocardial Infarction. Front Genet. 2021;11:626492. doi: 10.3389/fgene.2020.626492. [DOI] [PMC free article] [PubMed] [Google Scholar]
- 26.Pan Y, Chen Y, Ma D, et al miR-646 is a key negative regulator of EGFR pathway in lung cancer. Exp Lung Res. 2016;42(6):286–295. doi: 10.1080/01902148.2016.1207726. [DOI] [PubMed] [Google Scholar]
- 27.Liu L, Jin X, Hu C, et al Amphiregulin enhances cardiac fibrosis and aggravates cardiac dysfunction in mice with experimental myocardial infarction partly through activating EGFR-dependent pathway. Basic Res Cardiol. 2018;113(2):12. doi: 10.1007/s00395-018-0669-y. [DOI] [PubMed] [Google Scholar]
- 28.Zhang Y, Tian C, Liu X, et al Identification of Genetic Biomarkers for Diagnosis of Myocardial Infarction Compared with Angina Patients. Cardiovasc Ther. 2020;2020:8535314. doi: 10.1155/2020/8535314. [DOI] [PMC free article] [PubMed] [Google Scholar]
- 29.Liu Z, Pan H, Cao Y, et al Downregulated microRNA-330 suppresses left ventricular remodeling via the TGF-β1/Smad3 signaling pathway by targeting SRY in mice with myocardial ischemia-reperfusion injury . J Cell Physiol. 2019;234(7):11440–11450. doi: 10.1002/jcp.27800. [DOI] [PubMed] [Google Scholar]
- 30.Xu H, Li F miR-127 aggravates myocardial failure by promoting the TGF-β1/Smad3 signaling. Mol Med Rep. 2018;18(6):4839–4846. doi: 10.3892/mmr.2018.9514. [DOI] [PMC free article] [PubMed] [Google Scholar] [Retracted]
- 31.Karolina DS, Tavintharan S, Armugam A, et al Circulating miRNA profiles in patients with metabolic syndrome. J Clin Endocrinol Metab. 2012;97(12):E2271–E2276. doi: 10.1210/jc.2012-1996. [DOI] [PubMed] [Google Scholar]
- 32.Antonowski T, Osowski A, Lahuta L, et al Health-Promoting Properties of Selected Cyclitols for Metabolic Syndrome and Diabetes. Nutrients. 2019;11(10):2314. doi: 10.3390/nu11102314. [DOI] [PMC free article] [PubMed] [Google Scholar]
- 33.Jopling C, Sleep E, Raya M, et al Zebrafish heart regeneration occurs by cardiomyocyte dedifferentiation and proliferation. Nature. 2010;464(7288):606–609. doi: 10.1038/nature08899. [DOI] [PMC free article] [PubMed] [Google Scholar]
- 34.Plaisier CL, Pan M, Baliga NS A miRNA-regulatory network explains how dysregulated miRNAs perturb oncogenic processes across diverse cancers. Genome Res. 2012;22(11):2302–2314. doi: 10.1101/gr.133991.111. [DOI] [PMC free article] [PubMed] [Google Scholar]
- 35.Li M, Wu L Functional analysis of keratinocyte and fibroblast gene expression in skin and keloid scar tissue based on deviation analysis of dynamic capabilities. Exp Ther Med. 2016;12(6):3633–3641. doi: 10.3892/etm.2016.3817. [DOI] [PMC free article] [PubMed] [Google Scholar]
- 36.Zlochiver S, Muñoz V, Vikstrom KL, et al Electrotonic myofibroblast-to-myocyte coupling increases propensity to reentrant arrhythmias in two-dimensional cardiac monolayers. Biophys J. 2008;95(9):4469–4480. doi: 10.1529/biophysj.108.136473. [DOI] [PMC free article] [PubMed] [Google Scholar]
- 37.Qu X, Yan X, Kong C, et al c-Myb promotes growth and metastasis of colorectal cancer through c-fos-induced epithelial-mesenchymal transition. Cancer Sci. 2019;110(10):3183–3196. doi: 10.1111/cas.14141. [DOI] [PMC free article] [PubMed] [Google Scholar]
- 38.Isoyama S, Nitta-Komatsubara Y Acute and chronic adaptation to hemodynamic overload and ischemia in the aged heart. Heart Fail Rev. 2002;7(1):63–69. doi: 10.1023/A:1013701923065. [DOI] [PubMed] [Google Scholar]
- 39.Sugano M, Hata T, Tsuchida K, et al Local delivery of soluble TNF-alpha receptor 1 gene reduces infarct size following ischemia/reperfusion injury in rats. Mol Cell Biochem. 2004;266(1-2):127–132. doi: 10.1023/B:MCBI.0000049149.03964.c9. [DOI] [PubMed] [Google Scholar]
- 40.Tanno M, Gorog DA, Bellahcene M, et al Tumor necrosis factor-induced protection of the murine heart is independent of p38-MAPK activation. J Mol Cell Cardiol. 2003;35(12):1523–1527. doi: 10.1016/j.yjmcc.2003.09.019. [DOI] [PubMed] [Google Scholar]
- 41.Hsu CP, Zhai P, Yamamoto T, et al Silent information regulator 1 protects the heart from ischemia/reperfusion. Circulation. 2010;122(21):2170–2182. doi: 10.1161/CIRCULATIONAHA.110.958033. [DOI] [PMC free article] [PubMed] [Google Scholar]
- 42.Lu D, Liu J, Jiao J, et al Transcription factor Foxo3a prevents apoptosis by regulating calcium through the apoptosis repressor with caspase recruitment domain. J Biol Chem. 2013;288(12):8491–8504. doi: 10.1074/jbc.M112.442061. [DOI] [PMC free article] [PubMed] [Google Scholar]