

Abstract
Background
Neonatal jaundice may cause severe neurological damage if poorly evaluated and diagnosed when high bilirubin occurs. The study explored how to effectively integrate high-dimensional genetic features into predicting neonatal jaundice.
Methods
This study recruited 984 neonates from the Suzhou Municipal Central Hospital in China, and applied an ensemble learning approach to enhance the prediction of high-dimensional genetic features and clinical risk factors (CRF) for physiological neonatal jaundice of full-term newborns within 1-week after birth. Further, sigmoid recalibration was applied for validating the reliability of our methods.
Results
The maximum accuracy of prediction reached 79.5% Area Under Curve (AUC) by CRF and could be marginally improved by 3.5% by including genetic variant (GV). Feature importance illustrated that 36 GVs contributed 55.5% in predicting neonatal jaundice in terms of gain from splits. Further analysis revealed that the main contribution of GV was to reduce the false-positive rate, i.e., to increase the specificity in the prediction.
Conclusions
Our study shed light on the theoretical and practical value of GV in the prediction of neonatal jaundice.
Supplementary Information
The online version contains supplementary material available at 10.1186/s12911-021-01701-9.
Keywords: Hyperbilirubinemia, Machine learning, Genetic variants, Transcutaneous bilirubin
Introduction
Neonatal jaundice is present in approximately 60% of term and 80% of preterm newborns [1]. Although most jaundice is benign, unexpected high bilirubin may occur and even cause permanent neural damage in newborns, i.e., “chronic bilirubin encephalopathy” or kernicterus. During the first week of life, an increase in bilirubin production and a decrease in bilirubin elimination cause total serum bilirubin (TsB) to rise rapidly [2, 3]. Therefore, jaundice, which may be preventable, is the leading cause of readmission during that period [4]. Pediatricians and scientists have been working on the prediction method of neonatal hyperbilirubinemia for decades. Most studies predicted neonatal jaundice through logistic regression [3, 5–9]. Other new methodologies included machine learning techniques to improve diagnosis in neonatal jaundice [10, 11].
Other studies also showed the association between functional variants and neonatal jaundice or bilirubin levels [12–18]. For instance, Uridine Diphosphate Glucuronosyl Transferase 1A1 (UGT1A1) has been identified as the key enzyme for bilirubin conjugation, while unconjugated bilirubin is the main cause of hyperbilirubinemia. Heme Oxygenase-1 (HMOX1) is another key enzyme in the bilirubin metabolism pathway for heme degradation [19]. Variants of UGT1A1 and HMOX1 were extensively studied, including (TA)n repeats in promoter and rs4148323 (G211A, Gly71Arg) in exon 1 in UGT1A1, and (GT)n repeats in promoter in HMOX1. However, few studies effectively utilized high-dimensional genetic features for neonatal jaundice prediction. One plausible reason could be the high discretion of GV that leads to large deviations in prediction. The challenges become more serious as genes are high-dimensional. As traditional methods require transferring multi-dimensional nominal variables into binary variables (i.e., one-hot encoding), they lose partial information to deal with a mass of GV and thus are inefficient. However, the association studies may estimate the prevalence in the general gene but lack the effectiveness to predict individual jaundice through integrating gene and clinical data.
This study applied an ensemble learning approach in machine learning to enhance the predictability of high-dimensional genetic features and CRF for physiological neonatal jaundice of full-term newborns within 1-week after birth. Using a data set from a municipal hospital in China, clinical predictors alone, genetic predictors alone, and clinical plus genetic predictors were tested separately by various machine learning (ML) techniques. We sought to create an ensemble learning approach to predict neonatal hyperbilirubinemia development so that pediatricians and parents may have more robust reference information before making decisions. The workflow of this study was summarized in Fig. 1.
Fig. 1.

The methodological workflow of our study
Method
Study cohort
This study retrospectively enrolled 3743 infants born between February and October in 2008 at ≥ 37 weeks’ gestational age in Suzhou, China. Among them, 984 infants were randomly chosen from 3743 samples by matching gender, delivery mode and birth season for genotyping. Blood samples for genotyping were obtained from surplus filter papers, which were kept at 4 °C after routine newborn screening. Details of the genotyping procedure are in Additional file 1: Appendix 1. F-test showed there were no significant differences between the genotyped and un-genotyped samples in other major clinical characteristics, gestational age (F-value = 0.941, p = 0.238), and birth weight (F-value = 1.041, p = 0.455).
Eligible infants had no major abnormalities, except for neonatal jaundice without pathological causes, such as hemolytic disease of the newborn, glucose-6-phosphate dehydrogenase (G6PD) deficiency, and infection. Each neonate’s gender, birthday, delivery mode, gestational age at birth, birth weight, birth month, and feeding type were recorded. Transcutaneous bilirubin (TcB) was measured every morning on each neonate's forehead during birth hospitalization stay, resulting in a total of 4,048 records at the individual-day level (Table 1). Details of the measurement have been previously described [17]. According to Chinese guidelines in Practical Neonatology [20] and Practical Pediatrics [21], neonates were diagnosed as hyperbilirubinemia when their TcB exceeded 12.9 mg/dL (220.5 μmol/L) on day three or later days before they were discharged (namely CN220 in the study). Hyperbilirubinemic neonates would receive phototherapy. Bilirubin measurements within 24 h after phototherapy were excluded. Once the infants developed a high concentration of bilirubin before day three or the pathological cause of hyperbilirubinemia was diagnosed, such as hemolytic disease of the newborn, G6PD deficiency and infection, et al., infants would be transferred to the Neonatal Unit and excluded from our study. For internal missing measurements of TcB for a newborn, we imputed them with the average value of the previous and the next TcB levels.
Table 1.
Descriptive summary of daily TcB levels (μmol/L)
| Age (day) | Min | 25% | Mean | Mode | 75% | Max | Std | n | Ratio (%) |
|---|---|---|---|---|---|---|---|---|---|
| 1 | 0 | 0 | 1.2 | 0 | 2.1 | 3.9 | 1.2 | 128 | 13 |
| 2 | 0 | 44.5 | 65.2 | 54.7 | 85.5 | 186.4 | 30.7 | 941 | 95.6 |
| 3 | 0 | 102.6 | 128.1 | 119.7 | 153.9 | 270.2 | 37.4 | 973 | 98.9 |
| 4 | 20.5 | 141.9 | 168.3 | 205.2 | 194.9 | 307.8 | 42.7 | 964 | 98 |
| 5 | 0 | 157.7 | 181.7 | 205.2 | 206.9 | 302.7 | 44.6 | 730 | 74.2 |
| 6 | 0 | 145.4 | 172.8 | 205.2 | 205.2 | 290.7 | 48.6 | 297 | 30.2 |
| 7 | 0 | 141.9 | 166.7 | 196.6 | 201.8 | 256.5 | 54.1 | 105 | 10.7 |
Ratio denotes the fraction of samples
DNA was isolated from surplus filter paper blood spots with ethanol. A set of 9 variants of Uridine Diphosphate Glucuronosyl Transferase 1A1 (UGT1A1), 4 variants of Heme Oxygenase-1 (HMOX1), 6 variants of Biliverdin Reductases A (BLVRA) and 17 variants of Solute Carrier Organic Anion Transporter family member 1B1 (SLCO1B1) was selected for genotyping. They were either functional SNPs or tagging SNPs in the genes of the enzymes in the bilirubin metabolism pathway; we integrated them as GV36 in the main analysis as additional predictors given CRF. Details of the genotyping method have been previously described [17].
Predictors and outcome variables
Predictors included 6 CRF variants that were mostly mentioned in previous studies [10, 11], 4 HMOX1 variants, 9 UGT1A1 variants, 6 BLVRA variants, and 17 SLCO1B1 variants. Descriptive statistics of CRF and major genetic variants are shown in Additional file 1: Appendix 2 Table A1 and Table A2, respectively.
The outcome variables are binary indicators that take on one if a newborn is hyperbilirubinemia. For generalizability purposes, this study also referred to other guidelines besides CN220, including NICE and P95, to evaluate the gene’s predictive power. NICE guidance was published by the UK’s National Institute for Health and Clinical Excellence in 2010. It recommended thresholds to start phototherapy according to hour-specific bilirubin level [22]. We took the first risk level of NICE as a comparable guideline threshold, denoted as NICE_R1. P95 refers to bilirubin levels at or greater than the 95th percentile of the population on the corresponding age. 95% percentile is commonly designated as high-risk zones. Such an idea was first suggested in 1999 [23]. It became popular after the American Academy of Pediatrics (AAP) applied the P95 risk zone in its updated guideline in 2004 [24]. Except for CN220, the other two guidelines’ bilirubin thresholds are age-specific. Daily bilirubin levels are descriptively summarized in Table 1. Table 2 summarizes the thresholds of bilirubin levels under different guidelines with the number of samples that exceed the thresholds.
Table 2.
Thresholds to start phototherapy and the number of neonates exceeds the threshold (n +) according to different guidelines
| Age (day) | CN220 | NICE | P95 | Sample size | |||
|---|---|---|---|---|---|---|---|
| Thresholds | n+ | Thresholds | n+ | Thresholds | n+ | ||
| 2 | 220 | 0 | 100 | 110 | 119.7 | 52 | 943 |
| 3 | 220 | 4 | 150 | 282 | 186.4 | 50 | 979 |
| 4 | 220 | 65 | 200 | 212 | 239.4 | 51 | 969 |
| 5 | 220 | 107 | 200 | 289 | 256.5 | 45 | 747 |
| 6 | 220 | 35 | 200 | 105 | 248.6 | 16 | 305 |
| 7 | 220 | 10 | 200 | 30 | 186.4 | 6 | 105 |
The best method is marked in bold with respect to each metric
Ensemble learning
In machine learning, ensemble learning refers to the methods that use multiple learning algorithms to obtain better predictive performance than could be obtained from any of the single learning algorithms alone [25]. The ensemble learning framework was built on the gradient boosting decision tree (GBDT) that has a wide range of commercial and academic applications [26, 27]. To be specific, gradient boosting (GB) framework constructs additive regression models by sequentially fitting a weak classifier to current residuals [28, 29], as shown in Fig. 2. Thus, newly trained weak classifiers will correct the previous weak classifiers’ misjudgment, adaptively improving the prediction performance with high efficiency [30]. The final model aggregates the results from all weak classifiers to achieve a “strong” classifier as an ensemble. And GBDT is exactly the GB that utilizes decision trees as the weak classifiers, with a loss function to detect the residuals, such as mean squared error for regression or logarithmic loss for classification. By using 71 data sets originating from different domains and publicly available at UCI and KEEL repositories, GBDT exceeds or matches the prediction performance of other 10 popular algorithms for classification, including support vector machines, deep neural network, feedforward neural network, random forests, naïve Bayes, logistic regression and so on, and achieve the best accuracy ranking overall [31].
Fig. 2.

The architecture of Gradient Boosting Decision Tree
In the study, we implemented GBDT based on Lightgbm, a gradient boosting framework originally developed by Microsoft, which has shown its power in reducing the prediction bias in biology and computer science in recent years [32, 33]. To solve the high-dimensionality problem, we implemented lightgbm with L1 regularization [34], bagging [35] on samples (bootstrapping), and bagging on features.
To benchmark the model's prediction accuracy, we applied logistic regression (with L2 regularization), random forest, classification and regression tree (CART), and naïve Bayes method. All machine learning algorithms were implemented in Python, and the code is available in online resources.
Evaluation
Following related frontier studies, this study used AUC on the test set as the metric of prediction. We took cross validation (CV) [36] with 30% samples as validation sets. As the incidence of neonatal hyperbilirubinemia is about 5% in practice, resulting in an unbalance problem that positive sample rates might be sensitive to sampling seed. Therefore, we controlled the positive sample ratio in each (train, validation) couple to be the same during sampling. The external validation was independently repeated 100 times for eliminating sampling bias in evaluating model performance. No hyperparameter tuning was applied based on the external cross-validation. For ensemble methods, i.e., lightgbm and random forests, internal bootstrapping (bagging) was applied for hyperparameter tuning and dealing with overfitting.
There is increasing attention to the calibration analysis to verify the reliability of risk prediction models to support medical decision-making [37]. A common definition of calibration is “having an event rate of R% among patients with a predicted risk of R%”. To verify the reliability of models, we calculated brier scores and plot calibration curves. Brier score is the estimated calibration index that builds on a flexible calibration analysis by computing the average squared difference between predicted risk and observed risk and transforming to obtain a value between 0 and 1 [38]. The lower the Brier score, the more reliable the prediction.
Results
Discrimination analysis
Across all neonatal jaundice guidelines, our ensemble learning method (lightgbm) achieved a high level of accuracy in terms of AUC based on clinical risk factors and genetic variants (CN220: see Table 3, other guidelines: see Additional file 1: Appendix 2 Table A3) superior to other non-ensemble methods. Performance metrics including accuracy, recall, and specificity were also evaluated in Additional file 1: Appendix 2 Table A4. Results indicated that lightgbm generally outperformed other machine learning algorithms in term of prediction. For the guideline implemented in our study, i.e., CN220, lightgbm classified the newborns with average AUC 0.792 (95% CI 0.757–0.828) based on only clinical risk factors. With the integration of 36 genetic variants (GV36), the accuracy retained a stronger performance level, i.e., AUC 0.82 (95% CI 0.785–0.857). To illustrate, GV36 contributed marginally AUC 0.028, about 3%, showing the effectiveness of lightgbm in utilizing high-dimensional genetic information into neonatal jaundice prediction. The marginal contribution of GV36 was consistent across guidelines and respectively achieved 0.036 for NICE_R1, 0.029 for P95.
Table 3.
Discrimination results of predicting neonatal jaundice with CRF and GV under CN220 guideline
| Variables | Method | AUC | F1-score | Precision |
|---|---|---|---|---|
| CRF | Lightgbm | 0.792 (0.757–0.828) | 0.213 (0.171–0.251) | 0.136 (0.109–0.161) |
| Cart | 0.553 (0.509–0.592) | 0.150 (0.074–0.211) | 0.137 (0.074–0.191) | |
| Logistic | 0.785 (0.753–0.821) | 0.210 (0.178–0.240) | 0.122 (0.103–0.141) | |
| Naive Bayes | 0.735 (0.673–0.782) | 0.165 (0.129–0.188) | 0.091 (0.069–0.104) | |
| rf | 0.766 (0.711–0.806) | 0.206 (0.177–0.245) | 0.123 (0.106–0.147) | |
| GV36 | Lightgbm | 0.603 (0.546–0.662) | 0.149 (0.105–0.189) | 0.105 (0.074–0.131) |
| Cart | 0.558 (0.522–0.598) | 0.149 (0.105–0.191) | 0.110 (0.079–0.139) | |
| Logistic | 0.569 (0.519–0.614) | 0.118 (0.093–0.141) | 0.068 (0.053–0.081) | |
| Naive bays | 0.562 (0.509–0.622) | 0.112 (0.106–0.116) | 0.059 (0.057–0.062) | |
| rf | 0.587 (0.522–0.652) | 0.148 (0.104–0.197) | 0.103 (0.074–0.136) | |
| CRF_GV36 | Lightgbm | 0.820 (0.785–0.857) | 0.277 (0.218–0.333) | 0.204 (0.160–0.247) |
| Cart | 0.569 (0.517–0.621) | 0.184 (0.103–0.269) | 0.175 (0.095–0.250) | |
| Logistic | 0.781 (0.730–0.816) | 0.218 (0.185–0.251) | 0.129 (0.110–0.150) | |
| Naive Bayes | 0.642 (0.563–0.707) | 0.114 (0.105–0.124) | 0.061 (0.056–0.067) | |
| rf | 0.792 (0.753–0.833) | 0.228 (0.193–0.259) | 0.139 (0.118–0.158) |
The best performance by algorithms with CRF, GV36 and CRF_GV36 variables are marked in bold
95% CI is shown in parentheses
In addition to the strong performance of lightgbm, another ensemble learning method, random forest (RF), performed comparably well. Notably, RF even surpassed lightgbm in NICE_R1 and P95 if only predicting with GV36. Although RF didn’t achieve as well as lightgbm after additionally including genetic information, it also indicated that the marginal contribution of GV was consistent across guidelines, i.e., 0.026 for CN200, 0.036 for NICE_R1, and 0.029 for P95, which further validated the effectiveness of ensemble learning in integrating genetic variants into predicting neonatal jaundice.
While both ensemble tree algorithms (Lightgbm and RF) achieved high accuracy and effectively enhanced the prediction by integrating clinical risk factors and genetic information, a single tree (CART) failed to precisely predict neonatal jaundice. For example, CART achieves AUC 0.569 (95% CI 0.517–0.621) in CN220 guideline with CRF, far from that of lightgbm, i.e. 0.82 (95% CI 0.785–0.857). It indicated that the ensemble of weak classifiers could achieve outstanding performance in predicting neonatal jaundice.
Although traditional methods, logistics, and naïve Bayes achieved comparable accuracy with clinical risk factors, they could not benefit from genetic information and might even worsen. For instance, under CN220, logistic regression achieved 0.785 (95% CI 0.753–0.821) AUC, which decreased to 0.781 (95% CI 0.73–0.816) AUC after additionally including GV36 as explaining variables. We have implemented L2-regularization into the logistic regression as a common method to deal with overfitting and high-dimensionality.
To gain insight into how the prediction system utilizes clinical risk factors and genetic information, we identified key clinical features and genetic variants driving the ensemble learning. Figure 3 showed the feature importance of our ensemble method (lightgbm) measured by gain from splits under the representative guideline: CN220. The overall feature importance of CRF covered 44.5%, while GV contributed 55.5% in predicting neonatal jaundice in terms of gain.
Fig. 3.
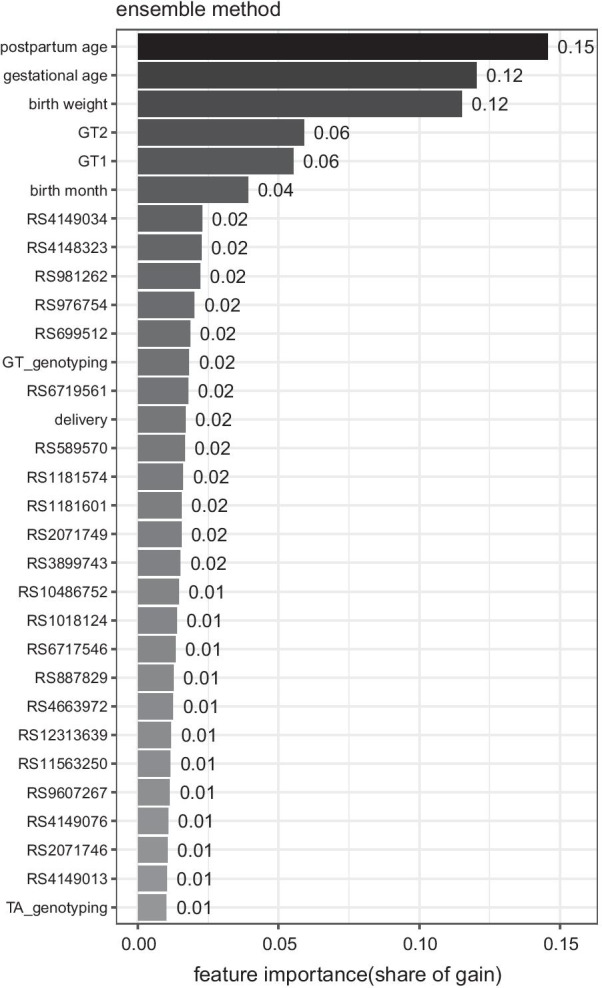
Relative feature importance from ensemble nethod in predicting neonatal jaundice under CN220 guideline
Calibration analysis
Following previous studies [37, 39, 40], we investigated our method's calibration performance (lightgbm) based on calibration curves and brier score. Calibration curves (Fig. 4) showed the observed proportion of events associated with our model’s predicted risk [41], under CN220 and NICE_R1 guidelines. The red lines referred to the linearly fitted line of original calibration curves of lightgbm with 95% CI. Since the red lines deviated from the diagonal significantly, the model suffered from overfitting. Specifically, our method before recalibration tended to overestimate high risks and underestimate low risk for both guidelines.
Fig. 4.

Calibration curves on external validation sets
To improve the reliability of our method, we implemented the sigmoid recalibration [42]. In particular, an additional sigmoid function was trained to map the Lightgbm outputs into recalibrated predictions based on 10-folder internal cross-validation on train sets. Recalibrated curves (green lines in Fig. 4) were significantly amended towards the diagonal lines, illustrating our method's moderate calibration level in predicting neonatal jaundice.
Further, brier scores gave quantitative measurements of calibration performance (Table 4). It indicated that sigmoid recalibration improved the calibration performance in terms of brier scores and enhanced the discrimination performance in terms of AUC. For instance, under CN220 guideline, lightgbm obtained an average brier score 0.053 (95% CI 0.05–0.057) and an average AUC 0.82 (95% CI 0.785–0.857) with CRF and genetic variants. After recalibration, the corresponding brier score was improved to 0.049 (95% CI 0.048–0.051), while the recalibrated AUC was 0.83 (95% CI 0.802–0.862). Meanwhile, GV’s additional contribution was enhanced to 0.035 for CN220, 0.038 for NICE_R1, 0.034 for P95. After recalibration, the average event rates were matched with the average prediction risks, which were not before recalibration. Therefore, recalibration could further enhance our method’s reliability in individual-level implementation.
Table 4.
Calibration results of predicting neonatal jaundice with CRF and GV. 95%
| Recali-brated | Guideline | Variables | AUC | Brier | Event rate | Average risk |
|---|---|---|---|---|---|---|
| No | CN220 | CRF | 0.792 (0.757–0.828) | 0.054 (0.05–0.058) | 0.055 | 0.047 |
| CRF_GV36 | 0.82 (0.785–0.857) | 0.053 (0.05–0.057) | 0.055 | 0.038 | ||
| NICE_R1 | CRF | 0.72 (0.695–0.744) | 0.172 (0.164–0.179) | 0.254 | 0.250 | |
| CRF_GV36 | 0.756 (0.736–0.78) | 0.165 (0.155–0.175) | 0.254 | 0.244 | ||
| P95 | CRF | 0.68 (0.623–0.737) | 0.053 (0.05–0.056) | 0.054 | 0.048 | |
| CRF_GV36 | 0.709 (0.657–0.773) | 0.054 (0.049–0.06) | 0.054 | 0.043 | ||
| Yes | CN220 | CRF | 0.795 (0.761–0.83) | 0.051 (0.049–0.052) | 0.055 | 0.055 |
| CRF_GV36 | 0.83 (0.802–0.862) | 0.049 (0.048–0.051) | 0.055 | 0.055 | ||
| NICE_R1 | CRF | 0.724 (0.702–0.752) | 0.168 (0.163–0.173) | 0.254 | 0.254 | |
| CRF_GV36 | 0.762 (0.739–0.787) | 0.158 (0.152–0.164) | 0.254 | 0.255 | ||
| P95 | CRF | 0.683 (0.622–0.733) | 0.05 (0.049–0.052) | 0.054 | 0.055 | |
| CRF_GV36 | 0.717 (0.669–0.772) | 0.049 (0.047–0.05) | 0.054 | 0.055 |
95% CI is shown in parentheses
Robustness checks
We experimented with the prediction by using a different combination of GV, as shown in Table 5. We chose 4 GV out of 36 according to the popularity and feature importance, denoted as GV4. In addition to (TA)n repeat, rs4148323 (G211A, Gly71Arg) and (GT)n repeat, rs887829 (c-364t) in UGT1A1 were shown to be associated with adults’ bilirubin level [43]. Additionally, we chose 7 GVs that were tagging SNPs located within 5 kb upstream and 2 kb downstream of each gene, selected from the HapMap Han Chinese population based on r2 > 0.8 and a minor allele frequency of > 0.1. The 7 GVs were integrated into GV4 to obtain GV11. In this way, we can compare the change of prediction accuracy with 4, 11, and 36 GV.
Table 5.
Prediction performance of recalibrated lightgbm under CN220 guideline with different combinations of GV
| Variables | AUC | F1-score | Precision | Specific GV |
|---|---|---|---|---|
| CRF | 0.795 (0.761–830) | 0.217 (0.171–0.261) | 0.143 (0.113–0.171) | None |
| CRF + GV4 | 0.807 (0.779–841) | 0.242 (0.195–0.286) | 0.165 (0.132–0.194) |
HMOX1 (1) rs2071749 UGT1A1 (3): rs4148323, rs6717546, rs6719561 |
| CRF + GV11 | 0.813 (0.781–0.847) | 0.251 (0.198–0.298) | 0.176 (0.141–0.207) |
HMOX1 (3) (GT)n, rs9607267, rs2071749 UGT1A1 (8) rs887829, (TA)n, rs4148323, rs1018124, rs6717546, rs11563250, rs6719561, rs4663972 |
| CRF + GV36 | 0.830 (0.802–0.826) | 0.285 (0.229–0.333) | 0.217 (0.173–0.252) |
HMOX1 (4) rs2071746, (GT)n, rs9607267, rs2071749 UGT1A1 (9) rs4399719, rs887829, (TA)n, rs4148323, rs1018124, rs6717546, rs11563250, rs6719561, rs4663972 BLVRA (6) rs1181601, rs1181574, rs10486752, rs699512, rs17246016, rs589570 SLCO1B1 (17) rs4149013, rs10743408, rs3899743, rs981262, rs7138177, rs4149026, rs976754, rs4149034, rs12313639, rs2306283, rs4149044, rs4149056, rs4149057, rs4363657, rs4149076, rs12578392, rs4149085 |
95% CI is shown in parentheses
Results of recalibrated lightgbm under CN220 guideline with different combinations of GV (Table 5 and Fig. 5) showed that the additional improvement by using 4, 11, 36 GV were respectively 0.011, 0.016, and 0.029 AUC with the ensemble method. It indicated that a small subset of GV (GV4) could achieve about 1/3 additional predictive power of GV36, and the marginal contribution of GV11 covers about a half of that of GV36, which facilitated the clinical application of GV by lowering requirements of gene quantity for saving costs. The 0.035 additional enhanced prediction power by GV36 also suggested a mass of reserve force of gene for predicting neonatal jaundice and waiting for being discovered in the future.
Fig. 5.

ROC curve of neonatal jaundice prediction with CRF and GV by ensemble learning
Extended analysis
To gain a deeper understanding of gene variables' contribution to predicting neonatal jaundice, we mapped the ROC curve of the model with GV and CRF as independent variables, as shown in Fig. 6. It showed that when using CRF alone, true positive rate (TPR, i.e., sensitivity) reached 1 when the False positive rate (FPR, i.e., 1-Specificity) is about 0.5, indicating that the CRF is more conducive to improving the TPR; when incorporating GV to CRF, the ROC curve is further extended to the left, indicating that the main contribution of GV is to reduce the FPR and increase the specificity. Therefore, it is plausible to argue that GV's clinical contribution on increasing the prediction accuracy of physiological neonatal jaundice is mainly to avoid misdiagnosis due to false positives.
Fig. 6.
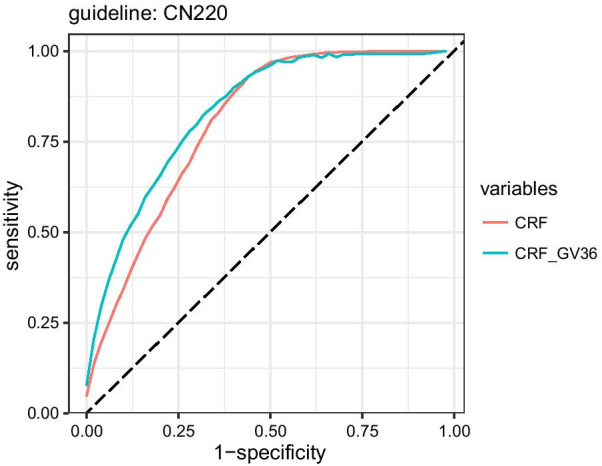
Comparison of ROC curve of neonatal jaundice prediction after introducing genetic variants (GV36)
Discussions
The contribution of this study is the incorporation of high-dimensional GV for predicting neonatal jaundice effectively. We showed that integrating GV with CRF can further improve the discrimination performance by 3.5% (CN220) AUC and 3.8% (NICE) AUC than using CRF alone. Further, we deduced GV's relative importance and explanatory power, which provides quantitative support for further experimental validation of gene variants' mechanism in neonatal jaundice. Our study's potential clinical application is to estimate the probability of neonatal jaundice within one week after birth.
Our results show that our method can effectively improve the upper limit of CRF’s prediction by integrating it with gene features, thus opening up a new way for the clinical diagnosis of neonatal jaundice with GV. The study further reveals that although more gene information can better help clinical diagnosis, the GV contributes differently to the prediction. In this way, only a small amount of genetic information is needed in practice to predict neonatal jaundice effectively.
Different from the early bilirubin level, the genetic features have been determined since the embryo period. Consequently, the study obtains a clinical application advantage compared with existing literature that uses early bilirubin level into prediction: the model predicts the risk of neonatal jaundice for discharged newborns before any bilirubin level measurement coming out. Furthermore, its prediction power does not rely on repeated bilirubin level measurement, making the prediction more convenient and efficient than previous ones.
For newborns within one week, bilirubin measurements are repeated several times. Lightgbm and random forests are based on decision tree algorithm, which does not assume a functional relationship between the outcome and features. Thus, our method is flexible towards the assumption of Independent and Identically Distributed (IID) in predicting neonatal jaundice.
The study is not free from limitations. First, all bilirubin levels are measured within one week after birth. Thus, the scope of the clinical application might be limited. Second, although TcB is a good index for a non-invasive auxiliary diagnostic system and TcB correlates well with TsB, the correlation might not be stable at high-level bilirubin concentrations [44], the findings in the study may not apply to TsB prediction directly. Future research can consider TsB as a prediction target by using GV and CRF features together.
Conclusion
In summary, this paper applied an ensemble learning method (lightgbm) to integrating 36 GVs into predicting neonatal jaundice, measured by TcB. Results demonstrated that our method effectively solved the technical difficulties on GV’s high dimensionality. Quantitatively, GV contributes an additional 3.5% AUC based on prediction with CRF after sigmoid recalibration. Although the best predictors were CRF, GV was exactly complementary no matter which guideline to take. The study sheds light on the clinical importance and effective approach of how to facilitate predicting neonatal jaundice with high-dimensional GV. With the popularization of medical big data and the improvement of gene sequencing technology, the risk assessment and research of neonatal diseases with the gene will be fully developed.
Supplementary Information
Additional file 1. The file containing Appendix 1: Genotyping Method, and Appendix 2: supplementary tables including Table A1 to A4.
Acknowledgements
Not applicable.
Abbreviations
- CRF
Clinical risk factors
- GV
Genetic variants
- GBDT
Gradient boosting decision tree
- RF
Random forests
- AUC
Area Under the Curve
- NICE
The guidance published by the UK’s National Institute for Health and Clinical Excellence
- P95
The guidance with the threshold 95% percentile
- CN220
The Chinese guidance with the threshold 220.5 μmol/L
- TcB
Transcutaneous bilirubin
Authors' contributions
HD and CZ conceptualized and designed the study, drafted the initial manuscript, and revised the manuscript. YZ designed the data collection instruments, collected data, and reviewed and revised the manuscript. LW designed the study, and drafted the initial manuscript, and revised the manuscript. All authors read and approved the final manuscript.
Funding
This research received financial supports from the National Natural Science Foundation of China (81501294, 91846302). The study sponsors had no role in the study design; in the data collection, analysis, or interpretation; in the writing of the paper; or in the decision to submit the paper for publication. Each author listed on the manuscript has seen and approved the submission of this version of the manuscript and takes full responsibility for the manuscript.
Availability of data and materials
The datasets used and/or analyzed during the current study are available from the corresponding author on reasonable request.
Declarations
Ethics approval and consent to participate
The study was approved by both Suzhou Municipal Hospital Reproductive Medicine Ethics Committee and the Ethics Committee of Institutes of Biomedical Sciences. Since the data were analyzed anonymously, the filter paper was obtained from a standard screening procedure, and the TcB measurement was a completely noninvasive routine clinical assessment, both committees approved a waiver of publication consent.
Consent for publication
Not applicable.
Competing interests
The authors declare that they have no competing interests.
Footnotes
Publisher's Note
Springer Nature remains neutral with regard to jurisdictional claims in published maps and institutional affiliations.
Haowen Deng and Youyou Zhou equally contributed to this work
References
- 1.Rennie J, Burman-Roy S, Murphy S. Neonatal jaundice: summary of NICE guidance. BMJ Br Med J. 2010;340:c23409. doi: 10.1136/bmj.c2409. [DOI] [PubMed] [Google Scholar]
- 2.Bhutani VK, Johnson-Hamerman L. The clinical syndrome of bilirubin-induced neurologic dysfunction. Semin Fetal Neonat Med. 2015;20(1):6–13. doi: 10.1016/j.siny.2014.12.008. [DOI] [PubMed] [Google Scholar]
- 3.Bhutani VK, Stark AR, Lazzeroni LC, Poland R, Gourley GR, Kazmierczak S, Meloy L, Burgos AE, Hall JY, Stevenson DK, et al. Predischarge screening for severe neonatal hyperbilirubinemia identifies infants who need phototherapy. J Pediatr. 2013;162(3):477–482.e1. doi: 10.1016/j.jpeds.2012.08.022. [DOI] [PubMed] [Google Scholar]
- 4.Young PC, Korgenski K, Buchi KF. Early readmission of newborns in a large health care system. Pediatrics. 2013;131(5):E1538–E1544. doi: 10.1542/peds.2012-2634. [DOI] [PubMed] [Google Scholar]
- 5.Awasthi S, Rehman H. Early prediction of neonatal hyperbilirubinemia. Indian J Pediatr. 1998;65(1):131–139. doi: 10.1007/BF02849704. [DOI] [PubMed] [Google Scholar]
- 6.Agarwal R, Kaushal M, Aggarwal R, Paul VK, Deorari AK. Prediction of early neonatal hyperbilirubinemia using first day total serum bilirubin level in healthy term and near-term newborns. Pediatr Res. 2002;51(4):340a–341a. [PubMed] [Google Scholar]
- 7.Sarici SU, Yurdakok M, Serdar MA, Oran O, Erdem G, Tekinalp G, Yigit S. An early (sixth-hour) serum bilirubin measurement is useful in predicting the development of significant hyperbilirubinemia and severe ABO hemolytic disease in a selective high-risk population of newborns with ABO incompatibility. Pediatrics. 2002;109(4):e53. doi: 10.1542/peds.109.4.e53. [DOI] [PubMed] [Google Scholar]
- 8.Carbonell X, Botet F, Figueras J, Riu-Godo A. Prediction of hyperbilirubinaemia in the healthy term newborn. Acta Paediatr. 2001;90(2):166–170. doi: 10.1111/j.1651-2227.2001.tb00279.x. [DOI] [PubMed] [Google Scholar]
- 9.Varvarigou A, Fouzas S, Skylogianni E, Mantagou L, Bougioukou D, Mantagos S. Transcutaneous bilirubin nomogram for prediction of significant neonatal hyperbilirubinemia. Pediatrics. 2009;124(4):1052–1059. doi: 10.1542/peds.2008-2322. [DOI] [PubMed] [Google Scholar]
- 10.Ferreira D, Oliveira A, Freitas A. Applying data mining techniques to improve diagnosis in neonatal jaundice. Bmc Med Inform Decis. 2012;12:1–6. doi: 10.1186/1472-6947-12-143. [DOI] [PMC free article] [PubMed] [Google Scholar]
- 11.Daunhawer I, Kasser S, Koch G, Sieber L, Cakal H, Tutsch J, Pfister M, Wellmann S, Vogt JE. Enhanced early prediction of clinically relevant neonatal hyperbilirubinemia with machine learning. Pediatr Res. 2019;86(1):122–127. doi: 10.1038/s41390-019-0384-x. [DOI] [PubMed] [Google Scholar]
- 12.Aono S, Adachi Y, Uyama E, Yamada Y, Keino H, Nanno T, Koiwai O, Sato H. Analysis of genes for bilirubin UDP-glucuronosyltransferase in gilberts-syndrome. Lancet. 1995;345(8955):958–959. doi: 10.1016/S0140-6736(95)90702-5. [DOI] [PubMed] [Google Scholar]
- 13.Bosma PJ, Chowdhury JR, Bakker C, Gantla S, Deboer A, Oostra BA, Lindhout D, Tytgat GNJ, Jansen PLM, Elferink RPJO, et al. The genetic-basis of the reduced expression of bilirubin UDP-glucuronosyltransferase-1 in Gilberts-syndrome. N Engl J Med. 1995;333(18):1171–1175. doi: 10.1056/NEJM199511023331802. [DOI] [PubMed] [Google Scholar]
- 14.Yamada N. Microsatellite polymorphism in the heme oxygenase-1 gene promoter is associated with susceptibility to emphysema (vol. 66, pg. 187, 2000) Am J Hum Genet. 2001;68(6):1542–1542. doi: 10.1086/320611. [DOI] [PMC free article] [PubMed] [Google Scholar]
- 15.Watchko JF, Lin ZL. Exploring the genetic architecture of neonatal hyperbilirubinemia. Semin Fetal Neonat Med. 2010;15(3):169–175. doi: 10.1016/j.siny.2009.11.003. [DOI] [PubMed] [Google Scholar]
- 16.Bozkaya OG, Kumral A, Yesilirmak DC, Ulgenalp A, Duman N, Ercal D, Ozkan H. Prolonged unconjugated hyperbilirubinaemia associated with the haem oxygenase-1 gene promoter polymorphism. Acta Paediatr. 2010;99(5):679–683. doi: 10.1111/j.1651-2227.2009.01678.x. [DOI] [PubMed] [Google Scholar]
- 17.Zhou YY, Wang SN, Li H, Zha WF, Peng QQ, Li SL, Chen Y, Jin L. Quantitative trait analysis of polymorphisms in two bilirubin metabolism enzymes to physiologic bilirubin levels in Chinese newborns. J Pediatr. 2014;165(6):1154–1160.e1. doi: 10.1016/j.jpeds.2014.08.041. [DOI] [PubMed] [Google Scholar]
- 18.Seidman DS, Ergaz Z, Paz I, Laor A, Revel-Vilk S, Stevenson DK, Gale R. Predicting the risk of jaundice in full-term healthy newborns: a prospective population-based study. J Perinatol. 1999;19(8 Pt 1):564–567. doi: 10.1038/sj.jp.7200274. [DOI] [PubMed] [Google Scholar]
- 19.Dennery PA, Seidman DS, Stevenson DK. Drug therapy: neonatal hyperbilirubinemia. N Engl J Med. 2001;344(8):581–590. doi: 10.1056/NEJM200102223440807. [DOI] [PubMed] [Google Scholar]
- 20.Jin H. HDGX: practical neonatology. 2. Beijing: People's Medical Publishing House; 1997. [Google Scholar]
- 21.Hu Y. WRJZ: practical pediatrics. 6. Beijing: People's Medical Publishing House; 1996. [Google Scholar]
- 22.Jaundice in newborn babies under 28 days. http://guidance.nice.org.uk/CG98.
- 23.Bhutani VK, Johnson L, Sivieri EM. Predictive ability of a predischarge hour-specific serum bilirubin for subsequent significant hyperbilirubinemia in healthy term and near-term newborns. Pediatrics. 1999;103(1):6–14. doi: 10.1542/peds.103.1.6. [DOI] [PubMed] [Google Scholar]
- 24.Maisels MJ, Baltz RD, Bhutani VK, Newman TB, Palmer H, Rosenfeld W, Stevenson DK, Weinblatt HB, Hyperbilirubinemia S. Management of hyperbilirubinemia in the newborn infant 35 or more weeks of gestation. Pediatrics. 2004;114(1):297–316. doi: 10.1542/peds.114.1.297. [DOI] [PubMed] [Google Scholar]
- 25.Zhang C, Ma Y. Ensemble machine learning: methods and applications. Springer; 2012. [Google Scholar]
- 26.Son J, Jung I, Park K, Han B. Tracking-by-segmentation with online gradient boosting decision tree. In: Ieee I Conf Comp Vis; 2015. p. 3056–64.
- 27.Tian D, He GH, Wu JX, Chen HT, Jiang Y. An accurate eye pupil localization approach based on adaptive gradient boosting decision tree. In: 2016 30th Anniversary of Visual Communication and Image Processing (Vcip) 2016.
- 28.Friedman JH. Greedy function approximation: a gradient boosting machine. Ann Stat. 2001;29:1189–1232. doi: 10.1214/aos/1013203451. [DOI] [Google Scholar]
- 29.Friedman JH. Stochastic gradient boosting. Comput Stat Data Anal. 2002;38(4):367–378. doi: 10.1016/S0167-9473(01)00065-2. [DOI] [Google Scholar]
- 30.Si S, Zhang H, Keerthi SS, Mahajan D, Dhillon IS, Hsieh C-J. Gradient boosted decision trees for high dimensional sparse output. In: Doina P, Yee Whye T, editors. Proceedings of the 34th international conference on machine learning, vol. 70. Proceedings of Machine Learning Research: PMLR; 2017. p. 3182–90.
- 31.Zhang CS, Liu CC, Zhang XL, Almpanidis G. An up-to-date comparison of state-of-the-art classification algorithms. Expert Syst Appl. 2017;82:128–150. doi: 10.1016/j.eswa.2017.04.003. [DOI] [Google Scholar]
- 32.Wang D, Zhang Y, Zhao Y. LightGBM: an effective miRNA classification method in breast cancer patients. In: Proceedings of the 2017 international conference on computational biology and bioinformatics. Newark: Association for Computing Machinery; 2017. p. 7–11.
- 33.Liang YX, Wu JY, Wang W, Cao YJ, Zhong BL, Chen ZK, Li ZZ. Product marketing prediction based on XGboost and LightGBM algorithm. In: 2019 2nd international conference on Artificial Intelligence and Pattern Recognition (Aipr 2019); 2019. p. 150–3.
- 34.Tibshirani R. Regression shrinkage and selection via the lasso. J R Stat Soc Ser B (Methodol) 1996;58(1):267–288. [Google Scholar]
- 35.Breiman L. Bagging predictors. Mach Learn. 1996;24(2):123–140. [Google Scholar]
- 36.Rao CR, Wu Y. Linear model selection by cross-validation. J Stat Plan Infer. 2005;128(1):231–240. doi: 10.1016/j.jspi.2003.10.004. [DOI] [Google Scholar]
- 37.Van Calster B, Nieboer D, Vergouwe Y, De Cock B, Pencina MJ, Steyerberg EW. A calibration hierarchy for risk models was defined: from utopia to empirical data. J Clin Epidemiol. 2016;74:167–176. doi: 10.1016/j.jclinepi.2015.12.005. [DOI] [PubMed] [Google Scholar]
- 38.Harrell FE., Jr . Regression modeling strategies: with applications to linear models, logistic and ordinal regression, and survival analysis. Springer; 2015. [Google Scholar]
- 39.Steyerberg EW. Clinical prediction models. Springer; 2019. [Google Scholar]
- 40.Alba AC, Agoritsas T, Walsh M, Hanna S, Iorio A, Devereaux P, McGinn T, Guyatt G. Discrimination and calibration of clinical prediction models: users’ guides to the medical literature. JAMA. 2017;318(14):1377–1384. doi: 10.1001/jama.2017.12126. [DOI] [PubMed] [Google Scholar]
- 41.Niculescu-Mizil A, Caruana R. Predicting good probabilities with supervised learning. In: Proceedings of the 22nd international conference on Machine learning: 2005; 2005. p. 625–632.
- 42.Platt J. Probabilistic outputs for support vector machines and comparisons to regularized likelihood methods. Adv Large Margin Classif. 1999;10(3):61–74. [Google Scholar]
- 43.Lin R, Wang Y, Wang Y, Fu WQ, Zhang DD, Zheng HX, Yu T, Wang Y, Shen M, Lei R, et al. Common variants of four bilirubin metabolism genes and their association with serum bilirubin and coronary artery disease in Chinese Han population. Pharmacogenet Genom. 2009;19(4):310–318. doi: 10.1097/FPC.0b013e328328f818. [DOI] [PubMed] [Google Scholar]
- 44.Grohmann K, Roser M, Rolinski B, Kadow I, Muller C, Goerlach-Graw A, Nauck M, Kuster H. Bilirubin measurement for neonates: comparison of 9 frequently used methods. Pediatrics. 2006;117(4):1174–1183. doi: 10.1542/peds.2005-0590. [DOI] [PubMed] [Google Scholar]
Associated Data
This section collects any data citations, data availability statements, or supplementary materials included in this article.
Supplementary Materials
Additional file 1. The file containing Appendix 1: Genotyping Method, and Appendix 2: supplementary tables including Table A1 to A4.
Data Availability Statement
The datasets used and/or analyzed during the current study are available from the corresponding author on reasonable request.