

Abstract
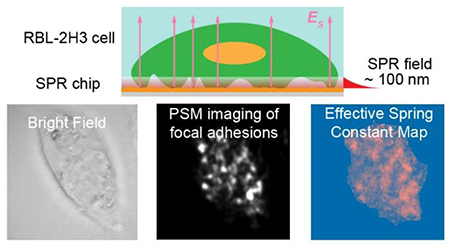
Cell adhesion plays a critical role in cell communications, cell migration, cell proliferation, and the integration of medical implants with tissues. Focal adhesions physically link the cell cytoskeleton to the extracellular matrix, but it remains challenging to image single focal adhesions directly. Here we show that plasmonic scattering microscopy (PSM) can directly image the single focal adhesions in a label-free, real-time, and non-invasive manner with sub-micrometer spatial resolution. PSM is developed based on surface plasmon resonance (SPR) microscopy, and the evanescent illumination makes it immune to the interference of intracellular structures. Unlike the conventional SPR microscopy, PSM can provide high signal-to-noise ratio and sub-micrometer spatial resolution for imaging the analytes with size down to a single molecule level, thus allowing both the super-resolution lateral localization for measuring nanoscale displacement and precise tracking of vertical distances between analyte centroid and sensor surface for analysis of free energy profiles. PSM imaging of RBL-2H3 cell with temporal resolution down to microseconds shows that the focal adhesions have random diffusion behaviors in addition to their directional movements during the antibody mediated activation process. The free energy mapping also shows a similar movement tendency, indicating that cell may change its morphology by varying the binding conditions of adhesive structures. PSM provides insights into the individual focal adhesion activities and can also serve as a promising tool for investigating the cell/surface interactions, such as cell capture and detection, and tissue adhesive material screening.
Keywords: Surface plasmon resonance, Plasmonic scattering microscopy, Cell physiology, Surface interactions, Plasma membrane
Graphical Abstract
Cell adhesion plays a vital role in cellular processes, such as cell communications with surrounding environments, cell migration and cell proliferation, and the integration of medical implants with tissues1–3. The focal adhesions are the macromolecular assemblies serving as physical linkers between the extracellular matrix and cytoskeleton via trans-membrane receptors and cytoplasmic adaptors4–6. In the last decades, many research efforts have been made to detect the focal adhesions, including diverse imaging methods, such as focused ion beam sectioning/electron microscopy7, optical imaging on deformable substrates8–10, interference reflection microscopy11, 12, and interferometric scattering microscopy13. However, electron microscopy cannot be employed for observing living cells, and deformable substrate-based approaches only provide indirect measurement results. Although interference reflection microscopy and interferometric scattering microscopy can image the cellular dynamics, background interference from intracellular structures is a challenge for these methods to image the focal adhesions near the thin cellular plasma membrane. At the same time, various fluorescence imaging approaches were also developed to image the focal adhesions, such as total internal reflection fluorescence microscopy14, spinning-disk confocal microscopy15, DNA-PAINT super-resolution microscopy16, fluorescence interference contrast microscopy17. These approaches rely on the fluorescence labeling of specific proteins, limiting their temporal resolution and the measurement duration due to the finite emission rate and photodegradation of fluorescent sources. To our knowledge, two kinds of surface-sensitive and label-free imaging methods have been developed for directly imaging the focal adhesions in real-time, including electrochemiluminescence microscopy and surface plasmon resonance (SPR) microscopy18–24. However, the intracellular process can affect the electric field between the top electrodes and sensor surface, limiting the imaging analysis of focal adhesions in the central area with electrochemiluminescence microscopy25. SPR imaging usually has ~10 times lower spatial resolution than the diffraction limit because of the interference of planar plasmonic waves, which is a common issue for SPR and total internal reflection-based extinction microscopy26–28, limiting its application at subcellular scale29. Scanning with focused radially polarized light can be applied for improving the spatial resolution of SPR imaging, whereas with the tradeoff of temporal resolution19–21.
Here we report using plasmonic scattering microscopy (PSM), a newly developed single-molecule SPR imaging approach30, 31, for direct imaging of individual focal adhesions of living cells in a label-free, real-time and non-invasive manner with sub-micrometer diffraction-limited spatial resolution and microseconds temporal resolution. PSM employs the evanescent surface plasmon field localized within ~100 nm from the sensor surface for detection, and thus it can provide high surface sensitivity and is immune to the interference of intracellular structures. PSM also eliminates the parabolic tail in conventional SPR imaging by detecting the scattering of surface plasmonic waves by analytes, avoiding the degradation of spatial resolution by the planar plasmonic wave. Owing to this imaging mechanism, PSM can provide highspeed widefield imaging with sub-micrometer diffraction-limited spatial resolution, which is sufficient for detecting the individual focal adhesion sites with a typical size of ~ 1 μm19. In addition, the bright spot created by the analyte in the PSM image exhibits a quasi-Airy pattern, thus allowing employing the two-dimensional Gaussian fitting, which has been widely used for super-resolution fluorescence microscopy32, to analyze the PSM images for super-resolution localization of focal adhesion sites and tracking of their nanoscale lateral diffusions. We demonstrate that by tracking the nanoscopic diffusion of proteins on the antibody-modified surface, which has been well studied with gold nanoparticle labels using traditional SPR microscopy33, 34, PSM can quantify lateral diffusions of single-analyte-substrate interactions, and measure free energy profiles, which determine the molecular binding strength and rate29, 35. Next, we show that PSM can be applied to image the behaviors of individual focal adhesions with high spatiotemporal resolution on the RBL-2H3 cell during its deformation caused by osmotic pressure change and immunoglobulin E (IgE) mediated immune response.
METHODS
Materials.
The No.1 cover glasses (22×40 mm, Catalog No. 16004-318 was purchased from VWR (Radnor, PA, US). Bovine serum albumin (BSA, Catalog No. A7638), potassium chloride (KCl, Catalog No. P9333), magnesium chloride (MgCl2, Catalog No. M2670), sodium chloride (NaCl, Catalog No. S7653), HEPES (Catalog No. H4034), glucose (Catalog No. G7021), calcium chloride (CaCl2, Catalog No. C7902), and monoclonal anti-dinitrophenyl antibody (anti-DNP, Catalog No. D8406) were purchased from Sigma-Aldrich (St. Louis, MO, US). (1-Mercapto-11-undecyl)hexa(ethylene glycol) carboxylic acid (PEG6-COOH, SH-(CH2)11(OCH2CH2)6-OCH2COOH) was purchased from SensoPath Technologies Inc. (Bozeman, MT, US). 1-ethyl-3-(3-dimethylaminopropyl) carbodiimide hydrochloride (EDC, Catalog No. 22980), Sulfo-NHS (N-hydroxysulfosuccinimide, Catalog No. 24510), heat inactivated fetal bovine serum (FBS, Catalog No. A3160602), DNP-BSA (Catalog No. A23018), and 0.05% trypsin-EDTA (Catalog No. 25300054) were purchased from Thermo Scientific (Waltham, MA, US). Phosphate-Buffered Saline (PBS, Catalog No. 21-040-CV) was purchased from Corning (Corning, NY, US) and filtered with 0.22-μm filters (Millex-GS, Catalog No. SLGSM33SS) from Sigma-Aldrich (St. Louis, MO, US). Anti-IgA (IgG, Catalog No. STAR141) was purchased from BIO-RAD (Hercules, CA, US). Human colostrum IgA (Catalog No. 16-13-090701) and Human IgM (Catalog No. 16-16-090713) were purchased from Athens Research and Technology (Athens, GA, US). Deionized water with resistivity of 18.2 MΩ cm−1 was filtrated with a 0.22-μm filter and used in all experiments. RBL-2H3 cells (Catalog No. CRL-2256) and Eagle’s Minimum Essential Medium (EMEM, Catalog No. 30-2003) were purchased from American Type Culture Collection (Manassas, VA, US). Penicillin-streptomycin (Catalog No. 30-002-CI) was purchased from Corning (Corning, NY, US).
Cell culture.
RBL-2H3 cells were cultured in a humidity incubator at 37°C with 5% CO2 and 70% relative humidity. EMEM with 15% FBS and 1% penicillin–streptomycin was used as culture medium for cell growth. RBL-2H3 cells were cultured in a 25 cm2 flask (Corning, Catalog No. 3289) and passaged when approximately 80% confluence was reached. 0.05% trypsin-EDTA was used for cell passage. For the experiment, the bare gold-coated glass slide was seeded with 10000 cells/cm2 in 600 μL of growth medium and was incubated for 1 day to allow the cells to attach and grow. A 0.9 cm2 Flex-Perm silicon chamber (Greiner Bio-One) was placed on top of the gold chip to serve as a cell-culture well. Before the experiment, 0.5 μg/mL anti-DNP were added to the medium culturing RBL-2H3 cells for 1 hour incubation to bind with the cell surface expressed high affinity IgE receptors. Then the growth medium was replaced with extracellular buffer (135 mM NaCl, 5 mM KCl, 20 mM HEPES, 1.8 mM CaCl2, 1 mM MgCl2, 5.6 mM glucose, pH = 7.4) prior to the experiment. In the experiment, the silicon chamber was removed. A rectangle double-sided tape spacer is bound between a No. 1 cover glass with two 1mm drilled holes (as inlet and outlet) and a gold-coated glass slide to form a flow cell. The cell height is set to be ~50 μm by the thickness of double-sided tape (9628B, 3M, MN, US). After get the cells out of the incubator, it usually takes about 15 minutes to prepare the flow channel and configure the system parameters for measurement. Then the experiments are usually finished within 15 minutes. Thus, the typical period for one living cell measurement is about 30 minutes.
Experimental setup.
A 25 mW superluminescent diode (SLD-260-UHP, Superlum, Ireland) with central wavelength at 670 nm is used as light source. Light from the superluminescent light emitting diode is conditioned by a lens group, and then focused to the back focal plane of a 60x oil immersion objective (NA = 1.49, Olympus) by a tube lens with focal length of 400 mm (ACT508-400-A, Thorlabs, Newton, NJ). The incident angle was adjusted by a manual translation stage (PT3, Thorlabs, Newton, NJ) to reach surface plasmon resonance. Light reflected from the gold-coated glass slide is also collected by a camera (CM3-U3-13Y3M-CS, Point Grey) for helping to find the resonance angle. Scattered light from the protein and gold surface is collected by a top mounted 100x objective (NA = 0.85, Olympus) to form a PSM image on a second camera (CB013MG-LX-X8G3, XIMEA). A light emitting diode (M450LP1, Thorlabs, Newton, NJ) powered by a driver with trigger mode (LEDD1B, Thorlabs, Newton, NJ) was employed for the illumination in bright field imaging. More detailed schematic representation of the optics can be found in Figure S1.
Surface functionalization.
For the antibody-protein measurement shown in Fig. 2, gold-coated glass slides were fabricated by coating a BK7 cover glass with 1 nm Cr followed by 47 nm gold via thermal evaporation (PVD75 E-beam/Thermal Evaporator, Kurt J. Lesker Company). Prior to antibody coating, the gold surface was rinsed by ethanol and deionized water twice, and then annealed with hydrogen flame to remove surface contaminants. The gold surface of each glass slide was modified with carboxyl groups by incubation with 1 mM PEG6-COOH in PBS buffer for 1 hour. Then the surface was incubated in 0.05 M NHS/0.2 M EDC in PBS buffer for 15 min to activate the carboxyl groups. After rinsing with PBS, 20 nM anti-IgA was applied to the surface and incubated for 30 min to allow immobilization. At last, the surface was incubated in PBS with 1 mg/ml BSA for 10 min to block non-specific binding sites.
Figure 2.
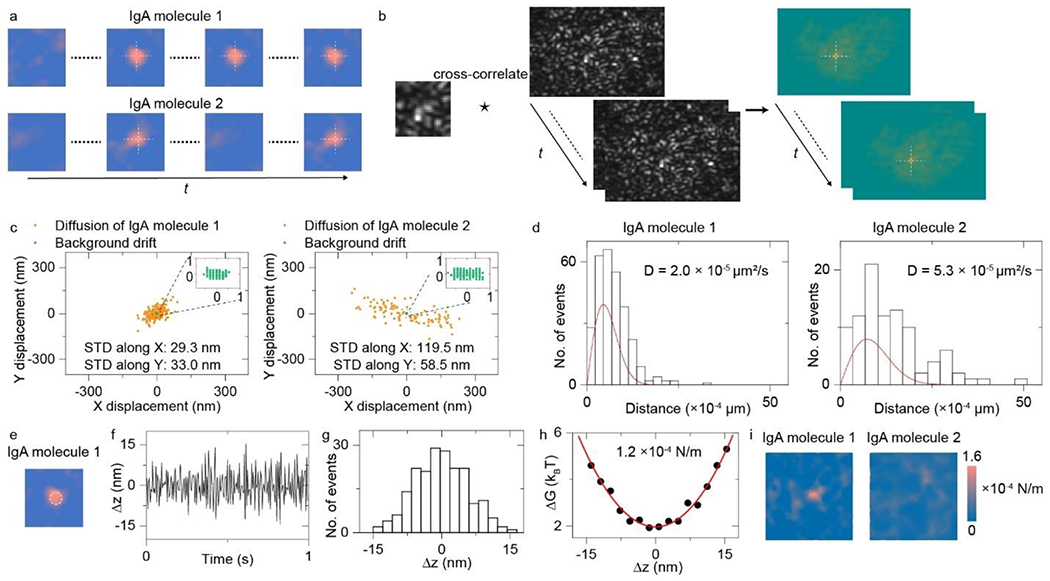
a, Two types of protein binding behaviors on antibody modified surface: hit and stay (IgA molecule 1), and bind and unbind rapidly (IgA molecule 2). b, Schematic of PIV approach for measuring lateral drift. c, Lateral tracking results of IgA molecules 1 and 2. d, Probability density for the IgA molecules to move a distance in the fixed time interval and fitted results with the isotropic two-dimensional random-walk diffusion model. e, Schematic of region of interest for calculating ensemble free energy profile of IgA molecule 1. f, Time trace of z-displacement of IgA molecule 1 obtained from the time-dependent PSM image contrast. g, Probability density determined from the statistical distribution of z-displacement amplitude. h, Free energy profile achieved from the probability density and fitted results with polynomial function. The effective spring constant obtained from fitting was also presented. i, Effective spring constant landscapes for the area interacting with IgA molecules 1 and 2. Incident light intensity and camera exposure time are 4 kW cm−2 and 0.5 ms, respectively. Effective frame rate after average is 200 fps.
Data processing.
For single protein imaging shown in Fig. 1 b–d, the raw image sequence was converted to a 20-fps averaged-image sequence, by averaging images over every 50 ms using MATLAB program as shown in Supplementary Note 1, to suppress the shot noise. To remove the background, a 20-fps differential image sequence was obtained by subtracting the previous frame from the present frame of the averaged-image sequence using MATLAB program as shown in Supplementary Note 2. The TrackMate plugin in ImageJ was employed to find and count the molecules36, 37. The PSM intensity of one protein molecule was determined by integrating the intensities of all pixels within the Airy disk. For wavelength of 670 nm and objective NA of 0.85, the diameter of Airy disk was estimated to be 0.67/0.85 ~= 0.8 μm, corresponding to ~ 6 pixels in diameter in the image. Origin 2019 was used to create data plots and histograms.
Figure 1.
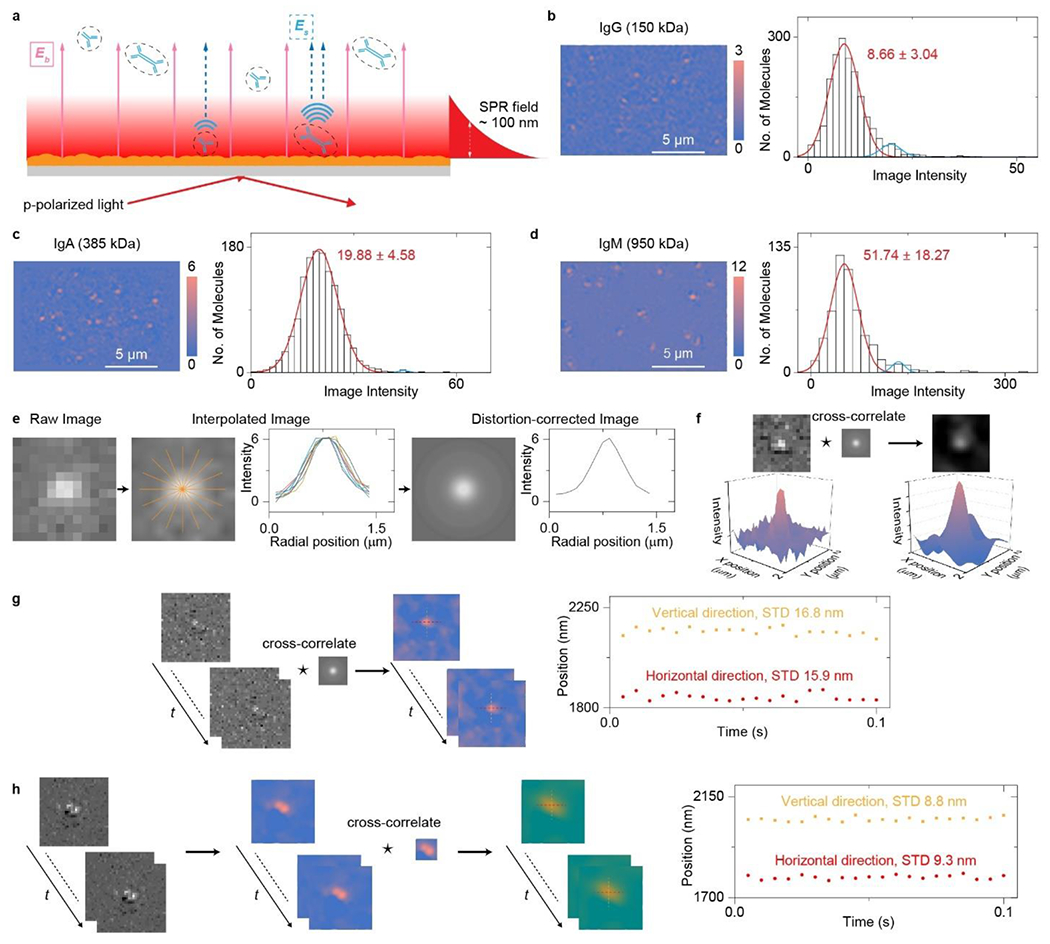
Setup and principle of plasmonic scattering microscopy (PSM) for single protein/cell imaging. a, Simplified sketch of the optical setup, where evanescent surface plasmon resonance (SPR) field is excited by light from the bottom of a gold-coated glass slide and scattering of the plasmonic waves by a particle or protein (Es) and by the gold surface (Eb) is collected from the top to form a PSM image (Fig. S1 for details). b-d, PSM images and image intensity histograms of IgG (150 kDa, a), IgA (385 kDa, b), and IgM (950kDa, c) proteins, respectively, where the solid lines are Gaussian fittings. In each histogram, a small second peak (blue line) is attributed to formation of dimers or two particles binding to the nearby surface simultaneously with distance smaller than the diffraction limit. Incident light intensity and camera exposure time are 4 kW cm−2 and 0.5 ms. Effective frame rate after average is 20 fps. e, Extracting mean radial profiles from one differential frame where one protein has been recognized to construct full-circle point spread function (PSF). f, Correcting the PSM image distortions by cross-correlating the PSM images with the PSF. g, Tracking the position of one protein binding on the sensor surface with recording frame rate of 200 fps and duration of 0.1 second using single particle tracking approach. h, Tracking the position of two proteins binding to the nearby surface with recording frame rate of 200 fps and duration of 0.1 second using particle image velocimetry approach (Supplementary Note 3 for detailed analysis).
For the molecule tracking of single proteins diffusion shown in Fig. 1g and 2c, the differential image sequence was integrated to visualize the diffusion process with drift correction as described previously30. Then each frame was cross-correlated with the full-circle PSF to correct the image distortion. For the molecular tracking of subregion in raw image shown in Fig. 1h and 2b, the subregion from first image was cross correlated with the raw image sequence. Finally, the TrackMate plugin in ImageJ was employed to find the single molecule binding position at every frame for Fig. 1g, and 2c, and to find the displacement of the maximum position shifted from the origin in the cross-correlation result. MATLAB codes for achieving full-circle PSF and spatial cross-correlation have been deposited on GitHub and are available at https://github.com/ZXY1231/PSMCellCode.
To quantify the single protein diffusion behaviors as shown in Fig. 2d, the diffusion coefficient D is calculated by fitting the frame-to-frame two-dimensional moving distance distribution with the random-walk diffusion model described by
| (1) |
where P(r) is the probability density for a molecule to move a distance r in the time interval Δt38, 39. MATLAB codes for diffusion coefficient calculation have been deposited on GitHub and are available at https://github.com/ZXY1231/PSMCellCode.
For the time trace of z-displacement shown in Fig. 2f as an example, the z-displacement was achieved based on the evanescent surface plasmon field intensity I of
| (2) |
where I0 is the plasmonic image intensity at z = 0 and L is the decay constant of ~100 nm33. The z-displacement can be calculated as
| (3) |
where I(t+Δt) and I(t) are the plasmonic image intensity at t+Δt and t. The probability density P(z) is determined from the statistical distribution of fluctuation z-displacement amplitude. The free energy profile, G(z) (the potential of mean force), can be achieved from the P(z) according to
| (4) |
where A is a constant that can be determined by normalization of P(z), kB is the Boltzmann constant, and T is the temperature29, 35. The effective spring constant kf can be determined from the simplified expression of free energy profile near equilibrium shown as
| (5) |
where G(0) is the free energy at equilibrium33, 35. The effective spring constant reflects restoring force of the system back to equilibrium. The effective spring constant landscapes were achieved by calculating the effective spring constant at each pixel position. MATLAB codes for effective spring constant calculation have been deposited on GitHub and are available at https://github.com/ZXY1231/PSMCellCode.
RESULTS
Imaging principles:
With an objective placed on top of the sensor chip, PSM images the surface plasmonic waves, which are excited with conventional SPR imaging scheme, scattered by the objects on the sensor chip. The plasmonic waves scattered by the surface roughness was also recorded as the reference field to interfere with the plasmonic wave scattered by the objects for signal enhancement. A two-way push-pull flow cell, which does not require tight seal and can be easily implemented on gold-coated glass slide with cultured cells, is employed for sample or drug delivery to sensor surface (Fig. 1a, Fig. S1 for details). The PSM images of objects were achieved with differential processing from raw image sequence (Methods). PSM image contrast varies against the analyte mass localized within the evanescent surface plasmon field (Fig. 1b–d), indicating that it can be used to monitor the distance between analyte centroid and sensor surface, which determines the mass of biological substances interacting with the evanescent field. The bright spots created by objects in the PSM image usually have slightly distorted Airy patterns, which may be caused by the imperfect optics, uneven background scattering and delocalized propagation of surface plasmonic waves. To correct this distortion, the point spread function (PSF) of PSM is extracted from one differential frame where a protein has been recognized. To compensate for the intensity variations caused by the uneven background, the mean radial profile was computed from the radial profiles at different angles to generate the full-circle PSF (Fig. 1e). The resulting full-circle PSF was used to cross-correlate with the PSM images to correct the image distortions for improving image quality (Fig. 1f). The distortion corrected PSM image sequences were employed for further processing. Tracking of the object displacement can be achieved through single particle tracking (SPT) or particle image velocimetry (PIV). SPT is achieved by linking the object localization into trajectories and can be employed to track the single object binding on the surface. PIV is achieved by assessing the relative spatial shift of sub-regions with spatial correlation and can be employed to track the overall motions of particle assembly, such as two proteins binding to nearby the surface. Both SPT and PIV approaches can perform super-resolution tracking with precision close to the theoretical limit of 10 ~ 15 nm for the proteins covalently binding on the surface (Fig. 1g and 1h, Supplementary Note 3 for details), and can be employed to extract the nanoscale lateral displacement information from PSM images in different applications.
Tracking single protein diffusion:
After binding to the antibody modified surface, some protein molecules stay on the surface (IgA molecule 1) and some of them bind and unbind rapidly (IgA molecule 2; Fig. 2a and Video S1)30. SPT and PIV approaches were employed to track the lateral displacement of the protein molecules and lateral drift within 1 second, respectively (Fig. 2a and 2b). The lateral drift was quantified by cross-correlating one subregion from the first raw image with the raw image sequence, and then tracking the displacement of the maximum position shifted from the origin in the cross-correlation products33, 40. The lateral tracking results indicate that IgA molecule 2 has a larger motion range in both x- and y-directions than IgA molecule 1 (Fig. 2c). The isotropic two-dimensional random-walk diffusion model was employed to fit the probability density for the IgA molecules to move a distance in the fixed time interval39, showing that IgA molecule 2 has ~3 times larger diffusion coefficient than IgA molecule 1 (Fig. 2d and Methods), which indicates that the IgA molecule 2 may be not specifically captured by the antibodies. To confirm this result, the free energy profile of the IgA molecule 1 was analyzed (Fig. 2e). The time trace of z-displacement of IgA molecule 1 was firstly obtained from the time-dependent mean PSM image contrast, and then the probability density was determined from the statistical distribution of z-displacement amplitude, and finally the free energy profile was calculated from the probability density and fitted with polynomial function to obtain the effective spring constant (Fig. 2 f–h and Methods). The IgA molecule 1, which hits and stays on the antibody-modified surface, exhibits a definite effective spring constant value as predicted by previous specific binding research33, 35. Then, the z-displacement spatial distribution was analyzed to obtain the effective spring constant landscapes for IgA molecules 1 and 2 (Fig. 2i), showing that the binding site of IgA molecule 1 owns a larger spring constant than other sites, which reflects the restoring force arising from molecular binding. In contrary, there is no spring constant peak in the area interacting with IgA molecule 2, which hits and diffuses on the antibody modified surface transiently resulting from weak nonspecific molecular interactions.
This experiment demonstrates that PSM can quantify the nanoscale displacement and free energy profiles of biological substances in label-free manner without using the gold nanoparticle labels, which are usually required by the traditional SPR microscopy33, 34. The effective spring constant represents the curvature (second derivative) of the free energy near equilibrium, reflecting the restoring force of the system back to equilibrium, which can be used to quantify how far the observed state is away from the thermal equilibrium. Considering that the living cells operate out of thermodynamic equilibrium at the molecular scale41, the effective spring constant can be employed as an excellent indicator to evaluate the binding conditions of focal adhesions during their migrations.
Imaging RBL-2H3 cell response to osmotic pressure change:
We firstly demonstrated the capability of PSM for imaging the focal adhesion behaviors during cell deformation caused by osmotic pressure change, which is a well-known phenomenon and can be easily observed with conventional bright field microscopy (Fig. S2). The cell was cultured on the gold-coated glass slide and the PSM image clearly shows that the cell absorbed onto the surface with several individual focal adhesions (Fig. 3a). For live cell measurement, we inject the extracellular buffer solution with a flow rate of 200 μL/min to maintain the near-neutral pH environment around the cells. The gold film has a heating effect under surface plasmon resonance conditions, and the incident intensity of 600 W cm−2 used in this study will increase the temperature of solution nearby the surface from room temperature to ~35 °C (Fig. S3). These operations create a friendly environment for live cells. While the cell maintained its morphology in the extracellular solution, the focal adhesions showed small random diffusion without directional movement, because the intracellular diffusion underlies many cellular processes in living cells39 (Fig. 3b and Video S2). When the extracellular solution with normal osmotic pressure (290 mmol/kg) was changed to a hypertonic solution with additional sucrose (325 mmol/kg), the focal adhesions showed centripetal movement behaviors in addition to their random diffusions (Fig. 3c and Video S3). This can be predicted because the living cells will present global contraction behaviors as a response to osmotic pressure increase. Next, water with very low osmotic pressure of ~ 7 mmol/kg was used to immerse the cell (Fig. 3d and Video S4), where the PSM images clearly show that the focal adhesions spread over the substrate rapidly as the cell volume expanding in response to the low osmotic pressure. This phenomenon can be observed in three different cells (Fig. S4), showing that the PSM can be used to monitor the individual focal adhesion behaviors during the cell deformation process. The focal adhesions are individual junctions connecting the cell membrane with the extracellular matrix, so they usually show as single bright spots with two-dimension Gaussian distribution, namely the Airy pattern, on the PSM image. In addition, because the penetration depth of the surface plasmon resonance field is only ~100 nm, the formation and destruction of focal adhesion observed by PSM usually happen transiently, so the single bright spots created by focal adhesions usually have only two conditions, namely existing and disappearing. The single bright spots in the image usually have the peak intensity of more prominent than 200 grayscales, which is 20% of the maximum detectable intensity allowed by the camera.
Figure 3.
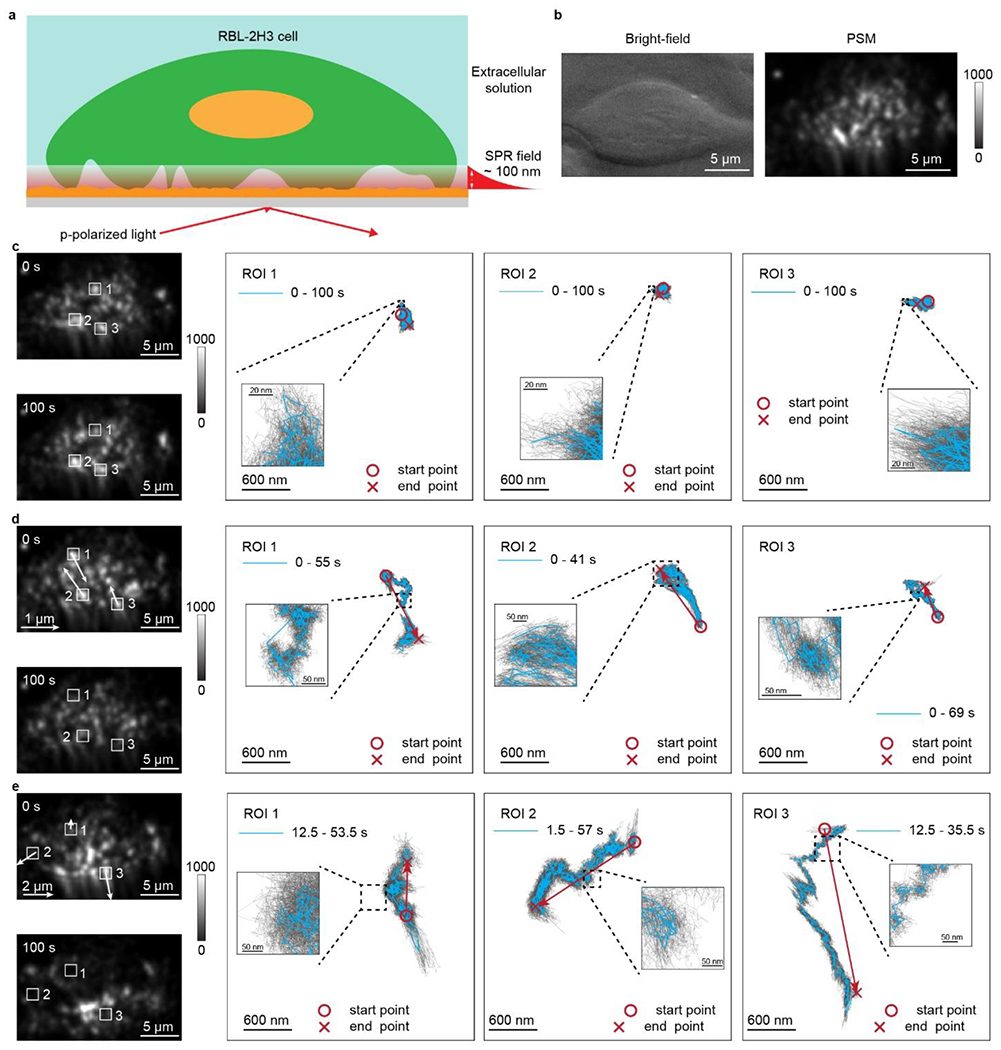
a, Schematic for imaging the focal adhesion dynamics during RBL-2H3 cell response to osmotic pressure change. b, Bright field and PSM images of one RBL-2H3 cell cultured on the gold-coated glass slide. c, RBL-2H3 cell in the extracellular solution, and the trajectories of focal adhesion movements in the region of interest (ROI) show that the cell maintains its morphology. d, RBL-2H3 cell response during the process changing the extracellular solution osmotic pressure from 290 mmol/kg to 325 mmol/kg, and the trajectories of focal adhesion movements in the ROIs show that the cell presents global contraction behaviors. e, RBL-2H3 cell response during the process changing the extracellular solution to water, and the trajectories of focal adhesion movements in the ROIs show the cell spreads over the substrate. The blue lines are achieved with moving average over the window of 0.05 s, and the gray lines are achieved with moving average over window of 0.005 s. Incident light intensity and camera exposure time are 600 W cm−2 and 0.15 ms. Camera recording frame rate is 800 fps.
High-speed tracking of RBL-2H3 cell response to IgE mediated activation:
RBL-2H3 cell, a model mast cell, express a high-affinity immunoglobulin E (IgE) receptor, FcεRI, on the membrane, which bind to Fc region of IgE antibody (Fig. S5). The 2,4-dinitrophenylated albumin from bovine serum (DNP-BSA) can specifically bind to anti-DNP IgE and cross-link FcεRI to activate immune cell response, leading to the cell membrane deformation42. The deformable substrate-based imaging shows that the shear force generated by the cell adhesions will constrain the cell spreading10. Here we show that the PSM can reveal the focal adhesion behaviors during the immune cell response on microsecond time scale. One RBL-2H3 cell, which was cultured on the gold-coated glass slide and modified with IgE antibodies before experiment, was employed for the measurement (Fig. 4a), and its deformation was recorded with 7000 frames per second for ~85 seconds after activation with DNP-BSA. The movement of focal adhesions clearly indicate the cell deformation occurs after the activation (Fig. 4b and Video S5). The cell deformation can be observed in three different cells (Fig. S6). Tracking results of the nanoscale displacement of focal adhesions in different regions show that they have complicated behaviors including random diffusions and back-and-forth motion in addition to the centripetal movements, including the focal adhesions located in the central region of the cell, which is hard to be observed by the conventional bright field imaging (Fig. 4c). One interesting phenomenon is that the movements of focal adhesions are not monotonous but accompanying with random diffusions, and they can be observed at microsecond time scale (Video S6), which may be caused by Brownian motions in the living cells39. The other phenomenon worth noting is that focal adhesions may disappear during the deformation process, which is the reason that trajectory can only be achieved within finite durations in some regions of interest in Fig. 4c. This may be because the cell could cut off the old focal adhesions before creating new ones as a migration strategy43.
Figure 4.
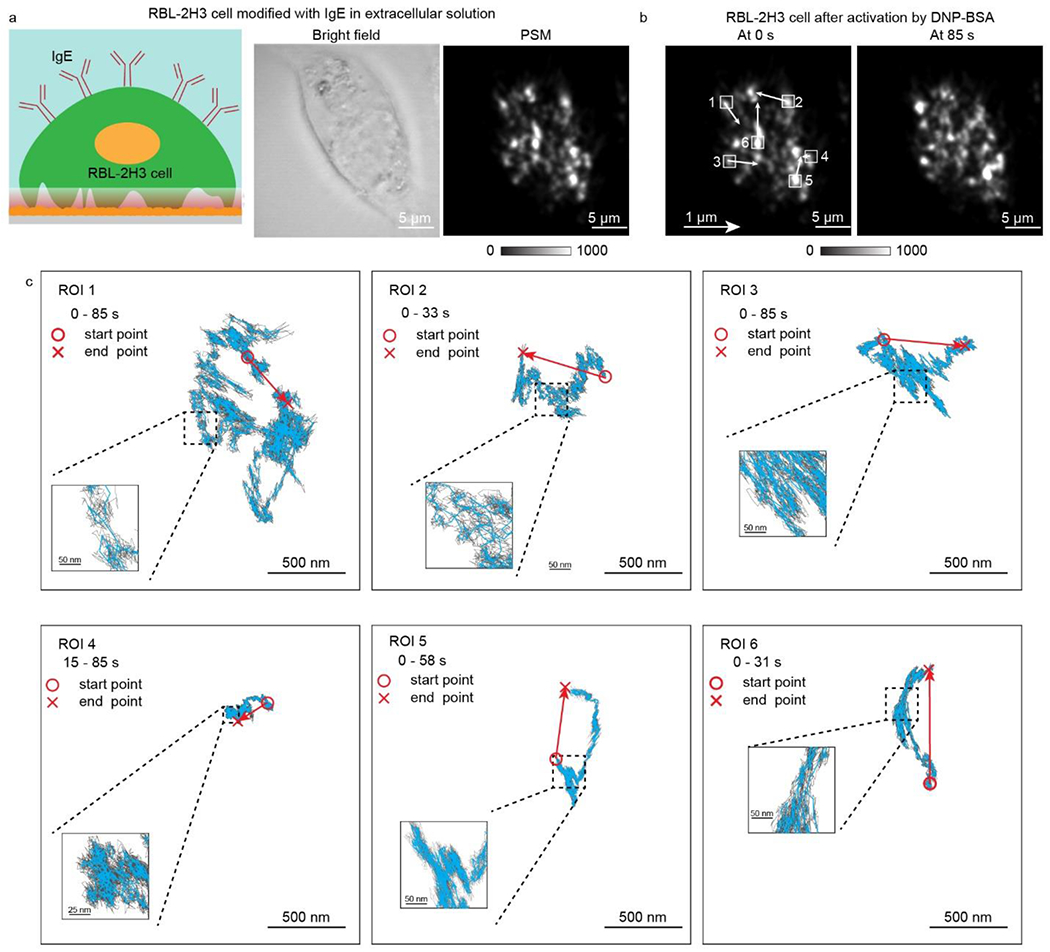
a Bright field and PSM images of one RBL-2H3 cell modified with IgE antibody cultured on the gold-coated glass slide. b, RBL-2H3 cell after activation by 5 μg/mL DNP-BSA solution, and the local displacement was indicated by arrows. c, The trajectory of focal adhesion movements in the region of interest (ROI) marked in b. The blue lines are achieved with moving average over the window of 0.05 s, and the gray lines are achieved with moving average over window of 0.005 s. Incident light intensity and camera exposure time are 600 W cm−2 and 0.15 ms. Camera recording frame rate is 7000 fps.
After analyzing the free energy profiles of the focal adhesions, we obtain the effective spring constant map (Fig. 5a and Video S5), which shows similar random and directional movement tendency as the nanoscale displacement of focal adhesions in the corresponding regions (Fig. 5b). The pixel-by-pixel correlation coefficient between the PSM image intensity and the effective spring constant of focal adhesion is ~0.68. This is reasonable because the focal adhesions indicate the membrane and extracellular matrix junctions, so the focal adhesions should have a larger effective spring constant than other floating parts. The angles between the directions of focal adhesion movements tracked from the PSM images and effective spring constant maps are mostly acute (Fig. S7). This indicates that the binding locations of focal adhesions are also varying along with the cell deformation. This correlation indicates that the cell may changes its morphology by varying the adhesive structure. The correlation analysis between effective spring constant and movement distances of focal adhesions shows that they are inversely related to each other (Fig. 5c), indicating that the focal adhesions tend to move slowly under tight binding conditions. These results provide direct experimental evidence that the shear deformation of the living cell is related to the conditions of focal adhesions binding to the extracellular matrix, and the cells may regulate their morphologies and activities via changing the focal adhesion binding conditions.
Figure 5.
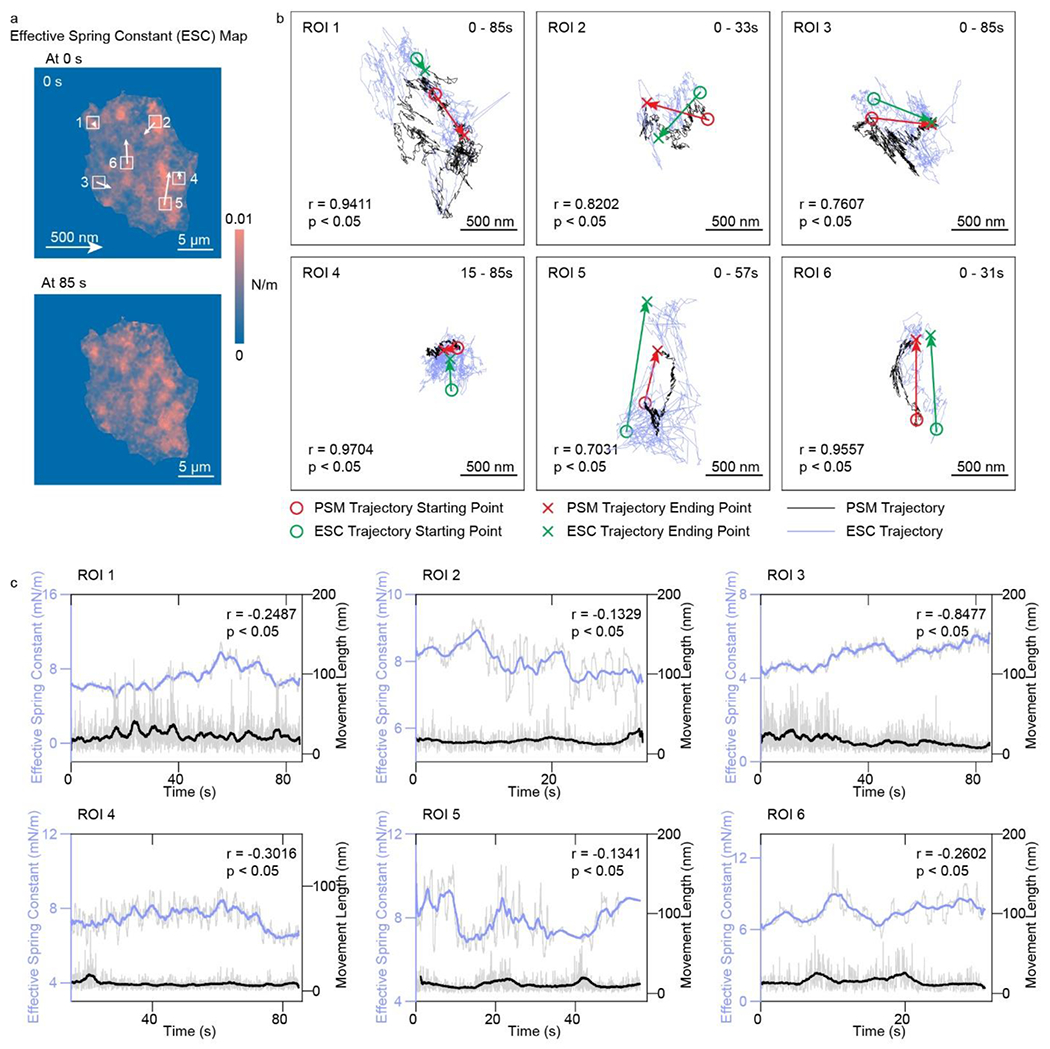
a, Effective spring constant maps of the same RBL-2H3 cell shown in Fig. 4, after activation by 5 μg/mL DNP-BSA solution. The movements of maximum effective local spring constant locations were indicated by arrows. b, Overlays of trajectory of focal adhesion movements (black lines) and trajectory of maximum local effective spring constant locations (blue lines) in the region of interest (ROI) marked in a. r represents the correlation coefficient between two trajectories. c, The correlation of focal adhesion movement distances with effective spring constant. The solid lines are achieved with moving average over the window of 2.5 s, and the shadow lines are achieved with moving average over window of 0.05 s. Incident light intensity and camera exposure time are 600 W cm−2 and 0.15 ms. Camera recording frame rate is 7000 fps.
DISCUSSION AND OUTLOOK
The cellular plasma membrane plays a vital role in many cell activities. Evanescent imaging detection was usually considered an excellent tool for studying membrane dynamics because it is surface-sensitive and immune to the interference of intracellular structure variations, and it allows the label-free measurement without additional chemicals. However, the widespread applications of traditional evanescent imaging techniques for monitoring cellular membrane dynamics are limited due to their low spatial resolution caused by the interference of planar evanescent waves, thus only allowing the analysis with single-cell resolution29. In this work, we have presented intriguing data for which the evanescent imaging technique with the high spatial and temporal resolution, namely the PSM, provides new insight into the nanoscale displacements of the focal adhesions, which are the physical linkers of cell cytoskeleton to the extracellular matrix. This capability allows the analysis of the cell deformations caused by osmotic pressure change or immune activation at a single focal adhesion level. In addition, the PSM can also map the effective spring constants, which are related to the focal adhesion binding strength and rate, for further studying the variations of adhesive structures mediating the cellular morphology changes.
The temporal resolution of our current PSM setup is limited by the camera speed. Providing the field of view covering one cell limits the frame rate to be ~7000 fps, and the requirement of storing the image sequence in RAW story limits the measurement period to be ~90 s. Use of an ultra-high speed camera with on board fast memory and frame rate of up to 1 M fps can further improve the temporal resolution to 1 μs. Another promising approach is reducing the recording pixel numbers within the region of interest to decrease data size of each image and then apply the spatial correlation with the system point spread function to restore the sample information. For practical applications, such as developing new materials for medical implants, PSM allows replacing the surface plasmon field with other kinds of evanescent field, such as metal-clad waveguide sensors, for illumination. The metal-clad waveguide scheme was constructed by depositing the dielectric film on gold film to permit waveguide propagation, and the dielectric film can be prepared by different materials44, 45, thus providing a flexible solution for screening the materials suitable for medical implants with successful device integration with tissues. We anticipate that the PSM will become a powerful tool for studying the mechanism of cell adhesions and helping design new biomaterials for medical applications.
Supplementary Material
Video S2: RBL-2H3 cell in the extracellular solution (290 mmol/kg).
Video S1: IgA molecule hits and stays (IgA molecule 1), and bind and unbind rapidly (IgA molecule 2) on the antibody modified surface.
Video S3: RBL-2H3 cell response when changing the immersion solution from extracellular solution (290 mmol/kg) to hypertonic solution (325 mmol/kg).
Video S4: RBL-2H3 cell response when changing immersion solution from extracellular solution (290 mmol/kg) to water (7 mmol/kg)
Video S5: RBL-2H3 cell response to IgE-mediated activation with temporal resolution of 0.5 s within 85 s.
Video S6: RBL-2H3 cell response to IgE-mediated activation with temporal resolution of 140 μs within 10 s.
ACKNOWLEDGMENT
We thank financial support from National Institutes of Health (R01GM107165). We acknowledge the use of facilities within the ASU NanoFab supported in part by NSF program NNCI-ECCS-1542160.
Footnotes
Supporting Information Available.
The following files are available free of charge.
Details of optical design, bright field imaging of osmotic pressure induced cell deformation, light-induced heating effect on PSM sensing area, osmotic pressure induced morphological changes of three RBL-2H3 cells, fluorescence images of RBL-2H3 cells labelled with IgE antibodies, DNP-BSA activated deformation of three RBL-2H3 cells, statistical results of intersection angles, source codes for image processing, and estimation of signal-to-noise ratio and tracking precision (PDF).
The authors declare no competing financial interest.
REFERENCES
- 1.Geiger B; Spatz JP; Bershadsky AD, Environmental sensing through focal adhesions. Nature Reviews Molecular Cell Biology 2009, 10 (1), 21–33. [DOI] [PubMed] [Google Scholar]
- 2.Schwarz US; Safran SA, Physics of adherent cells. Reviews of Modern Physics 2013, 85 (3), 1327–1381. [Google Scholar]
- 3.van Helvert S; Storm C; Friedl P, Mechanoreciprocity in cell migration. Nature Cell Biology 2018, 20 (1), 8–20. [DOI] [PMC free article] [PubMed] [Google Scholar]
- 4.Schwarz US; Balaban NQ; Riveline D; Addadi L; Bershadsky A; Safran SA; Geiger B, Measurement of cellular forces at focal adhesions using elastic micro-patterned substrates. Materials Science and Engineering: C 2003, 23 (3), 387–394. [Google Scholar]
- 5.Sarangi BR; Gupta M; Doss BL; Tissot N; Lam F; Mège R-M; Borghi N; Ladoux B, Coordination between Intra- and Extracellular Forces Regulates Focal Adhesion Dynamics. Nano Letters 2017, 17 (1), 399–406. [DOI] [PMC free article] [PubMed] [Google Scholar]
- 6.Wu P-H; Aroush DR-B; Asnacios A; Chen W-C; Dokukin ME; Doss BL; Durand-Smet P; Ekpenyong A; Guck J; Guz NV; Janmey PA; Lee JSH; Moore NM; Ott A; Poh Y-C; Ros R; Sander M; Sokolov I; Staunton JR; Wang N; Whyte G; Wirtz D, A comparison of methods to assess cell mechanical properties. Nature Methods 2018, 15 (7), 491–498. [DOI] [PMC free article] [PubMed] [Google Scholar]
- 7.Santoro F; Zhao W; Joubert L-M; Duan L; Schnitker J; van de Burgt Y; Lou H-Y; Liu B; Salleo A; Cui L; Cui Y; Cui B, Revealing the Cell–Material Interface with Nanometer Resolution by Focused Ion Beam/Scanning Electron Microscopy. ACS Nano 2017, 11 (8), 8320–8328. [DOI] [PMC free article] [PubMed] [Google Scholar]
- 8.Balaban NQ; Schwarz US; Riveline D; Goichberg P; Tzur G; Sabanay I; Mahalu D; Safran S; Bershadsky A; Addadi L; Geiger B, Force and focal adhesion assembly: a close relationship studied using elastic micropatterned substrates. Nature Cell Biology 2001, 3 (5), 466–472. [DOI] [PubMed] [Google Scholar]
- 9.Barbieri L; Colin-York H; Korobchevskaya K; Li D; Wolfson DL; Karedla N; Schneider F; Ahluwalia BS; Seternes T; Dalmo RA; Dustin ML; Li D; Fritzsche M, Two-dimensional TIRF-SIM–traction force microscopy (2D TIRF-SIM-TFM). Nature Communications 2021, 12 (1), 2169. [DOI] [PMC free article] [PubMed] [Google Scholar]
- 10.Li D; Colin-York H; Barbieri L; Javanmardi Y; Guo Y; Korobchevskaya K; Moeendarbary E; Li D; Fritzsche M, Astigmatic traction force microscopy (aTFM). Nature Communications 2021, 12 (1), 2168. [DOI] [PMC free article] [PubMed] [Google Scholar]
- 11.Barr VA; Bunnell SC, Interference Reflection Microscopy. Current Protocols in Cell Biology 2009, 45 (1), 4.23.1–4.23.19. [DOI] [PMC free article] [PubMed] [Google Scholar]
- 12.Limozin L; Sengupta K, Quantitative Reflection Interference Contrast Microscopy (RICM) in Soft Matter and Cell Adhesion. ChemPhysChem 2009, 10 (16), 2752–2768. [DOI] [PubMed] [Google Scholar]
- 13.Park J-S; Lee I-B; Moon H-M; Joo J-H; Kim K-H; Hong S-C; Cho M, Label-free and live cell imaging by interferometric scattering microscopy. Chemical Science 2018, 9 (10), 2690–2697. [DOI] [PMC free article] [PubMed] [Google Scholar]
- 14.Burmeister JS; Olivier LA; Reichert WM; Truskey GA, Application of total internal reflection fluorescence microscopy to study cell adhesion to biomaterials. Biomaterials 1998, 19 (4), 307–325. [DOI] [PubMed] [Google Scholar]
- 15.Gupton SL; Waterman-Storer CM, Spatiotemporal Feedback between Actomyosin and Focal-Adhesion Systems Optimizes Rapid Cell Migration. Cell 2006, 125 (7), 1361–1374. [DOI] [PubMed] [Google Scholar]
- 16.Schlichthaerle T; Lindner C; Jungmann R, Super-resolved visualization of single DNA-based tension sensors in cell adhesion. Nature Communications 2021, 12 (1), 2510. [DOI] [PMC free article] [PubMed] [Google Scholar]
- 17.Iwanaga Y; Braun D; Fromherz P, No correlation of focal contacts and close adhesion by comparing GFP-vinculin and fluorescence interference of DiI. European Biophysics Journal 2001, 30 (1), 17–26. [DOI] [PubMed] [Google Scholar]
- 18.Wang W; Wang S; Liu Q; Wu J; Tao N, Mapping Single-Cell–Substrate Interactions by Surface Plasmon Resonance Microscopy. Langmuir 2012, 28 (37), 13373–13379. [DOI] [PMC free article] [PubMed] [Google Scholar]
- 19.Watanabe K; Matsuura K; Kawata F; Nagata K; Ning J; Kano H, Scanning and non-scanning surface plasmon microscopy to observe cell adhesion sites. Biomedical Optics Express 2012, 3 (2), 354–359. [DOI] [PMC free article] [PubMed] [Google Scholar]
- 20.Toma K; Kano H; Offenhäusser A, Label-Free Measurement of Cell–Electrode Cleft Gap Distance with High Spatial Resolution Surface Plasmon Microscopy. ACS Nano 2014, 8 (12), 12612–12619. [DOI] [PubMed] [Google Scholar]
- 21.Kreysing E; Hassani H; Hampe N; Offenhäusser A, Nanometer-Resolved Mapping of Cell–Substrate Distances of Contracting Cardiomyocytes Using Surface Plasmon Resonance Microscopy. ACS Nano 2018, 12 (9), 8934–8942. [DOI] [PubMed] [Google Scholar]
- 22.Ding H; Guo W; Su B, Imaging Cell-Matrix Adhesions and Collective Migration of Living Cells by Electrochemiluminescence Microscopy. Angewandte Chemie International Edition 2020, 59 (1), 449–456. [DOI] [PubMed] [Google Scholar]
- 23.Ding H; Zhou P; Fu W; Ding L; Guo W; Su B, Spatially Selective Imaging of Cell–Matrix and Cell–Cell Junctions by Electrochemiluminescence. Angewandte Chemie International Edition 2021, 60 (21), 11769–11773. [DOI] [PubMed] [Google Scholar]
- 24.Dai S; Yu T; Zhang J; Lu H; Dou J; Zhang M; Dong C; Di J; Zhao J, Real-time and wide-field mapping of cell-substrate adhesion gap and its evolution via surface plasmon resonance holographic microscopy. Biosensors and Bioelectronics 2021, 174, 112826. [DOI] [PubMed] [Google Scholar]
- 25.Wang W; Foley K; Shan X; Wang S; Eaton S; Nagaraj V; Wiktor P; Patel U; Tao N, Single cells and intracellular processes studied by a plasmonic-based electrochemical impedance microscopy. Nature Chemistry 2011, 3 (3), 249–255. [DOI] [PMC free article] [PubMed] [Google Scholar]
- 26.Yang Y; Shen G; Wang H; Li H; Zhang T; Tao N; Ding X; Yu H, Interferometric plasmonic imaging and detection of single exosomes. Proceedings of the National Academy of Sciences 2018, 115 (41), 10275. [DOI] [PMC free article] [PubMed] [Google Scholar]
- 27.Li M; Yuan T; Jiang Y; Sun L; Wei W; Chen H-Y; Wang W, Total Internal Reflection-Based Extinction Spectroscopy of Single Nanoparticles. Angewandte Chemie International Edition 2019, 58 (2), 572–576. [DOI] [PubMed] [Google Scholar]
- 28.Yang Y; Zhai C; Zeng Q; Khan AL; Yu H, Multifunctional Detection of Extracellular Vesicles with Surface Plasmon Resonance Microscopy. Analytical Chemistry 2020, 92 (7), 4884–4890. [DOI] [PubMed] [Google Scholar]
- 29.Liu Y-N; Lv Z-T; Lv W-L; Liu X-W, Plasmonic probing of the adhesion strength of single microbial cells. Proceedings of the National Academy of Sciences 2020, 117 (44), 27148. [DOI] [PMC free article] [PubMed] [Google Scholar]
- 30.Zhang P; Ma G; Dong W; Wan Z; Wang S; Tao N, Plasmonic scattering imaging of single proteins and binding kinetics. Nature Methods 2020, 17 (10), 1010–1017. [DOI] [PMC free article] [PubMed] [Google Scholar]
- 31.Zhang P; Ma G; Wan Z; Wang S, Quantification of Single-Molecule Protein Binding Kinetics in Complex Media with Prism-Coupled Plasmonic Scattering Imaging. ACS Sensors 2021, 6 (3), 1357–1366. [DOI] [PMC free article] [PubMed] [Google Scholar]
- 32.Yildiz A; Forkey JN; McKinney SA; Ha T; Goldman YE; Selvin PR, Myosin V Walks Hand-Over-Hand: Single Fluorophore Imaging with 1.5-nm Localization. Science 2003, 300 (5628), 2061. [DOI] [PubMed] [Google Scholar]
- 33.Wang H; Tang Z; Wang Y; Ma G; Tao N, Probing Single Molecule Binding and Free Energy Profile with Plasmonic Imaging of Nanoparticles. Journal of the American Chemical Society 2019, 141 (40), 16071–16078. [DOI] [PubMed] [Google Scholar]
- 34.Wang Y; Tang Z; Chen H-Y; Wang W; Tao N; Wang H, Single-molecule calorimeter and free energy landscape. Proceedings of the National Academy of Sciences 2021, 118 (23), e2104598118. [DOI] [PMC free article] [PubMed] [Google Scholar]
- 35.Dudko OK; Filippov AE; Klafter J; Urbakh M, Beyond the conventional description of dynamic force spectroscopy of adhesion bonds. Proceedings of the National Academy of Sciences 2003, 100 (20), 11378. [DOI] [PMC free article] [PubMed] [Google Scholar]
- 36.Schneider CA; Rasband WS; Eliceiri KW, NIH Image to ImageJ: 25 years of image analysis. Nature Methods 2012, 9 (7), 671–675. [DOI] [PMC free article] [PubMed] [Google Scholar]
- 37.Tinevez J-Y; Perry N; Schindelin J; Hoopes GM; Reynolds GD; Laplantine E; Bednarek SY; Shorte SL; Eliceiri KW, TrackMate: An open and extensible platform for single-particle tracking. Methods 2017, 115, 80–90. [DOI] [PubMed] [Google Scholar]
- 38.Lin W-C; Iversen L; Tu H-L; Rhodes C; Christensen SM; Iwig JS; Hansen SD; Huang WYC; Groves JT, H-Ras forms dimers on membrane surfaces via a protein–protein interface. Proceedings of the National Academy of Sciences 2014, 111 (8), 2996. [DOI] [PMC free article] [PubMed] [Google Scholar]
- 39.Xiang L; Chen K; Yan R; Li W; Xu K, Single-molecule displacement mapping unveils nanoscale heterogeneities in intracellular diffusivity. Nature Methods 2020, 17 (5), 524–530. [DOI] [PMC free article] [PubMed] [Google Scholar]
- 40.Taylor R; Mahmoodabadi R; Rauschenberger V; Giessl A; Schambony A; Sandoghdar V, Interferometric scattering microscopy reveals microsecond nanoscopic protein motion on a live cell membrane. Nature Photonics 2019, 13 (7), 480-+. [Google Scholar]
- 41.Battle C; Broedersz CP; Fakhri N; Geyer VF; Howard J; Schmidt CF; MacKintosh FC, Broken detailed balance at mesoscopic scales in active biological systems. Science 2016, 352 (6285), 604. [DOI] [PMC free article] [PubMed] [Google Scholar]
- 42.Zhang F; Guan Y; Yang Y; Hunt A; Wang S; Chen H-Y; Tao N, Optical Tracking of Nanometer-Scale Cellular Membrane Deformation Associated with Single Vesicle Release. ACS Sensors 2019, 4 (8), 2205–2212. [DOI] [PMC free article] [PubMed] [Google Scholar]
- 43.Ridley AJ; Schwartz MA; Burridge K; Firtel RA; Ginsberg MH; Borisy G; Parsons JT; Horwitz AR, Cell Migration: Integrating Signals from Front to Back. Science 2003, 302 (5651), 1704. [DOI] [PubMed] [Google Scholar]
- 44.Zhang P; Liu L; He Y; Chen X; Ma K; Wei D; Wang H; Shao Q, Composite layer based plasmon waveguide resonance for label-free biosensing with high figure of merit. Sensors and Actuators B-Chemical 2018, 272, 69–78. [Google Scholar]
- 45.Kuai Y; Chen J; Tang X; Xiang Y; Lu F; Kuang C; Xu L; Shen W; Cheng J; Gui H; Zou G; Wang P; Ming H; Liu J; Liu X; Lakowicz JR; Zhang D, Label-free surface-sensitive photonic microscopy with high spatial resolution using azimuthal rotation illumination. Science Advances 2019, 5 (3), eaav5335. [DOI] [PMC free article] [PubMed] [Google Scholar]
Associated Data
This section collects any data citations, data availability statements, or supplementary materials included in this article.
Supplementary Materials
Video S2: RBL-2H3 cell in the extracellular solution (290 mmol/kg).
Video S1: IgA molecule hits and stays (IgA molecule 1), and bind and unbind rapidly (IgA molecule 2) on the antibody modified surface.
Video S3: RBL-2H3 cell response when changing the immersion solution from extracellular solution (290 mmol/kg) to hypertonic solution (325 mmol/kg).
Video S4: RBL-2H3 cell response when changing immersion solution from extracellular solution (290 mmol/kg) to water (7 mmol/kg)
Video S5: RBL-2H3 cell response to IgE-mediated activation with temporal resolution of 0.5 s within 85 s.
Video S6: RBL-2H3 cell response to IgE-mediated activation with temporal resolution of 140 μs within 10 s.