Abstract
Objective:
To evaluate the diagnostic accuracy and repeatability of the visual assessment of the cervical vertebral maturation (CVM) stages.
Materials and Methods:
Ten operators underwent training sessions in visual assessment of CVM staging. Subsequently, they were asked to stage 72 cases equally divided into the six stages. Such assessment was repeated twice in two sessions (T1 and T2) 4 weeks apart. A reference standard for each case was created according to a cephalometric analysis of both the concavities and shapes of the cervical vertebrae.
Results:
The overall agreement with the reference standard was about 68% for both sessions and 76.9% for intrarater repeatability. The overall kappa coefficients with the reference standard were up to 0.86 for both sessions, and 0.88 for intrarater repeatability. Overall, disagreements one stage and twp stage apart were 23.5% (T1) and 5.1% (T2), respectively. Sensitivity ranged from 53.3% for CS5 (T1) to 99.9% for CS1 (T2), positive predictive values ranged from 52.4% for CS5 (T2) to 94.3% for CS6 (T1), and accuracy ranged from 83.6% for CS4 (T2) to 94.9% for CS1 (T1).
Conclusions:
Visual assessment of the CVM stages is accurate and repeatable to a satisfactory level. About one in three cases remain misclassified; disagreement is generally limited to one stage and is mostly seen in stages 4 and 5.
Keywords: Orthodontics, Cervical vertebrae, Diagnosis, Accuracy, Validation study
INTRODUCTION
When dealing with skeletal disharmonies, the precise identification of skeletal maturity, that is, the growth phase, with particular regard to the onset of the pubertal growth spurt, has major clinical implications in terms of treatment efficacy and efficiency.1,2 Several indices have been proposed to identify the skeletal maturation phases1,3–6 and among them is the cervical vertebral maturation (CVM) method initially proposed by Lamparski.7 The CVM method has been correlated with both the statural and the mandibular growth spurt,8,9 and even with levels of biomarkers of growth.10,11
However, two previous investigations12,13 reported that this methodology is not sufficiently repeatable to be used alone in assessing skeletal maturation. Moreover, even though raters participating in those studies were experienced orthodontists, the repeatability was reported to be only from low to good. In this regard, the impact of dedicated sessions of training on the repeatability of the CVM method has still to be evaluated. To the best of our knowledge, a study on the diagnostic accuracy, that is, agreement with a reference standard, of the visual assessment of the CVM stage is still lacking.
The present study was thus designed to address the following questions: I1) Is the visual assessment of the CVM stage accurate and repeatable? and (2) if disagreement is seen, how is this structured among the different stages? This study ultimately aims to verify whether the CVM method may be proposed as a reliable indicator of growth phase and used in routine clinical practice.
MATERIALS AND METHODS
Study Design
A total of 10 operators underwent training sessions in visual assessment of CVM staging using a series of cases analyzed cephalometrically (reference standard). Subsequently, they were asked to assign stage in a different set of cases at baseline (T1) and again after 4 weeks (T2). The outcomes of these sessions were compared with the reference standard (objective analysis) and for diagnostic accuracy.
This study included subjects who were seeking orthodontic treatment and who had never been treated. Signed informed consent was obtained from the parents of the subjects before they were included in the study, and the protocol was reviewed and approved by the local Ethical Committee of the University of Trieste. In particular, a lateral cephalogram was taken at the first clinical examination as part of the initial clinical recording. The following inclusion criteria were applied: (1) age between 7 and 18 years, (2) absence of anomalies of the vertebrae, (3) good general health and an absence of any nutritional problems, (4) no history of trauma at the cervical region or right hand, and (5) Caucasian ethnicity. Patients with lateral head films of low quality were excluded from the study. An initial sample of more than 200 subjects was screened to obtain a total of 132 subjects (73 girls and 59 boys) for the study. These 132 subjects were equally divided into the six CVM stages according to the cephalometric analysis. Within each CVM stage, 10 cases (total, 60 cases) were used for the training sessions; the remaining 12 cases per CVM stage (total, 72 cases) were used for the diagnostic accuracy and reproducibility part of the study. In particular, these 132 cases were selected according to the outcome of the cephalometric analysis (reference standard, see the section that follows). All the lateral cephalograms were cropped to include cervical vertebrae C2 to C4 and to eliminate any additional information.
Raters and Training Sessions
A total of 10 raters were equally derived from two different universities involved in the study. Among these raters were six postgraduate students, two postdoctoral students, one assistant professor, and one undergraduate student. None of the authors were among the raters. An expert researcher in the CVM method instructed the raters. Each rater, independently of his or her experience in orthodontics underwent at least two training sessions in the CVM staging. In particular, all the raters participated together at the first session, where the series of 60 cases was used. After a detailed explanation of the rules to be followed for assigning CVM stages, each rater had to assign a stage to each of the traced cases visually and blinded. The followed sequence was based on identification of concavities at C2, C3, and C4 and, subsequently, assignment of shapes of C3 and C4. After a first assignment, the raters could see the superimposed cervical tracings and the numeric data of the cephalometric analysis. Any conflict was discussed immediately. At the end of this session, each rater had the files with images and numeric data. After 4–6 weeks the raters underwent a second training session within either university under the supervision of two different instructors, and training was considered successful only if at least 75% of the cases were correctly identified. Those raters failing to reach this result underwent a further session of training 2 weeks later.
CVM Method
The most recent CVM method, as proposed by Baccetti et al.,1 including six stages: two prepubertal (stages 1 and 2), two pubertal (stages 3 and 4), and two postpubertal (stages 5 and 6) was used. When apparent disagreement was seen between the presence of concavities at the lower borders and the shapes of the cervical vertebrae, the most mature stage of either the concavities or shape was assigned.
Reference Standard (Objective Analysis)
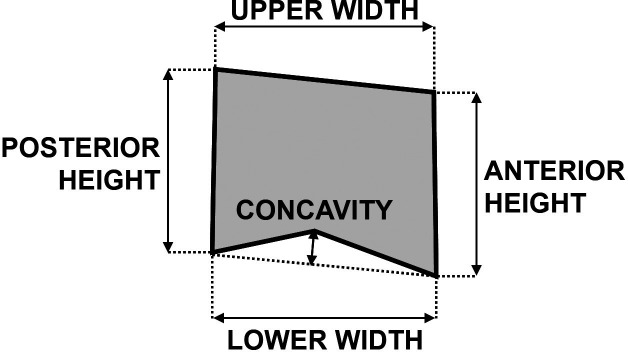
A customized digitization regimen and analysis with cephalometric software (Viewbox, version 3.0, dHAL Software, Kifissia, Greece) was used for all cephalograms examined in this study. This analysis included measurements generated from 21 landmark markers, with 11 derived linear variables (Figure 1). Among these derived variables, three were for concavities of lower borders of C2-C4 and eight related to the anterior and posterior heights and upper and lower widths for the C3 and C4. Herein the threshold of 1.0 mm1 was used to assess the presence of concavity. Similarly, assessment of the shape of the vertebral bodies of C3 and C4 was defined according to the height-width difference calculated with the following formula: [(posterior height + anterior height)/2] − [(upper width + lower width)/2]. Clustering was as follows: values below −1.0 mm assessed a trapezoid or rectangular horizontal shape, values between −1.0 mm and +1.0 mm assessed a square shape, and values above +1.0 mm assessed a rectangular vertical shape. All cephalograms were traced by an operator and checked for accuracy by a second investigator. Full method error was quantified though the method of moments variance estimator13 calculated on 20 pairs of recordings randomly selected and expressed as mean (95% confidence interval [CI]).
Figure 1.
Diagram of the cephalometric measurements with derived linear variables. Only a vertebral body is shown for clarity. In cervical vertebra 2, only concavity was measured.
Statistical Analysis
The percentages of agreement between each rater and the reference standard (within each session) were calculated, along with the percentages of intrarater repeatability between the two sessions. To determine the degree of agreement between each rater and the reference standard (within each session), along with the degree of repeatability between the two sessions and within each rater, a weighted kappa coefficient was used and presented as mean and 95% CI. This kappa coefficient was weighted linearly as this makes the coefficient less sensitive to the number of categories or stages.14 The kappa coefficient ranges from zero for no agreement to 1 for perfect agreement, and the following standards for strength of agreement for the kappa coefficient have proposed: 0.01–0.20, slight; 0.21–0.40, fair; 0.41–0.60, moderate; 0.61–0.80, substantial; and >0.80 almost perfect.15
Within each session, interrater agreement was assessed by the Kendall's W coefficient of concordance. Moreover, the mean percentages of disagreement one stage, two stage and three stage apart were calculated according to each CVM stage for both sessions. Within each CVM stage, a more comprehensive diagnostic performance analysis was performed, including sensitivity, specificity, positive and negative predictive values, and accuracy,15 and presented as mean and 95% CI. Finally, when calculating the overall means for these parameters, including the weighted kappa values, the paired nature of that data was taken into account.
SPSS software 13.0 (SPSS Inc, Chicago, Ill), MedCalc software 12.3.3.0 (MedCalc Software, Mariakerke, Belgium), and Comprehensive Meta-Analysis, version 2 (Biostat, Englewood, NJ) were used to perform the statistical analyses. A P value <.05 was used for rejection of the null hypothesis.
RESULTS
The final group of 72 subjects used for the diagnostic accuracy and reproducibility analyses was composed of 37 girls and 35 boys (mean age, 12.9 ± 2.6 years; range, 7.3–17.9 years). The method error for the cephalometric parameters as mean (95% CI) were between 0.21 mm (0.10–0.36) and 0.26 mm (0.12–0.43) for the concavities of C3 and C2, respectively, and between 0.22 mm (0.11–0.37) and 0.49 mm (0.23–0.81) for the lower widths of C3 and C4, respectively.
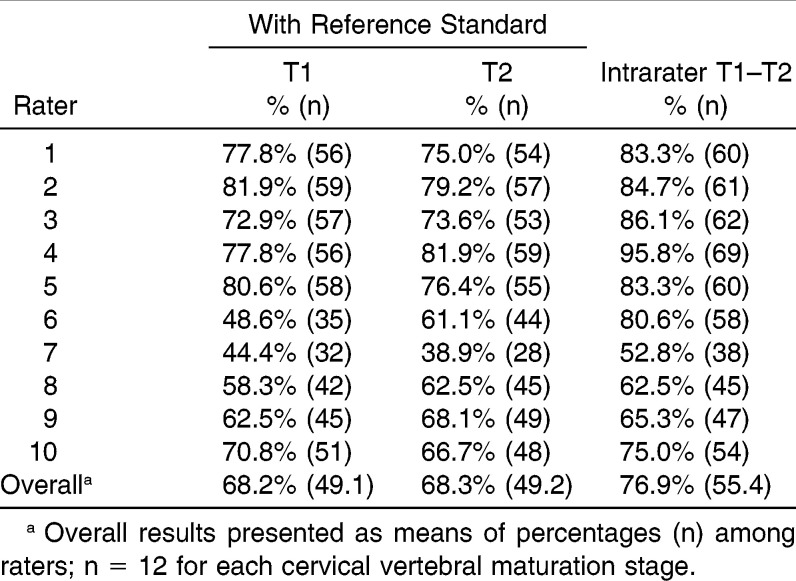
The percentage of full agreement between each rater and the reference standard and within each rater is summarized in Table 1. The full agreement with the reference standard for each rater was generally similar between the two recording sessions, with values ranging from 38.9% to 81.9%. Intrarater agreements ranged from 52.8% to 95.8%. The overall agreement with the reference standard was about 68% for both sessions and 76.9% for intrarater comparisons.
Table 1.
Percentages of Agreement with the Reference Standard According to Recording Session (T1 and T2) and for Intrarater Agreement Between the Recording Sessions for Each Rater
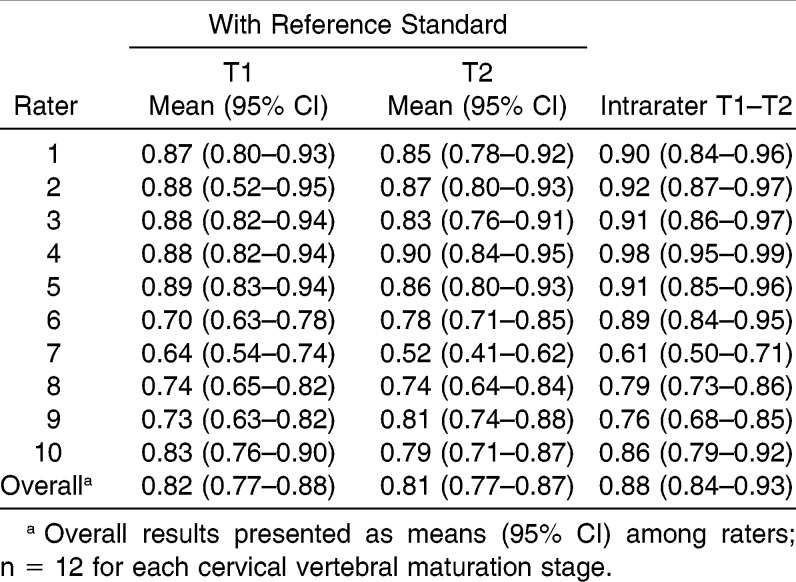
The weighted kappa coefficients between each rater and the reference standard and within each rater are summarized in Table 2. The kappa coefficients as mean (95% CI) with the reference standard for each rater was generally similar between the two recording sessions, with values ranging from 0.52 (0.41–0.62) to 0.90 (0.84–0.95). The overall kappa coefficients of the whole group of raters with the reference standard were 0.82 (0.77–0.88) and 0.81 (0.77–0.87) for the T1 and T2 session, respectively, and 0.88 (0.84–0.93) for intrarater repeatability.
Table 2.
Weighted Kappa Coefficients for Interrater Agreement with the Reference Standard According to Recording Session (T1 and T2) and for Intrarater Agreement Between the Recording Sessions for Each Rater
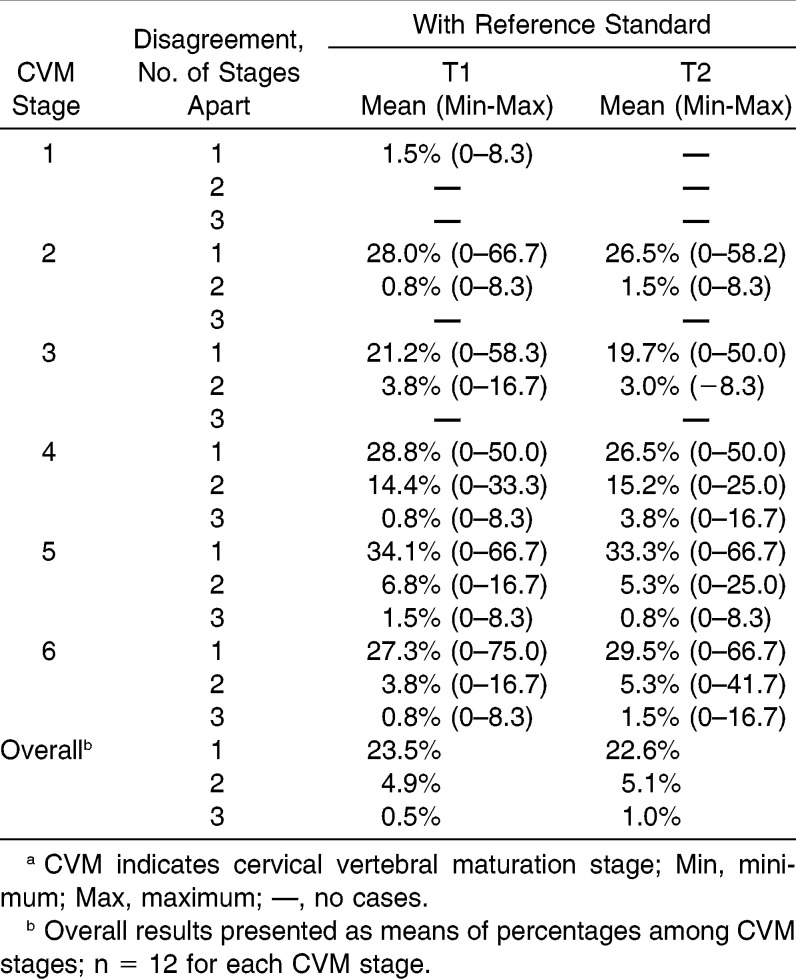
The Kendall's W coefficients of concordance for interrater agreement were 0.90 and 0.91 (P < .001) for the T1 and T2 sessions, respectively. The percentages of disagreement with the reference standard and for the whole group of raters, according to each CVM stage, are summarized in Table 3. These disagreements were generally similar between the two recording sessions, with the CS1 and CS5 showing the lowest and greater disagreements, respectively. Moreover, CS1 showed disagreements only one stage apart (up to 1.5%), CS2 and CS3 showed disagreements up to two stages apart (up to 3.8%, CS3, T1), and CS4 to CS5 showed disagreements up to three stages apart (up to 3.8%, CS4, T2).
Table 3.
Percentages of Cervical Stage Disagreement with the Reference Standard According to Recording Session (T1 and T2) for the Whole Group of Ratersa
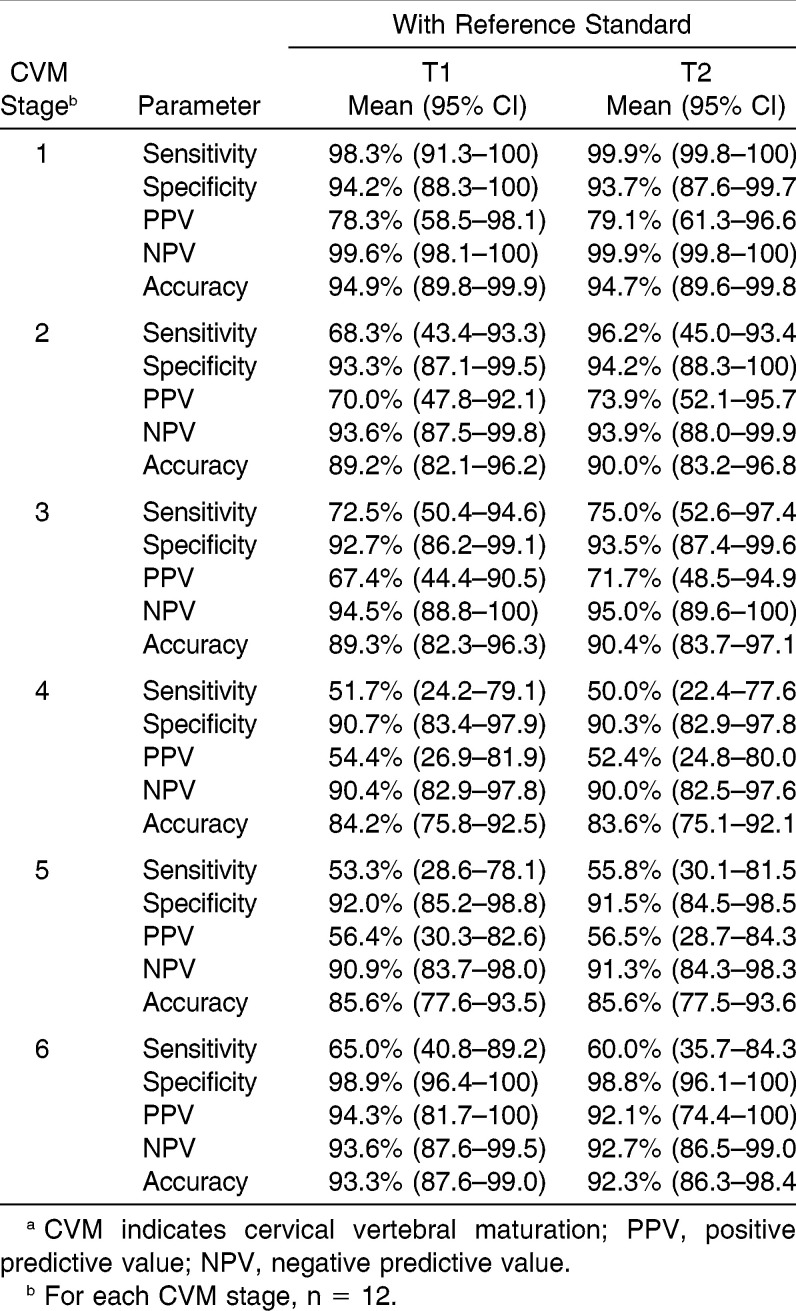
The full diagnostic accuracy analysis for the whole group of raters is summarized in Table 4. All the diagnostic parameters were generally similar between the two recording sessions. In particular, sensitivity ranged from 50.0% for CS4 (T2) to 99.9% for CS1 (T2), specificity values ranged from 90.3% for CS4 (T2) to 98.9% for CS6 (T1), positive predictive values ranged from 52.4% for CS4 (T2) to 94.3% for CS6 (T1), negative predictive values ranged from 99.9% for CS1 (T2) to 90.0% for CS4 (T2), and accuracy ranged from 83.6% for CS4 (T2) to 94.9% for CS1 (T1).
Table 4.
Diagnostic Accuracy Parameters for Each Cervical Vertebral Maturation (CVM) Stage According to Recording session (T1 and T2) for the Whole Group of Ratersa
DISCUSSION
The present study analyzed the diagnostic accuracy and repeatability of the CVM method in a heterogeneous group of 10 raters previously subjected to at least two sessions of training.
In previous investigations12,13 each observer was trained in the CVM method using only exact figures and legends reported in literature.1 However, descriptive pictures were usually simplified versions of the full range of possibilities, and this is not a substitute for having expert instructors teach all the skills needed to become confident with any procedure. Moreover, these investigations did not assess whether the operators' training was successful.
Because this is the first study evaluating the diagnostic accuracy of the CVM method by using a standard reference, comparisons with previous data are not possible. An overall satisfactorily diagnostic accuracy was seen in the present study, even though difference in terms of percentages of agreement and kappa values were seen between the raters from the two centers at both clinical sessions. This may be explained by the different degree of training in the visual assignment of the CVM stage. Generally, the raters yielding greater weighted kappa values were from the university (raters 1 to 5, Tables 1 and 2) in which relevant training in CVM staging is part of the curriculum and where the research team has been using this method for several years. A similar behavior was seen for the intrarater repeatability. This reinforces the concept that regular training is necessary to obtain high diagnostic accuracy and intrarater repeatability in the visual assignment of the CVM stages.
Because CVM staging is based on an ordinal scale rather than being a dichotomous assessment, the number of stages apart in case of disagreement is also important. In the present study, most of the disagreements were one stage apart (Table 3). Apart from the percentages of agreement and kappa values, satisfactory diagnostic accuracy was seen; accuracy values were above 83.6% for each CVM stage (Table 4). However, when dealing with several possible clusters (ie, six CVM stages), important diagnostic parameters are the sensitivity (when CVM stages are equally distributed) and positive predictive value; these indicate a given rater's capability in identifying any CVM stage, irrespective of the number of true negative cases belonging to the other stages. The least satisfactory diagnostic accuracy was seen for the CVM stages 4 and 5, where the greatest sensitivity was low as 55.8% (stage 5, T2) and positive predictive values were as low as 52.4% (stage 4, T2). The fine morphologic transitions between two following stages may be behind such evidence. This is particularly true of the visual assessment of the shape of a vertebral body. Interestingly, CVM stage 4 is based on both initial concavity on C4 and initial appearance of a square shape on either C3 or C4. Previous evidence showed that intrarater repeatability was much lower in assessing the shape of the bodies of C3 and C4 compared with that obtained in assessing the concavities of C2–C4.13
When considering intrarater repeatability between the two sessions, the overall percentage of agreement was 76.9% (Table 1). Previous studies using CVM methods, although not focused on repeatability, reported very high percentages of agreement8,16. On the contrary, in the previous study of CVM method repeatability,12 an average of 62% was reported. The reason for the high agreements seen in most studies has been explained by the use of third-person tracings to stage the lateral cephalograms, or because the authors of these studies were also raters themselves.12
Clinical Implications
According to the present results, the visual assessment of the CVM stages appears to be accurate and repeatable as long as training is followed. This accuracy appears independent of the rater's own experience in orthodontics. However, assessment of CVM stages 4 and 5 requires more careful evaluation to avoid unreliable diagnosis and treatment plans. Any case in which CVM stage 4 is misclassified as stage 5, or vice versa, may thus miss the opportunity for proper treatment. Therefore, when the visual assessment of the CVM staging is uncertain (especially for stages 4 and 5), a cephalometric analysis or the use of a further morphologic indicator may be indicated.
CONCLUSIONS
When specific training is provided along with precise guidelines in assessing visually each stage, the CVM method proves to be accurate and repeatable to a satisfactory level
About one of three patients remain misclassified, though disagreement is generally only one stage apart and is mostly seen in stages 4 and 5.
ACKNOWLEDGMENT
The authors are deeply grateful to all the raters involved in the study.
REFERENCES
- 1.Baccetti T, Franchi L, McNamara JA., Jr The cervical vertebral maturation (CVM) method for the assessment of optimal treatment timing in dentofacial orthopedics. Semin Orthod. 2005;11:119–129. [Google Scholar]
- 2.Petrovic A, Stutzmann J, Lavergne J. Mechanism of craniofacial growth and modus operandi of functional appliances: a cell-level and cybernetic approach to orthodontic decision making. In: Carlson DS, editor. Craniofacial Growth Theory and Orthodontic Treatment Monograph 23 Craniofacial Growth Series. Ann Arbor: Center for Human Growth and Development, University of Michigan; 1990. pp. 13–74. [Google Scholar]
- 3.Fishman LS. Radiographic evaluation of skeletal maturation. A clinically oriented method based on hand-wrist films. Angle Orthod. 1982;52:88–112. doi: 10.1043/0003-3219(1982)052<0088:REOSM>2.0.CO;2. [DOI] [PubMed] [Google Scholar]
- 4.Greulich WW, Pyle SI. Radiographic atlas of skeletal development of the hand and wrist 2nd ed. Stanford, CA: Stanford University Press; 1959. [Google Scholar]
- 5.Hassel B, Farman AG. Skeletal maturation evaluation using cervical vertebrae. Am J Orthod Dentofacial Orthop. 1995;107:58–66. doi: 10.1016/s0889-5406(95)70157-5. [DOI] [PubMed] [Google Scholar]
- 6.Perinetti G, Baccetti T, Contardo L, Di Lenarda R. Gingival crevicular fluid alkaline phosphatase activity as a non-invasive biomarker of skeletal maturation. Orthod Craniofac Res. 2011;14:44–50. doi: 10.1111/j.1601-6343.2010.01506.x. [DOI] [PubMed] [Google Scholar]
- 7.Lamparski DG. Skeletal Age Assessment Utilizing Cervical Vertebrae [dissertation] Pittsburgh, PA: University of Pittsburgh; 1972. [Google Scholar]
- 8.Franchi L, Baccetti T, McNamara JA., Jr Mandibular growth as related to cervical vertebral maturation and body height. Am J Orthod Dentofacial Orthop. 2000;118:335–340. doi: 10.1067/mod.2000.107009. [DOI] [PubMed] [Google Scholar]
- 9.Soegiharto BM, Moles DR, Cunningham SJ. Discriminatory ability of the skeletal maturation index and the cervical vertebrae maturation index in detecting peak pubertal growth in Indonesian and white subjects with receiver operating characteristics analysis. Am J Orthod Dentofacial Orthop. 2008;134:227–237. doi: 10.1016/j.ajodo.2006.09.062. [DOI] [PubMed] [Google Scholar]
- 10.Masoud M, Masoud I, Kent RL, Jr, Gowharji N, Cohen LE. Assessing skeletal maturity by using blood spot insulin-like growth factor I (IGF-I) testing. Am J Orthod Dentofacial Orthop. 2008;134:209–216. doi: 10.1016/j.ajodo.2006.09.063. [DOI] [PubMed] [Google Scholar]
- 11.Perinetti G, Franchi L, Castaldo A, Contardo L. Gingival crevicular fluid protein content and alkaline phosphatase activity in relation to pubertal growth phase. Angle Orthod. 2012;82:1047–1052. doi: 10.2319/123111-806.1. [DOI] [PMC free article] [PubMed] [Google Scholar]
- 12.Gabriel DB, Southard KA, Qian F, Marshall SD, Franciscus RG, Southard TE. Cervical vertebrae maturation method: poor reproducibility. Am J Orthod Dentofacial Orthop. 2009;136:478 e1–e7; discussion 78–80. doi: 10.1016/j.ajodo.2007.08.028. [DOI] [PubMed] [Google Scholar]
- 13.Nestman TS, Marshall SD, Qian F, Holton N, Franciscus RG, Southard TE. Cervical vertebrae maturation method morphologic criteria: poor reproducibility. Am J Orthod Dentofacial Orthop. 2011;140:182–188. doi: 10.1016/j.ajodo.2011.04.013. [DOI] [PubMed] [Google Scholar]
- 14.Brenner H, Kliebsch U. Dependence of weighted kappa coefficients on the number of categories. Epidemiology. 1996;7:199–202. doi: 10.1097/00001648-199603000-00016. [DOI] [PubMed] [Google Scholar]
- 15.Greenhalgh T. How to read a paper. Papers that report diagnostic or screening tests. BMJ. 1997;315:540–543. doi: 10.1136/bmj.315.7107.540. [DOI] [PMC free article] [PubMed] [Google Scholar]
- 16.Ozer T, Kama JD, Ozer SY. A practical method for determining pubertal growth spurt. Am J Orthod Dentofacial Orthop. 2006;130:131.e1–131.e6. doi: 10.1016/j.ajodo.2006.01.019. [DOI] [PubMed] [Google Scholar]


