Abstract
Purpose
Imaging tumor metabolism in vivo using hyperpolarized [1‐13C]pyruvate is a promising technique for detecting disease, monitoring disease progression, and assessing treatment response. However, the transient nature of the hyperpolarization and its depletion following excitation limits the available time for imaging. We describe here a single‐shot multi spin echo sequence, which improves on previously reported sequences, with a shorter readout time, isotropic point spread function (PSF), and better signal‐to‐noise ratio.
Methods
The sequence uses numerically optimized spectrally selective excitation pulses set to the resonant frequencies of pyruvate and lactate and a hyperbolic secant adiabatic refocusing pulse, all applied in the absence of slice selection gradients. The excitation pulses were designed to be resistant to the effects of B0 and B1 field inhomogeneity. The gradient readout uses a 3D cone trajectory composed of 13 cones, all fully refocused and distributed among 7 spin echoes. The maximal gradient amplitude and slew rate were set to 4 G/cm and 20 G/cm/ms, respectively, to demonstrate the feasibility of clinical translation.
Results
The pulse sequence gave an isotropic PSF of 2.8 mm. The excitation profiles of the optimized pulses closely matched simulations and a 46.10 ± 0.04% gain in image SNR was observed compared to a conventional Shinnar–Le Roux excitation pulse. The sequence was demonstrated with dynamic imaging of hyperpolarized [1‐13C]pyruvate and [1‐13C]lactate in vivo.
Conclusion
The pulse sequence was capable of dynamic imaging of hyperpolarized 13C labeled metabolites in vivo with relatively high spatial and temporal resolution and immunity to system imperfections.
Keywords: hyperpolarized, imaging, lactate, pyruvate, tumor
1. INTRODUCTION
Dynamic nuclear spin polarization of isotopically labeled metabolites has proven to be a promising technique for dynamic magnetic resonance imaging measurements of metabolism in vivo. 1 , 2 The principal limitation of the technique is the short lifetime of the spin hyperpolarization, which means that the signal is often observable for only a few minutes, requiring the use of very fast imaging methods. 3 , 4 [1‐13C]Pyruvate has been the most intensively investigated metabolite because of its central role in metabolism, the ease with which it can be hyperpolarized and its relatively fast membrane transport and subsequent metabolism when compared to the lifetime of the polarization. 5 Hyperpolarized [1‐13C]pyruvate has been widely used in oncology, where imaging exchange of hyperpolarized 13C label between injected [1‐13C]pyruvate and the endogenous tumor lactate pool has been used to assess tumor grade, 6 disease progression, 7 and treatment response. 3 , 8 In general, increasing grade and progression are associated with an increase in lactate labeling and treatment response with a decrease. As well as being fast the imaging pulse sequence must also make economical use of the polarization because each excitation pulse results in depletion of the polarization, in addition to that due to T 1‐dependent decay, degrading the signal‐to‐noise ratio (SNR) and decreasing the time window over which metabolism of the labelled substrate can be monitored. High‐resolution 3D volumetric imaging is desirable in order to fully assess tumor heterogeneity and treatment response, although the choice between a 2D or 3D k‐space acquisition strategy is not straightforward. 9 Numerous pulse sequences have been proposed to address these issues (reviewed in 10 ). Early studies used 2D chemical shift imaging (CSI) sequences, 11 , 12 which had relatively low spatial encoding efficiency, made uneconomical use of the hyperpolarization, and were not dynamically resolved. Multiband variable flip angle excitation pulses were introduced to better preserve the polarization. Larson et al used spectral‐spatial (SpSp) pulses, which can be used to selectively excite individual resonances in the slice of interest, for dynamic CSI measurements in vivo. 13 These pulses have since been widely used in conjunction with a variety of different readout strategies. Lau et al imaged hyperpolarized 13C‐labeled pyruvate and bicarbonate in the heart with a rapid multislice sequence 14 and recently used a simultaneous multislice sequence for accelerated imaging over a larger field of view (FOV). 15 In the case of 3D acquisition strategies Miller et al introduced a 3D echo‐planar imaging sequence 16 where the temporal resolution was traded for z‐resolution. In order to improve the temporal resolution of 3D acquisitions Wang et al recently proposed metabolite selective single‐shot spin echo‐based sequences 17 , 18 whereas Chen et al used a 3D pulse sequence with echo planar spectroscopic imaging (EPSI) readout and compressed‐sensing (CS). 19 The advantage of imaging approaches where a specific resonance is excited selectively is that they are faster than EPSI. The disadvantage is that they require prior knowledge of the metabolite frequencies and are sensitive to nonuniform magnetic fields, which makes radiofrequency (RF) pulse design more challenging. 10 Balanced steady state free precession imaging (bSSFP) can give higher SNR and efforts have been made to overcome the inherent frequency profile problems of this sequence. 20 , 21 , 22 , 23
An advantage of using SpSp pulses in the case of the hyperpolarized [1‐13C]pyruvate experiment is that a small flip angle pulse can be used to excite the intense pyruvate resonance, thus preserving polarization, while a larger flip angle pulse can be used on the less intense lactate resonance to improve SNR. A limitation of SpSp pulses is that the frequency profile of the pulses can lead to unwanted excitation in the stopband, resulting in cross‐contamination of the images and depletion of stored polarization. We have developed a single‐shot multi echo sequence with a 3D cone gradient readout, which avoids the need for a spatially selective excitation pulse when the imaging FOV exceeds the sensitive volume of the receiver coil. Such an approach, using a minimum phase, spectrally selective, and spatially nonselective RF pulse has been described previously. 24 Relaxation of the requirement to be spatially selective enables a better optimized design of the pulse’s spectral profile and tolerance of B1 inhomogeneity. Although implemented on a high‐field (7T) preclinical scanner, the feasibility of implementing the sequence on a clinical scanner was demonstrated using lower gradient strengths and slew rates, even though this resulted in a much longer readout time than would be required clinically due to the smaller FOV and higher resolution in the preclinical experiment.
2. METHODS
2.1. Tumor model
EL4, murine lymphoma cells (American Type Culture Collection) were cultured in RPMI medium (Life Technologies, Carlsbad, California) containing 2 mM L‐glutamine and 10% fetal bovine serum (FBS) (Gibco/Thermo Fisher Scientific, Waltham, Massachusetts). Cells (viability >95%) were washed, resuspended in 0.2 ml phosphate‐buffered saline (PBS), and injected subcutaneously (5 × 10⁶) into the left flank of 8‐ to 12‐week‐old female C57BL/6J mice (Charles River Laboratories, Wilmington, Massachusetts). Tumors were allowed to develop for 10 days before imaging. All animal experiments were carried out in compliance with a project and personal licenses issued by the Home Office, UK and approved by the Cancer Research UK, Cambridge Institute Animal Welfare and Ethical Review Body.
2.2. Hyperpolarized [1‐13C]pyruvate
The sample contained 44 mg [1‐13C]pyruvic acid (CIL, MA), 15 mM OX063 (GE Healthcare, Amersham, UK), and 1.4 mM gadoterate meglumine (Dotarem; Guerbet, Roissy, France) and was hyperpolarized using a Hypersense Polarizer (Oxford Instruments, Abingdon, UK) at 1.2 K in a magnetic field of 3.35 Tesla (T), with microwave irradiation at 94.112 GHz. The sample was then rapidly dissolved in 6 mL buffer containing 40 mM HEPES, 94 mM NaOH, 30 mM NaCl 100 mg/L EDTA heated to 180 °C and pressurized to 10 bar.
2.3. MRI scanner
Experiments were performed at 7T (Agilent, Palo Alto, California). The maximum gradient strength in the pulse sequence was set to 4 G/cm and the slew rate to 20 G/cm/ms (maximum available values on the scanner: 40 G/cm and 200 G/cm/ms). A 42 mm diameter birdcage volume coil was used for 1H transmit and receive and a similar volume coil for 13C transmit. A 20 mm diameter surface coil was used for 13C receive (Rapid Biomedical GMBH, Rimpar, Germany).
2.4. Excitation pulse design
Optimized [1‐13C]lactate and [1‐13C]pyruvate excitation pulses were designed to give 45° and 5° flip angles respectively, in the passband without affecting the other three observed resonances. Slice selection was unnecessary because the 3D cone gradient readout gave a FOV that was larger than the sensitive volume of the surface coil receiver. Optimization employed a conventional Shinnar–Le Roux (SLR) design, which was then fine‐tuned using the built‐in fminsearch solver in MATLAB (The Mathworks, Natick, Massachusetts), which was used to adjust the amplitude and phase of the individual pulse points. The cost function (Equation 1) of the optimization consisted of four regions of interest, which were ±70 Hz (±0.93 ppm) of the lactate, pyruvate hydrate, and alanine resonances. Because pyruvate travels initially as a bolus throughout the body of the animals its signal can be far off‐resonance. Therefore, for pyruvate the region of interest was ±200 Hz (±2.65 ppm). The ideal frequency profile has the prescribed amplitude in the ±70 Hz passband around the lactate resonance for the lactate pulse and the ±200 Hz passband around the pyruvate resonance for the pyruvate pulse and zero in the other three spectral regions. A B0 field map acquired from an EL4 tumor using the same transmit and receiver coils is shown in reference. 18 The potential variation in the lactate, pyruvate hydrate, alanine, and pyruvate resonance frequencies (less than ±15 Hz) resulting from B0 field inhomogeneity is well below the width of the spectral regions of interest. The width of these regions can also compensate for potential miscalibration of the 13C resonance frequency. Outside of these regions the pulse profile can be arbitrary. Furthermore, the pulse was designed to give constant phase in the passband immediately after the pulse in order to increase signal in the presence of large B0 and B1 field inhomogeneity and to minimize the achievable echo time. This is similar to a minimal phase or self‐refocusing SLR pulse. 25 Deviation between the ideal and observed excitation profiles was quantified by means of residual sum of squares, evaluated in the four frequency bands of interest. To avoid too high pulse amplitudes a penalty term was added to the cost function to constrain the amplitudes to be less than 1.5 G
| (1) |
and denote the desired and simulated frequency profiles, respectively. and represent weighted box functions for the four spectral regions of interest. represents the desired amplitude, while is the desired phase. The weights could be chosen to be higher for the pyruvate and lactate frequency bands, reflecting the greater importance of frequency selectivity for these resonances. However, this proved to be unnecessary and all the weights were set to unity in the optimization. is the penalty term if the maximum amplitude of the pulse exceeds . and were used in the design process. The resulting pulse performs similarly to an adiabatic SLR pulse 26 but with better spectral selectivity for the design B1 amplitudes (from half to double the nominal B1 value) and lacks both the quadratic and linear phase variations that result from differences in frequency offset and B1 field strength, respectively. A further advantage of the pulse described here is that the spins are in phase at the end of the pulse, which facilitates echo timing. However, the pulse is less tolerant of B1 inhomogeneity than the adiabatic SLR pulse. The lactate and pyruvate pulse trajectories together with those for a linear phase SLR pulse are shown in Figure 1. The excitation profiles of the optimized lactate pulse and the corresponding SLR pulse are shown in Figure 2. To address B1 inhomogeneity the cost function was evaluated over an interval of pulse amplitudes (from half to double the nominal B1 value) and the final cost was the sum of the cost values at the sampled B1 values over this interval. Figure 2A shows that outside this B1 interval (0.5‐2) there is a loss of frequency selectivity, which is not the case for the SLR pulse (Figure 2G). This is an inevitable consequence of the numerical pulse optimization and means that the pulse needs to be redesigned if tolerance to B1 inhomogeneity over a different B1 interval is required. An additional constraint is imposed by the performance of the transmitter amplifier. Figure 1C,D show that the numerically optimized pulses require rapid changes in amplifier output. We found that it was important to include a smoothing function (we used the smooth() function in MATLAB with a span of 9) in each iteration of the numerical optimizer and evaluated the performance of the smoothed waveform in the cost function. Without smoothing we observed a greater discrepancy between the expected and observed pulse performance with increasing pulse power, which we assume reflects a failure of the amplifier to keep pace with requested changes in transmitter power.
FIGURE 1.
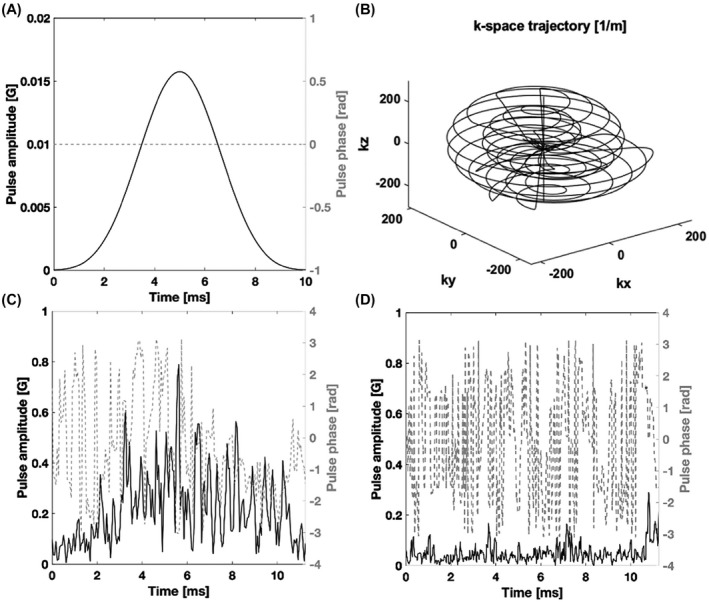
A, The amplitude (black line) and phase (gray dashed line) of the 10 ms linear phase Shinnar–Le Roux pulse. B, The 3D cones k‐space trajectory. C, The amplitude (black line) and phase (gray dashed line) of the optimized lactate pulse. D, The amplitude (black line) and phase (gray dashed line) of the optimized pyruvate pulse
FIGURE 2.
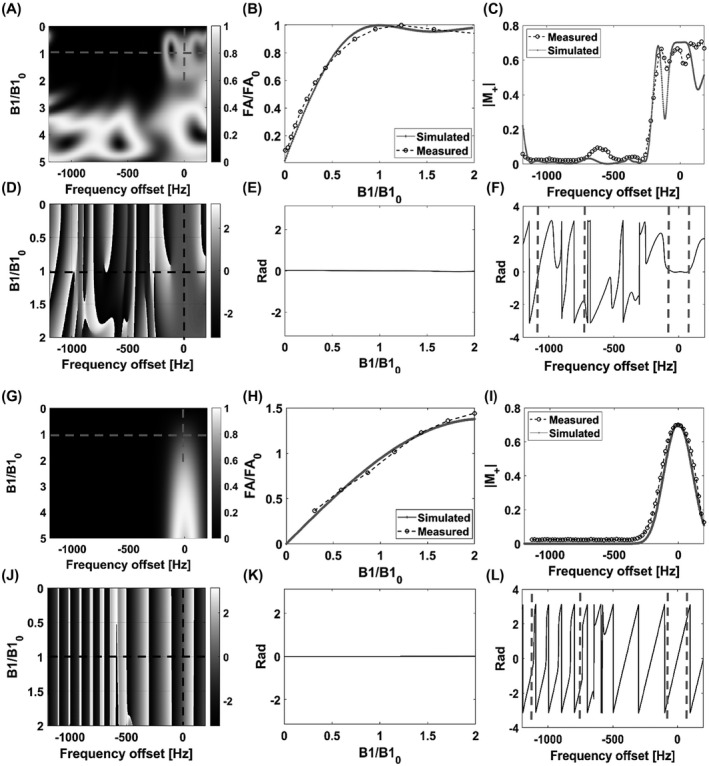
A, Theoretical transverse magnetization generated by the optimized lactate pulse for a range of B1 amplitudes relative to the nominal set value (B10). The nominal set value is the peak amplitude, which for the lactate pulse was 0.79 G. The pulse was designed to give a 45° flip angle (FA0) at 0.5‐2 relative B1 amplitudes ±70 Hz of the lactate resonance frequency and a 0° flip angle ±70 Hz of the pyruvate‐hydrate and alanine resonances and ±200 Hz of the pyruvate resonance. B, Measured and theoretical flip‐angles relative to the design value (FA0) at 0 Hz frequency offset as a function of B1 amplitude relative to the nominal set value (B10). Measurements were made on a 5 M thermally polarized [1‐13C]lactate phantom. C, Measured and theoretical transverse magnetization at the set nominal B1 value as a function of frequency offset. D, Theoretical signal phase profile for the optimized excitation pulse as a function of frequency offset and relative B1 amplitude. E, Theoretical signal phase at 0 Hz frequency offset as a function of relative B1 amplitude. F, Theoretical signal phase at the set nominal B1 amplitude plotted against frequency offset. The gray dashed lines indicate the spectral regions of interest for pyruvate (centered around −916 Hz) and lactate (centered around 0 Hz). G‐L, The corresponding plots for the standard SLR pulse
The final optimized pulses were robust to both B0 and B1 inhomogeneity over the desired B1 interval, excite only the lactate or pyruvate resonances, and give high signal due to the constant phase in the passbands. The pulses were composed of 402 points, duration 11.256 ms, which is an integer multiple of the 4 μs sampling time in order to avoid interpolation. The peak B1 was 0.79 G for the lactate pulse and 0.29 G for the pyruvate pulse.
2.5. Pulse sequence
The pulse sequence acquires a spherical k‐space (Figure 1) composed of 13 cone segments. 27 each fully refocused with time‐optimal rewinders and distributed among 7 spin echoes. At each echo a pair of identical cones are sampled in decreasing order with respect to cone angle (ie, the 1st and 13th cones at the 7th echo, 2nd and 12th at the 6th echo etc.). The seventh cone is sampled twice at the first echo and the signal averaged to increase the SNR (Figure 3). The first cone of each pair is time reversed, going first to the edge of k‐space and then back to the center, whereas the second cone travels from the center to the edge so that the central part of k‐space is sampled at the peak of the echo. The first cone is similar to an in‐spiral readout and the second to an out‐spiral readout. The start point for the cones were rotated linearly around the symmetry axis (kz) so that an analytical density pre‐compensation could be used. 27 The sampled k‐space was gridded to a 32 × 32 × 32 3D Cartesian grid using a Kaiser‐Bessel function with density post‐compensation. The final image was 16 × 16 × 16 resulting in a nominal isotropic resolution and FOV of 2 mm and 3.2 cm, respectively.
FIGURE 3.
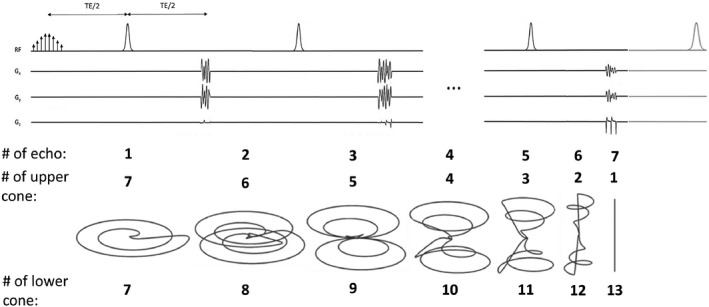
The pulse sequence starts with the optimized excitation pulse, without a slice selection gradient, and contains 7 unpaired adiabatic refocusing pulses to generate 7 spin echoes and an optional eighth adiabatic pulse at the end of the sequence that returns the remaining z magnetization back to the +z‐direction. At each echo a pair of two identical cones were acquired in decreasing order with respect to cone angle. The fine structure of the first cone is not visible due to the plot linewidth. The sequence takes 165 ms
Adiabatic pulses with a hyperbolic secant profile were used to generate the spin echoes. The pulses were 10 ms long and designed to have a bandwidth of 10 kHz and to achieve >99.9% inversion over a frequency band of ±4 kHz at a B1 field strength between 1 to 64 Gauss. To avoid the quadratic phase imparted by these pulses no slice selection gradients were applied. 17 In order to demonstrate the feasibility of clinical translation the gradient trajectory for the readout, which took 78.612 ms, was designed with maximal gradient amplitude and slew‐rate of 4 G/cm and 20 G/cm/ms, respectively. The k‐space trajectory measurement was performed according to. 28
2.6. Phantom imaging
The pulse sequence was tested on a cylindrical phantom (7 mm inner‐diameter) filled with thermally polarized 5 M [1‐13C]lactate, placed in the magnet isocenter with the long axis of the phantom parallel with the z‐axis. The performance of the optimized pulse for lactate was compared to the original SLR design with respect to SNR. T 2‐weighted proton images were acquired with a fast spin echo (FSE) sequence, to provide a positional reference, with a FOV of 32 mm, matrix size of 128 × 128 and 16 slices covering 32 mm in the z‐direction to maintain the same isotropic FOV as the 13C images.
2.7. Dynamic imaging in vivo
Interleaved pyruvate and lactate images were acquired for 60 s by alternately exciting and imaging the individual metabolites, with a repetition time of 1 s, resulting in a time resolution of 2 s per metabolite. Pyruvate image acquisition was initiated 10 s after the start of hyperpolarized [1‐13C]pyruvate injection (which finished 3‐5 seconds after the start of image acquisition) in order to allow sufficient time for conversion of some of the labeled pyruvate into lactate. Flip‐angles were calibrated on the lactate phantom. The carrier frequencies of the excitation pulses were calculated from the measured water proton frequency, based on prior measurements of the [1‐13C]lactate, [1‐13C]pyruvate and water proton resonance frequencies. 18 The [1‐13C]pyruvate resonance frequency was at −916 Hz from the [1‐13C]lactate resonance frequency. T 2‐weighted FSE proton images were acquired for positional reference with the same 32 mm isotropic FOV, 2 mm slice thickness and 0.25 mm in‐plane resolution. 13C images were reconstructed in MATLAB.
3. RESULTS
The frequency and amplitude profiles of the optimized lactate pulse were measured on a phantom containing 5 M thermally polarized [1‐13C]lactate and the results compared to simulated profiles (Figure 2A‐F), which were derived from Bloch‐simulated curves convolved with a Gaussian of 21 Hz full width at half maximum (derived from the width of the 13C lactate peak observed in vivo) to account for B0 inhomogeneity. Both the frequency and B1 profiles of the optimized pulse showed good agreement with the simulations. The pulse gave minimal excitation of the pyruvate and alanine resonances, although some pyruvate‐hydrate excitation might result from the transition band in the presence of large B0 inhomogeneity. The large phase variation for the stopband resonances will help to spoil signal arising from these resonances (Figure 2F). The corresponding profiles for the SLR pulse are shown in Figure 2G‐L. The optimized pulse showed constant phase in the passband (Figure 2F), as opposed to a steep linear phase variation for the SLR pulse (Figure 2L), and was much less sensitive to B1 inhomogeneity (compare Figure 2B,H). Similar results were obtained for the optimized pyruvate pulse.
13C images were acquired from the same phantom using the SLR (Figure 4A) and optimized lactate excitation pulses (Figure 4B). The SNR for the central slice was 46.10 ± 0.04% (n = 20) higher for the optimized pulse, where this was defined as the ratio of the mean signal to the standard deviation of the image background. Image SNR can be degraded by the large B1 field‐dependent linear phase variation imparted by the adiabatic refocusing pulses (Figure 5). This will be further degraded by any phase variation left by the excitation pulse, especially if the matching of echo timing to the isodelay is imperfect, resulting in loss of signal at the odd echoes (the even echoes are fully refocused). The optimized pulse results in the spins being in phase at the end of the pulse, which is the case for the whole passband (Figure 2F), whereas for the SLR pulse the spins are in phase only at the center of the pulse and moreover this is strongly affected by frequency offset (Figure 2L). The decrease in amplitude of the odd echoes was less for the optimized pulse than for the SLR pulse (Figure 4D), which increases SNR and decreases image artifacts. This is illustrated by the insets in Figure 4A,B, which shows that the ring artifact associated with the point spread function (PSF) of the cone trajectory was less for the optimized pulse.
FIGURE 4.
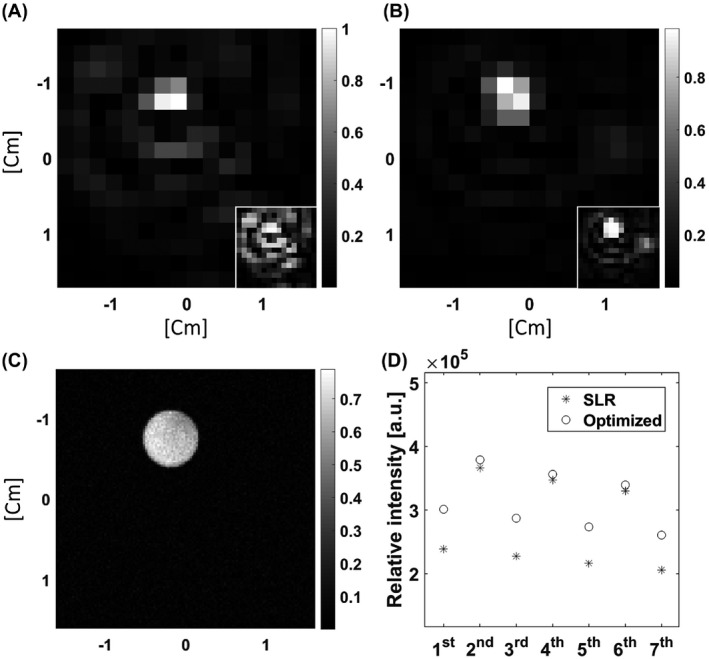
Axial 13C images from a cylindrical phantom containing 5 M thermally polarized [1‐13C]lactate. The shim values were set so that the linewidth was similar to that observed in vivo. A, Central slice of an image acquired with the Shinnar–Le Roux (SLR) excitation pulse. The same image is displayed in the inset with a decreased signal scale. B, The same slice acquired with the optimized excitation pulse. The same image is displayed in the inset with a decreased signal scale. C, Corresponding 1H image of the phantom. D, Echo amplitudes in the readout train acquired with the optimized lactate excitation pulse and the SLR pulse
FIGURE 5.
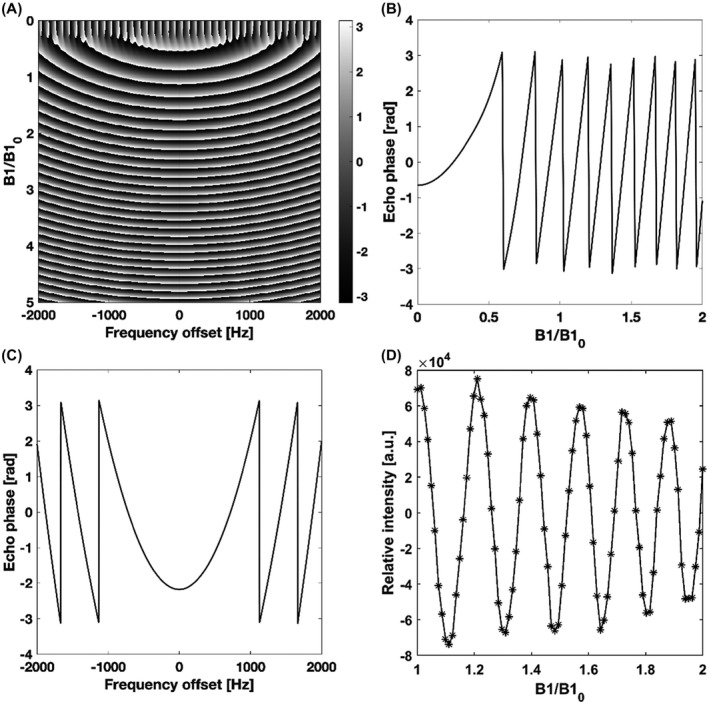
A, Simulated phase profile of the odd echoes as a function of frequency offset and relative B1 amplitude. B, The approximately linear phase ramp caused by varying the B1 field. C, Quadratic echo phase variation with frequency. D, Relative intensity of the real part of the first spin echo with increasing B1 amplitude
The theoretical PSF of the 3D cones readout, ignoring relaxation, was simulated as described by Durst et al 29 (Figure 6). A constant k‐space was sampled and 3D Fourier transformed after gridding to yield the PSF. The PSF was reconstructed at the digital resolution of the 1H images and gave theoretical profiles along the x, y, and z axes that were isotropic and had a full width at half maximum of 2.8 mm.
FIGURE 6.
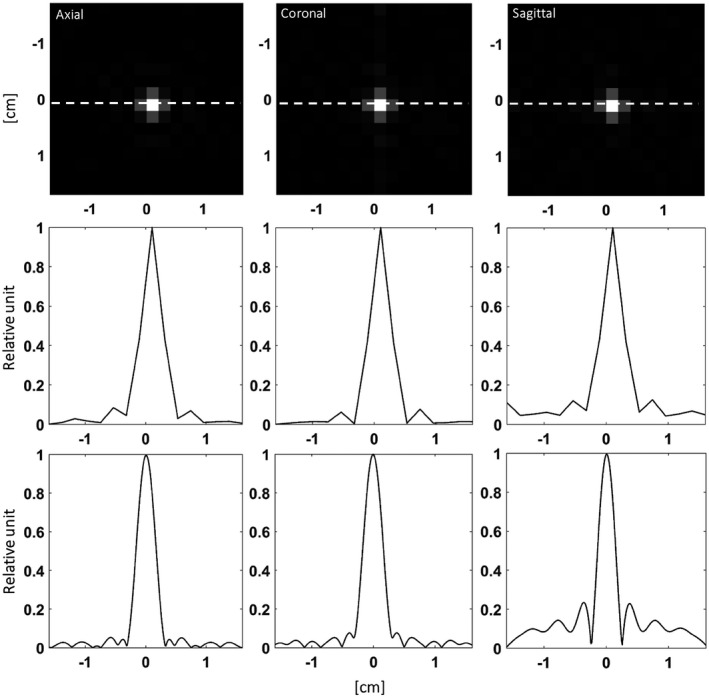
The central slices of the simulated point spread function (PSF) for the 3D cones readout reconstructed at the nominal 2 mm resolution. The numbers along the axes represent the distance from the isocenter in units of cm in each direction. The line profiles along the white dashed lines are plotted in the second row. The third row shows the same line profiles when the PSF was reconstructed at a digital resolution of 0.25 mm, which was the inplane resolution of the 1H images
The PSF will be affected by flow, particularly along the z‐axis where the spherical symmetry of the k‐space acquisition is broken by the echo train readout and in which direction the velocity of flow in vivo is expected to be greatest. To analyze the vulnerability of the sequence to flow, the effect of constant plug‐flow in the z‐direction was simulated. This type of flow induces a constant phase ramp along the direction of flow, which is proportional to the velocity of the spins (u) and their position in velocity k‐space (ku in the case of the z‐axis). 30 The k‐space points accumulate a phase offset: . Simulation of the PSF was carried out using a range of values for u . The maximal expected velocity was calculated to be 0.0615 m/s based on the cardiac output and aorta diameter of the mouse strain used in these experiments. 31 The results of this simulation, up to a u max of 0.1 m/s, compared to a simulation with a linearly sampled k‐space, that is, when consecutive cones are paired (1‐2, 3‐4, etc.) is shown in Figure 7. The readout is robust to flow up to the expected maximal velocity.
FIGURE 7.

A, The velocity k‐space trajectory of the pulse sequence. B, The point spread function (PSF) z‐profile with respect to plug‐flow velocity along the z axis for the cone ordering shown in Figure 3. C, The PSF z‐profile with respect to plug‐flow velocity along the z axis with linear cone ordering (ie, first and second cones sampled at the first echo, third and fourth at the second echo, etc.)
A similar analysis was used to assess the effect of relaxation. The individual cone‐pairs experience different T 2 decay‐induced weighting, where the weighting of the nth echo can be approximated as ; where b = . The first‐order change in the PSF z‐profile in the limit where there is no relaxation (b = 0) was determined both analytically and numerically. The Fourier‐transform of the projection of k‐space onto the kz axis yields the z‐axis PSF. The projection is equal to the area of the spherical cross‐section weighted by T 2 relaxation‐induced exponential decay and the k‐space sampling density:
| (2) |
| (3) |
kr denotes the radial integration variable and kz the position along the kz axis. Therefore, . kR is the k‐space radius, therefore the upper bound of the integral at any given point along kz is given by . The additional factors, other than the exponential signal decay, represent an approximation of the k‐space sampling density, as described in, 27 where kθ used here was denoted as θ in this earlier paper and a separate variable was used instead of to express distance from the k‐space origin. The first derivative at b = 0 gives the change in the z‐profile of the PSF in the limit of no relaxation:
| (4) |
The inner integral was evaluated with Wolfram Alpha (Wolfram Research, Inc., Wolfram|Alpha Knowledgebase, Champaign, Illinois, 2019). The Fourier‐transform in Equation 4 was performed numerically. The theoretical PSF of the 3D cone trajectory, which included relaxation, was determined by numerical simulation, as described previously. Figure 8 shows the simulated PSF z‐profiles for different b values (Figure 8A) and the change in the profile at b = 0 derived by both simulation and analytically (Figure 8B).
FIGURE 8.
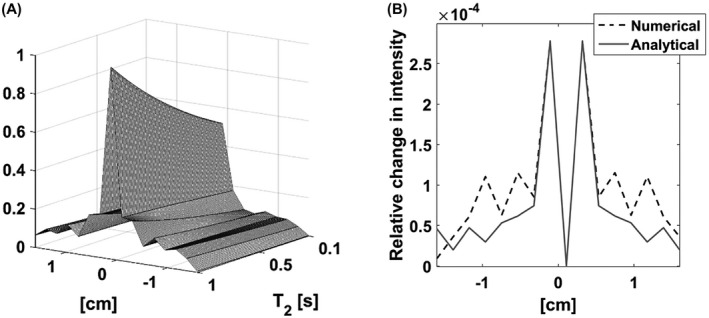
A, The effect of T 2 relaxation time on the z‐profile point spread function (PSF). B, Comparison of the first‐order change in the z‐profile PSF at R 2 = 0 derived analytically with the PSF z‐profile derived numerically from the difference between the profiles for T 2 = 4s and for R 2 = 0 (ie, when relaxation is neglected)
Flow and T 2‐relaxation had a negligible effect on the x and y profiles of the PSF and we have shown previously that despite the long echo train, with relatively long refocusing pulses, there is only a small increase in the rate hyperpolarization loss. 17
Dynamic hyperpolarized 13C images were acquired from a tumor‐bearing mouse. Figure 9 shows the [1‐13C]pyruvate and [1‐13C]lactate images obtained by summing images from the first 20 s of data acquisition overlaid on the corresponding T 2‐weighted 1H images. The 13C images were interpolated to give the same 128 × 128 matrix size as the 1H images and were normalized to the highest intensity in the imaged volume. The acquisition started 10 s after the start of injection of hyperpolarized [1‐13C]pyruvate via a tail vein. Some pyruvate signal is detectable in the aorta in the seventh and eighth slices, but much higher intensity can be seen in the tumor region (Figure 9A), which shows a very similar distribution to the lactate signal (Figure 9B). Figure 10 shows individual images acquired from the central slice. The distribution of both metabolites was heterogeneous, as has been observed previously in this tumor model. 17 , 18
FIGURE 9.
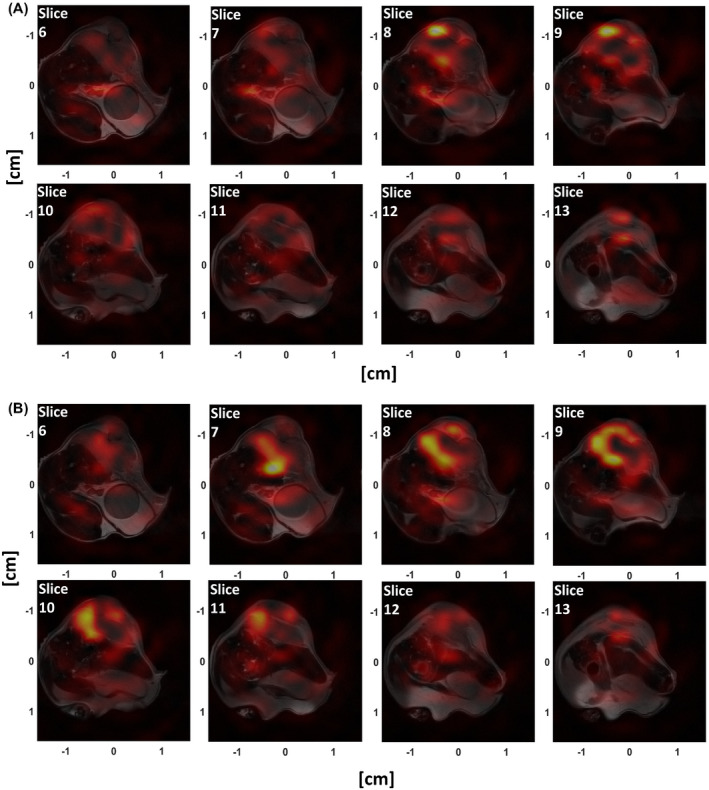
Hyperpolarized [1‐13C]pyruvate (A) and [1‐13C]lactate (B) images from a tumor‐bearing mouse overlaid on the corresponding 1H images (2 mm slice thickness). The 13C images were interpolated to the 128 × 128 in‐plane matrix size of the 1H image and summed in time over the first 20 s. The relatively small signal leakage from neighboring slices in slices 6 and 12 suggests that the simulated sampling point spread function profile is well preserved in vivo
FIGURE 10.
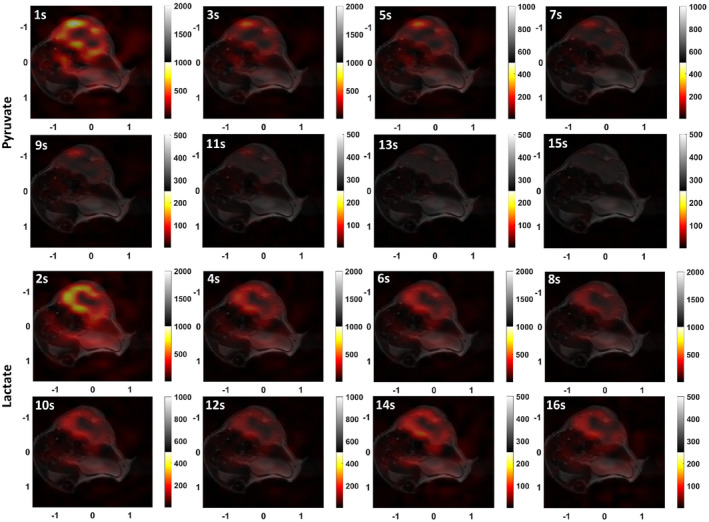
Dynamic hyperpolarized [1‐13C]pyruvate and [1‐13C]lactate images overlaid on the corresponding 1H image for slice 9. The odd time points correspond to pyruvate and the even time points to lactate. For better visualization of the 13C signal the scale is decreased at later time points
4. DISCUSSION
The pulse sequence allows 3D volumetric imaging after a single excitation, resulting in a short total readout time that minimizes vulnerability to B0 inhomogeneity and flow effects. 30 When compared to 2D sequences the 3D readout benefits from fewer excitation pulses and the absence of slice cross‐talk, which helps to preserve the polarization. The sampling PSF is, to a good approximation, isotropic due to the spherical symmetry of the k‐space cone trajectory. The resolution observed in the phantom studies was similar to the simulated isotropic resolution of 2.8 mm. This could be degraded in vivo by relaxation, flow and field inhomogeneity effects. However, simulations showed these effects are small and in the studies on tumor‐bearing mice, the 13C signal did not exceed significantly the tumor volume in the z‐direction, which suggests that the PSF is well preserved in vivo.
The FOV of the 3D cone k‐space trajectory exceeded the sensitive volume of the receiver coil and therefore the excitation pulse did not need to be slice selective. Relaxation of the requirement to be slice selective facilitated optimization of the excitation pulse’s frequency profile, which decreased image degradation owing to the metabolite cross‐contamination that is often reported with similar sequences. 17 , 18 , 32 , 33 Contamination of the lactate image with pyruvate signal appears to be small as the background was correlated with the lactate signal rather than the pyruvate signal. The better phase characteristics of the optimized pulse, with a constant phase in the passband, as opposed to the steep linear phase variation for the standard SLR pulse, and its robustness to B1 inhomogeneity resulted in a smaller loss of signal at the odd echoes in the readout train, increasing image SNR and decreasing image artifacts. The lack of slice selection wastes some polarization if the excited volume exceeds the FOV, however this is balanced to some extent by the better spectral and phase profile of the optimized excitation pulse and the resultant increased image SNR and decreased image artifacts.
The sequence works with gradient strengths and slew rates similar to those used on clinical instruments, demonstrating the feasibility of clinical translation. With a 32 cm FOV and 2 cm resolution, typical of a clinical scanner, the sequence would take only 29.133 ms. The drawback of the sequence is that it contains a large number of adiabatic refocusing pulses and a long excitation pulse with relatively high B1 amplitudes, which may be an issue on a clinical scanner where specific absorption rate (SAR) is of primary concern. With a FOV of 16 cm and 0.5 cm nominal resolution, and the same 4 G/cm and 20 G/cm/ms gradient performance used here, the readout would take 136.4 ms and could be fit into four echoes. With an overdrive factor of 1.7 on the adiabatic and lactate excitation pulses the minimal repetition time on a clinical 3T MRI system (MR750, GE Healthcare, Waukesha, Wisconsin) is 2 s. Furthermore, the excitation pulse is expected to deposit less energy when stretched to cover the reduced spectral dispersion at the lower field. With a 32 cm FOV and 2 cm resolution these issues would be further ameliorated. The adiabatic pulses 34 could also be optimized for (SAR), or alternatively balanced composite pulses could be used, 35 which can outperform conventional adiabatic pulses with respect to compensation of both B0 and B1 field inhomogeneity. 34 A (SAR) constraint could also be incorporated into the design of the excitation pulse. This would either mean an extra penalty term in addition to the pulse amplitude and constant passband phase terms, or an additional constraint if a constrained optimization solver is used in the design process. An additional and more significant problem with the hyperbolic secant refocusing pulses is that the refocused transverse magnetization accrues a B1‐dependent phase at the odd echoes. This results in signal distortion that can lead to artifacts, especially if very different parts of the k‐space are sampled at even and odd echoes. This problem could be addressed by a more symmetric segmentation of the 3D cones in k‐space. Another problem are edge effects, where the B1 field drops below the adiabatic threshold at the edge of the transmit coil leading to unwanted excitation and accelerated loss of polarization, which could be a particular problem on a clinical scanner. The feasibility of designing spectrally selective pulses for 3T has been demonstrated previously by Larson et al 13 and Schulte et al, 33 who used multiband and single resonance selective spatial‐spectral pulses, respectively, to image [1‐13C]labeled pyruvate and its downstream metabolites in vivo. For the optimized pulses described here, achieving the desired spectral bandwidth and sharp transition bands were the most difficult requirements to meet, whereas B1 robustness, reduction of ripples in the stopband and constant phase at the end of the pulse were more easily achieved. Therefore, we anticipate that starting the optimization process from pulses similar to those described in 13 and 33 will produce a pulse with the desired performance at 3T.
In conclusion, we have developed a 3D single‐shot multi spin echo sequence optimized for dynamic imaging of hyperpolarized [1‐13C]pyruvate and lactate. The sequence improves on that described in, 17 with a smaller minimum repetition time, better SNR efficiency and an isotropic PSF that does not degrade the nominal resolution. The k‐space cone trajectory, with an FOV that exceeded the sensitive volume of the receiver coil, enabled the use of optimized excitation pulses that can increase SNR and reduce image artifacts. The feasibility of clinical translation was demonstrated with in vivo measurements at clinically relevant gradient strengths.
CONFLICT OF INTEREST
KMB holds patents with GE Healthcare on some aspects of DNP technology.
DATA AVAILBILITY STATEMENT
The code to design the k‐space readout and the numerically optimized excitation pulses is available at https://github.com/vs460/MultiSE.
ACKNOWLEDGMENTS
This work was supported by Cancer Research UK [C197/A16465, C55296/A26605, C9685/A25177]. MF is in receipt of a Rosetrees Trust studentship (A1698) and FH of a Cambridge European Scholarship from the Cambridge Trust.
Somai V, Wright AJ, Fala M, Hesse F, Brindle KM. A multi spin echo pulse sequence with optimized excitation pulses and a 3D cone readout for hyperpolarized 13C imaging. Magn Reson Med. 2020;84:1895–1908. 10.1002/mrm.28248
REFERENCES
- 1. Ardenkjær‐Larsen JH, Fridlund B, Gram A, et al. Increase in signal‐to‐noise ratio of >10,000 times in liquid‐state NMR. Proc Natl Acad Sci. 2003;100:10158–10163. [DOI] [PMC free article] [PubMed] [Google Scholar]
- 2. Brindle KM. Imaging metabolism with hyperpolarized 13C‐labeled cell substrates. J Am Chem Soc. 2015;137:6418–6427. [DOI] [PubMed] [Google Scholar]
- 3. Brindle K. Watching tumours gasp and die with MRI: The promise of hyperpolarised 13C MR spectroscopic imaging. Br J Radiol. 2012;85:697–708. [DOI] [PMC free article] [PubMed] [Google Scholar]
- 4. Day SE, Kettunen MI, Gallagher FA, et al. Detecting tumor response to treatment using hyperpolarized 13C magnetic resonance imaging and spectroscopy. Nature Medicine. 2007;13:1382–1387. [DOI] [PubMed] [Google Scholar]
- 5. Brindle KM, Bohndiek SE, Gallagher FA, Kettunen MI. Tumor imaging using hyperpolarized 13C magnetic resonance spectroscopy. Magn Reson Med. 2011;66:505–519. [DOI] [PubMed] [Google Scholar]
- 6. Albers MJ, Bok R, Chen AP, et al. Hyperpolarized 13C lactate, pyruvate, and alanine: Noninvasive biomarkers for prostate cancer detection and grading. Cancer Res. 2008;68:8607–8615. [DOI] [PMC free article] [PubMed] [Google Scholar]
- 7. Timm KN, Kennedy BWC, Brindle KM. Imaging tumor metabolism to assess disease progression and treatment response. Clin Cancer Res. 2016;22:5196–5203. [DOI] [PMC free article] [PubMed] [Google Scholar]
- 8. Bedard PL, Hansen AR, Ratain MJ, Siu LL. Tumour heterogeneity in the clinic. Nature. 2013;501:355–364. [DOI] [PMC free article] [PubMed] [Google Scholar]
- 9. Wild JM, Woodhouse N, Paley MNJ, et al. Comparison between 2D and 3D gradient‐echo sequences for MRI of human lung ventilation with hyperpolarized 3He. Magn Reson Med. 2004;52:673–678. [DOI] [PubMed] [Google Scholar]
- 10. Wang ZJ, Ohliger MA, Larson PEZ, et al. Hyperpolarized 13C MRI: State of the art and future directions. Radiology. 2019;291:273–284. [DOI] [PMC free article] [PubMed] [Google Scholar]
- 11. Golman K, Zandt RI, Lerche M, Pehrson R, Ardenkjaer‐Larsen JH. Metabolic imaging by hyperpolarized 13C magnetic resonance imaging for in vivo tumor diagnosis. Cancer Res. 2006;66;10855–10860. [DOI] [PubMed] [Google Scholar]
- 12. Mayer D, Levin YS, Hurd RE, Glover GH, Spielman DM. Fast metabolic imaging of systems with sparse spectra: Application for hyperpolarized 13C imaging. Magn Reson Med. 2006;56:932–937. [DOI] [PubMed] [Google Scholar]
- 13. Larson PEZ, Kerr AB, Chen AP, et al. Multiband excitation pulses for hyperpolarized 13C dynamic chemical‐shift imaging. J Magn Reson. 2008;194:121–127. [DOI] [PMC free article] [PubMed] [Google Scholar]
- 14. Lau AZ, Chen AP, Ghugre NR, et al. Rapid multislice imaging of hyperpolarized 13C pyruvate and bicarbonate in the heart. Magn Reson Med. 2010;64:1323–1331. [DOI] [PubMed] [Google Scholar]
- 15. Lau AZ, Lau JYC, Chen AP, Cunningham CH. Simultaneous multislice acquisition without trajectory modification for hyperpolarized 13C experiments. Magn Reson Med. 2018;80:1588–1594. [DOI] [PMC free article] [PubMed] [Google Scholar]
- 16. Miller JJ, Lau AZ, Teh I, et al. Robust and high resolution hyperpolarized metabolic imaging of the rat heart at 7T with 3D spectral‐spatial EPI. Magn Reson Med. 2016;75:1515–1524. [DOI] [PMC free article] [PubMed] [Google Scholar]
- 17. Wang J, Hesketh RL, Wright AJ, Brindle KM. Hyperpolarized 13C spectroscopic imaging using single‐shot 3D sequences with unpaired adiabatic refocusing pulses. NMR in Biomedicine. 2018;31:e4004. [DOI] [PMC free article] [PubMed] [Google Scholar]
- 18. Wang J, Wright AJ, Hu D‐E, Hesketh R, Brindle KM. Single shot three‐dimensional pulse sequence for hyperpolarized 13C MRI. Magn Reson Med. 2017;77:740–752. [DOI] [PMC free article] [PubMed] [Google Scholar]
- 19. Chen H‐Y, Larson PEZ, Gordon JW, et al. Technique development of 3D dynamic CS‐EPSI for hyperpolarized 13C pyruvate MR molecular imaging of human prostate cancer. Magn Reson Med. 2018;80:2062–2072. [DOI] [PMC free article] [PubMed] [Google Scholar]
- 20. Leupold J, Månsson S, Stefan Petersson J, Hennig J, Wieben O. Fast multiecho balanced SSFP metabolite mapping of 1H and hyperpolarized 13C compounds. Magnetic Resonance Materials in Physics, Biology and Medicine. 2009;22:251–256. [DOI] [PubMed] [Google Scholar]
- 21. Reed GD, von Morze C, Bok R, et al. High resolution 13C MRI with hyperpolarized urea: In vivo T 2 mapping and 15N labeling effects. IEEE Trans Med Imaging. 2014;33:362–371. [DOI] [PMC free article] [PubMed] [Google Scholar]
- 22. Varma G, Wang X, Vinogradov E, et al. Selective spectroscopic imaging of hyperpolarized pyruvate and its metabolites using a single‐echo variable phase advance method in balanced SSFP. Magn Reson Med. 2016;76:1102–1115. [DOI] [PMC free article] [PubMed] [Google Scholar]
- 23. von Morze C, Sukumar S, Reed GD, et al. Vigneron DB. Frequency‐specific SSFP for hyperpolarized 13C metabolic imaging at 14.1 T. Magn Reson Imaging. 2013;31:163–170. [DOI] [PMC free article] [PubMed] [Google Scholar]
- 24. Lau AZ, Miller JJ, Tyler DJ. Mapping of intracellular pH in the in vivo rodent heart using hyperpolarized [1‐13C]pyruvate. Magn Reson Med. 2017;77:1810–1817. [DOI] [PMC free article] [PubMed] [Google Scholar]
- 25. Balchandani P, Yamada M, Pauly J, Yang P, Spielman D. Self‐refocused spatial‐spectral pulse for positive contrast imaging of cells labeled with SPIO nanoparticles. Magn Reson Med. 2009;62:183–192. [DOI] [PMC free article] [PubMed] [Google Scholar]
- 26. Balchandani P, Pauly J, Spielman D. Designing adiabatic radio frequency pulses using the Shinnar–Le Roux algorithm. Magn Reson Med. 2010;64:843–851. [DOI] [PMC free article] [PubMed] [Google Scholar]
- 27. Gurney PT, Hargreaves BA, Nishimura DG. Design and analysis of a practical 3D cones trajectory. Magn Reson Med. 2006;55:575–582. [DOI] [PubMed] [Google Scholar]
- 28. Takahashi A, Peters T. Compensation of multi‐dimensional selective excitation pulses using measured k‐space trajectories. Magn Reson Med. 1995;34:446–456. [DOI] [PubMed] [Google Scholar]
- 29. Durst M, Koellisch U, Frank A, et al. Comparison of acquisition schemes for hyperpolarised 13C imaging. NMR in Biomedicine. 2015;28:715–725. [DOI] [PubMed] [Google Scholar]
- 30. Nishimura DG, Irarrazabal P, Meyer CH. A velocity k‐space analysis of flow effects in echo‐planar and spiral imaging. Magn Reson Med. 1995;33:549–556. [DOI] [PubMed] [Google Scholar]
- 31. Guo X, Kono Y, Mattrey R, Kassab GS. Morphometry and strain distribution of the C57BL/6 mouse aorta. Am J Physiol Heart Circ Physiol. 2002;283:H1829–H1837. [DOI] [PubMed] [Google Scholar]
- 32. Larson PEZ, Hu S, Lustig M, et al. Fast dynamic 3D MR spectroscopic imaging with compressed sensing and multiband excitation pulses for hyperpolarized 13C studies. Magn Reson Med. 2011;65:610–619. [DOI] [PMC free article] [PubMed] [Google Scholar]
- 33. Schulte RF, Sperl JI, Weidl E, et al. Saturation‐recovery metabolic‐exchange rate imaging with hyperpolarized [1‐13C] pyruvate using spectral‐spatial excitation. Magn Reson Med. 2013;69:1209–1216. [DOI] [PubMed] [Google Scholar]
- 34. Moore J, Jankiewicz M, Anderson AW, Gore JC. Evaluation of non‐selective refocusing pulses for 7T MRI. J Magn Reson. 2012;214:212–220. [DOI] [PMC free article] [PubMed] [Google Scholar]
- 35. Odedra S, Wimperis S. Use of composite refocusing pulses to form spin echoes. J Magn Reson. 2012;214:68–75. [DOI] [PubMed] [Google Scholar]


