Abstract
Neural oscillations can couple networks of brain regions, especially at lower frequencies. The nasal respiratory rhythm, which elicits robust olfactory bulb oscillations, has been linked to episodic memory, locomotion, and exploration, along with widespread oscillatory coherence. The piriform cortex is implicated in propagating the olfactory-bulb-driven respiratory rhythm, but this has not been tested explicitly in the context of both hippocampal theta and nasal respiratory rhythm during exploratory behaviors. We investigated systemwide interactions during foraging behavior, which engages respiratory and theta rhythms. Local field potentials from the olfactory bulb, piriform cortex, dentate gyrus, and CA1 of hippocampus, primary visual cortex, and nasal respiration were recorded simultaneously from male rats. We compared interactions among these areas while rats foraged using either visual or olfactory spatial cues. We found high coherence during foraging compared with home cage activity in two frequency bands that matched slow and fast respiratory rates. Piriform cortex and hippocampus maintained strong coupling at theta frequency during periods of slow respiration, whereas other pairs showed coupling only at the fast respiratory frequency. Directional analysis shows that the modality of spatial cues was matched to larger influences in the network by the respective primary sensory area. Respiratory and theta rhythms also coupled to faster oscillations in primary sensory and hippocampal areas. These data provide the first evidence of widespread interactions among nasal respiration, olfactory bulb, piriform cortex, and hippocampus in awake freely moving rats, and support the piriform cortex as an integrator of respiratory and theta activity.
SIGNIFICANCE STATEMENT Recent studies have shown widespread interactions between the nasally driven respiratory rhythm and neural oscillations in hippocampus and neocortex. With this study, we address how the respiratory rhythm interacts with ongoing slow brain rhythms across olfactory, hippocampal, and visual systems in freely moving rats. Patterns of network connectivity change with behavioral state, with stronger interactions at fast and slow respiratory frequencies during foraging as compared with home cage activity. Routing of interactions between sensory cortices depends on the modality of spatial cues present during foraging. Functional connectivity and cross-frequency coupling analyses suggest strong bidirectional interactions between olfactory and hippocampal systems related to respiration and point to the piriform cortex as a key area for mediating respiratory and theta rhythms.
Keywords: coherence, hippocampus, navigation, piriform cortex, respiratory rhythm, theta rhythm
Introduction
Distal neural system interactions occur through coherent low-frequency oscillations (Fell and Axmacher, 2011; Freeman, 2015; Fries, 2015). Respiratory coherence with hippocampal and/or neocortical oscillations has recently been reported in anesthetized (Yanovsky et al., 2014; Lockmann et al., 2016), awake, head-fixed (Ito et al., 2014; Nguyen Chi et al., 2016; Liu et al., 2017), and freely moving rodents (Moberly et al., 2018; Rojas-Líbano et al., 2018; Tort et al., 2018b). Respiration also modulates human hippocampal theta (4–8 Hz), although human respiratory rates (∼0.2 Hz; Zelano et al., 2016) are much slower than those of rodents (2–12 Hz; Rojas-Líbano et al., 2014). The olfactory bulb (OB) appears to drive respiratory coupling with neural oscillations (Ito et al., 2014; Yanovsky et al., 2014; Lockmann et al., 2016; Moberly et al., 2018). Furthermore, human nasal, and not oral, respiratory rhythm is implicated in memory (Zelano et al., 2016; Arshamian et al., 2018). However, both nasal and oral respiratory oscillations in neocortical areas were correlated with visuospatial performance in another study (Perl et al., 2019).
The hippocampus (HPC), important for navigation, episodic memory, and cross-modal sensory associations, generates robust theta oscillations during movement (Vanderwolf, 1969; O'Keefe and Recce, 1993; Buzsáki, 2002). The olfactory system is hypothesized to have evolved in parallel with HPC as a scaffold for navigation (Jacobs, 2003, 2012). Olfactory spatial cues form spatial field representations in the rat HPC (Save et al., 2000; Zhang and Manahan-Vaughan, 2015) and gridlike representations in the human entorhinal cortex (Bao et al., 2019). The rodent respiratory rhythm (2–12 Hz) driven by OB appears in HPC, and hippocampal theta (7–8 Hz) appears in OB of head-fixed mice (Nguyen Chi et al., 2016).
There are several anatomic pathways to HPC from OB mitral cells. Lateral entorhinal cortex (LEC) is the most direct route (de Olmos et al., 1978; Sosulski et al., 2011), and coupling between OB and respiratory activity and LEC has been demonstrated in rats and mice (Kay, 2005; Gretenkord et al., 2019). However, in awake behaving rats, OB-EC respiratory coupling is absent during odor sampling even when OB–HPC coupling is high (Kay, 2005). Another route is via piriform cortex (PC), which intermittently couples with the respiratory rhythm under anesthesia (Fontanini and Bower, 2005; Litaudon et al., 2008) at the multiunit level in rats (Rennaker et al., 2007) and in the theta/respiratory frequency band in awake behaving rats (Kay, 2005). Human theta oscillations in PC, amygdala, and HPC are modulated by the respiratory rhythm (Zelano et al., 2016). PC may help propagate OB respiratory rhythm to downstream limbic structures via direct projections to the entorhinal cortex (Haberly and Price, 1978; Truchet et al., 2002; Sosulski et al., 2011; Zelano et al., 2016) and via the endopiriform nucleus (Behan and Haberly, 1999). Moreover, PC is hypothesized to be an anatomic hub for the cerebral cortical association connectome (Bota et al., 2015). Thus, PC is one likely mediator of theta and respiratory frequencies for linking closely connected olfactory and hippocampal systems, along with more distal sensory systems like visual cortex.
We compared theta and respiratory oscillation network interactions while rats foraged using either visual or olfactory spatial cues. We simultaneously recorded local field potentials (LFPs) from OB, PC, primary visual cortex (monocular; V1M), dentate gyrus (DG), and CA1 areas of hippocampus, and nasal respiration. We found widespread coherence at both respiratory and theta frequencies in both modalities. Directionality results show effects of behavioral condition and modality. Faster oscillations were also modulated by respiratory and theta rhythms shown by phase-amplitude coupling analyses. The dynamic range of respiratory frequencies is highlighted with supporting evidence for the respiratory rhythm as an overlooked mechanism for neural system connectivity (Tort et al., 2018b; Heck et al., 2019). Our results show broad network connectivity supported by both theta and respiratory rhythms in which PC appears to play a mediating role.
Materials and Methods
We used seven adult male Long Evans rats (∼400–450 g throughout the experiments; Envigo). As there are known sex differences in navigational strategies and hippocampal involvement (Bettis and Jacobs, 2013), future studies will include female rats. Rats were individually housed on a 14/10 h light/dark cycle (lights on at 8:00 A.M. Central Standard Time). All experiments were conducted during the light period to avoid fracturing circadian rhythms with light exposure during the dark period. Rats are known to entrain to food availability and periodic behavioral demands and so were tested and fed at the same time every day (Travlos et al., 2001; Bedrosian et al., 2013). Rats were dieted to 85% of ad libitum weight before experiments and were maintained at this level for the remainder of the study. All procedures were conducted under veterinary supervision and oversight of the University of Chicago Institutional Animal Care and Use Committee in accordance with the Association for Assessment and Accreditation of Laboratory Animal Care Standards.
Electrophysiology
Rats were implanted with bipolar recording electrodes (100 µm stainless steel, Formvar insulated, ∼1–1.5 mm vertical tip separation, 100–200 kΩ impedance at 1 kHz) following our previously reported methods (Frederick et al., 2016) in the left main OB (8.5 mm anterior to bregma, 1.5 mm lateral, and ∼4.2 mm deep), anterior PC (0.5 mm anterior to bregma, 3 mm lateral, and 7.5 mm deep at a 15° angle from vertical), DG of hippocampus (3 mm posterior to bregma, 2.4 mm lateral, 3 mm deep), dorsal CA1 of hippocampus (4 mm posterior to bregma, 3 mm lateral, 2 mm deep), and V1M (1.08 mm anterior to interaural line, 2.6 mm lateral, 1.2 mm deep). A thermocouple (0.005 inch, Teflon coated; catalog #5TC-TTK-36-36, Omega) was implanted in the right nasal cavity (7.7 mm anterior to nasal suture) to track the respiratory rhythm (Ranade et al., 2013). Ground and reference screws were secured to head screws in the right parietal and frontal bones. Electrodes were visualized to pierce the pial surface, and signals were recorded as the electrode was lowered. A final location was selected if the signals on each electrode reversed themselves at or near the planned depth. If there was no reversal, the location within the desired stereotaxic depth with the largest amplitude was selected. Depths for reversals were previously estimated in acute recording and stimulation experiments (lateral olfactory tract for OB and PC, perforant path for DG and CA1, and lateral geniculate nucleus for V1M).
The thermocouple and each electrode were connected to an 18-pin connector (Ginder Scientific). All data were recorded wirelessly with a Multichannel W2100 System, using a 16- or 32-channel headstage (W16-HS or W2100-HS32, Multichannel Systems) with a digital sampling rate of 2 kHz and MC_Rack software. Spike2 Version 6 (Cambridge Electronic Design) was used to record behavioral videos and synchronize with MC_Rack software by sending a 5 V transistor–transistor logic pulse triggered at the start of recording.
Behavior
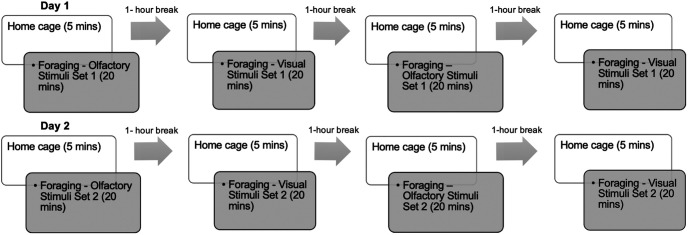
During wireless recordings, rodents freely foraged in an open-field environment (124 × 124 × 60 cm high, gray polyvinyl chloride box with open top). The design of the experiment facilitated comparison between environments with different sensory modalities as spatial cues. Visual or olfactory spatial cues were placed on the walls of the open-field box, which was surrounded by a black curtain to conceal the rest of the room. The protocol for each session consisted of a 5 min recording taken while the rat was in a home cage outside the testing room, then 20 min of recording while the rat was foraging for chocolate sprinkles in the open-field box, then 1 h back in the home cage (no recording during this period; Fig. 1). Recording sessions during foraging were repeated twice for each modality, with four total sessions per day, to control for effects of familiarity with the environment apart from the provided salient cues. Two sets of cues for each modality were used to control for effects of specific stimuli, and these were presented on separate days. The order in which the modality of spatial cues was manipulated across sessions was counterbalanced across subjects. The entire box was sprayed with 70% ethanol and wiped down in between each session. A large ventilation snorkel was placed over the box within the curtained area to remove airborne odorants in the hour between sessions. A wide-angle low-light camera (ELP 1.3MP USB Camera) was mounted on the ceiling to record behavior. During olfactory foraging sessions, red overhead lights were the only lighting used, and computer monitors were turned off to limit any spatial cues other than the provided olfactory spatial cues. For olfactory spatial cues, the following monomolecular odorants (Sigma-Aldrich) were used: amyl acetate and anisole (catalog #628-63-7 and #100-66-3, Stimuli Set 1), ethyl-2-methylbutyrate and geraniol (catalog #7452-79-1 and #106-24-1, Stimuli Set 2). Perforated plastic weigh boats containing cotton swab tips saturated in pure odorant were adhered to two adjacent walls of the open-field box. The third and fourth wall had empty weigh boats, visually identical to the other two. During visual foraging sessions, visual spatial cues made of black and white patterns, including diagonal stripes, checkers, and circles, were printed on 8.5 × 11 inch pieces of paper, then laminated and oriented together in different formations (e.g., adjacent, rotated 90°) and adhered to the walls of the open field. Red overhead lights and dim lamps outside the curtained area were used for visual spatial cue sessions. Off-line tracking for velocity data was conducted post hoc using EthoVison XT software (Noldus).
Figure 1.
Within-subjects behavioral protocol for all rats. Days 1 and 2 were replicates apart from different stimulus sets used for each modality. Rats were pseudorandomly assigned to begin with either olfactory or visual condition.
Data cleaning, preparation and spectral analysis
All analysis was performed with MATLAB R2015b. The signals from each lead for each rat were assessed. If the two leads for an area showed reversed signals indicating precise positioning across the principal cell layer, then the difference of the two signals was used; otherwise, the cleaner of the two leads was chosen, and if they were comparably clean or with similar amplitude, then the longer lead was chosen. A low-pass filter at 100 Hz was applied to the respiratory signal to remove chewing artifacts. Foraging data were parsed into 10 s half-overlapping windows across each 20 min session, and noisy time periods were discarded. Signals were normalized by dividing each by the SD of the signal. Average power spectra across all windows for each subject by condition were calculated using the multitaper method implemented in the Chronux version 2.11 toolbox for MATLAB (Bokil et al., 2010), with a time half bandwidth of three and five tapers over a frequency range of 0.1–250 Hz. This method multiplies each LFP trace with a series of tapers (Slepian sequences) and then averages them, which has the effect of reducing spurious noise contributions. The Slepian sequences also possess desirable spectral concentration properties, which produce a more accurate measure of the underlying power spectrum (Bokil et al., 2010). Recordings during 5 min home cage activity outside the behavioral room preceding each 20 min foraging recording session were analyzed in 10 s half-overlapping windows. The seventh rat was excluded from analysis because of bridged electrodes.
Coherence was calculated using the coherencyc function in the Chronux toolbox. Coherence is a mechanism for temporal coordination of oscillatory activity between brain areas (Freeman, 2004; Fell and Axmacher, 2011). Averages for coherence were obtained similarly for power across all 10 s windows within each subject, then subject averages were averaged across subjects by condition. We used five tapers with a time half bandwidth of three. The Fisher's Z-transform was applied to coherence (Bressler et al., 1993; Kay and Freeman, 1998; Kay and Beshel, 2010), defined as tanh−1(coherence), to distribute the values from zero to infinity instead of zero to one.
For binning data during foraging by respiratory rate, the frequency of respiratory (Resp)-OB coherence was used as a measure of the frequency that the OB produces in response to input from the sensory nerve and to avoid bias to low frequencies represented by the 1/fα falloff of log(power) over log(frequency) of cortical signals. Data were concatenated across rats by condition, and peak Z-coherence was averaged across 2 s windows stepped by 1 s using the cohgramc function in the Chronux toolbox. We used three tapers with a time half bandwidth of two for this analysis to enhance frequency resolution in these shorter time windows. Probability of peak coherence for each pair of recording sites was calculated during binned periods of two respiratory frequencies, one slow and one fast, within the 1–14 Hz range for each of the three behavioral conditions.
To extend on these analyses, we measured directionality using multivariate autoregressive Granger causality, which is an estimation of transfer entropy similar to other measures of functional connectivity between brain regions. Granger causality is an approximation of transfer entropy between variables relying on vector autoregressive models as weighted sums of the pasts of the variables. Data were first downsampled to 250 Hz as our 2000 Hz sampling resolution would result in overfitting (Seth et al., 2015; Nguyen Chi et al., 2016).
In addition to neural oscillatory coherence and directionality, we examined the phase of slower neural oscillations that modulate the amplitude of faster neural oscillations, or phase-amplitude coupling, using the modulation index (MI) as implemented by Tort (Hurtado et al., 2004; Tort et al., 2008, 2010). Briefly, the method is implemented as follows. The data are first filtered at amplitude and phase frequency ranges fA and fp, respectively. Using the standard Hilbert transform, the time series of the phases is obtained. The Hilbert transform is also applied to the time series of the amplitude envelope extracted from fA, forming a composite time series with each phase of the fp oscillation informing the amplitude of the fA rhythm. The mean fA is then calculated over 18 bins of 20° intervals (0 to 360°). Then, the entropy measure H is first applied to the phase amplitude bins, then the maximum possible entropy (Hmax) value is obtained for a uniform distribution, and the MI is finally obtained by normalizing H by Hmax. An MI value of zero reflects lack of phase-to-amplitude modulation, and larger MI values show stronger phase-to-amplitude modulation. Data are presented in comodulogram plots, which represent in pseudocolor scale the MI values of fp calculated in 1 Hz steps with 4 Hz bandwidths and fA in 2 Hz steps with 20 Hz bandwidths.
Experimental design and statistics
Behavior and recordings were conducted within subjects with the order of foraging conditions counterbalanced. Paired t-tests were used for comparisons of velocity during the two foraging conditions. Coherence results are presented with 95% confidence intervals from 1,000 bootstrap permutations for each pair across subjects. Chance coherence was calculated by pooling all data by condition and running the same average coherence function described above with the same number of mismatched time points as those used for averaging. Granger causality data were similarly shuffled at over 2,000 iterations, which gave chance magnitudes of ∼1 × 10⁻⁴, or two orders of magnitude smaller than any Granger causality values reported here. Surrogate data for phase-amplitude coupling was also based on mismatched time points and used for a significance floor of p < 0.05 in the comodulogram plots.
Results
We studied respiratory activity and brain rhythms in olfactory, visual, and hippocampal areas and the relationships among these areas, with a focus on respiratory and theta rhythm frequency bands. To describe dynamic network states that might depend on the perceptual state of the rats (visual or olfactory cues), we recorded nasal respiration and LFPs in olfactory and visual primary sensory cortices and in hippocampal areas while rats moved freely in different environments. We recorded all channels simultaneously while rats explored the home cage and foraged with salient olfactory spatial cues in the dark or visual spatial cues in dim light (Fig. 2). Electrodes in olfactory and hippocampal areas were implanted in all six rats used for this study, and V1M electrodes were also implanted in four of these rats. Signals were recorded from each rat during eight home cage activity sessions and eight foraging sessions across 2 d (see above, Materials and Methods; Fig. 1). We use spectral analysis to characterize the presence of both respiratory and theta rhythms and to examine coherence structure across pairs of brain regions. We then use Granger causality analysis to examine the directionality of influence across all recorded nodes. Finally, phase-amplitude coupling was used to assess the coupling of slow respiratory and theta rhythms to faster network oscillations.
Figure 2.
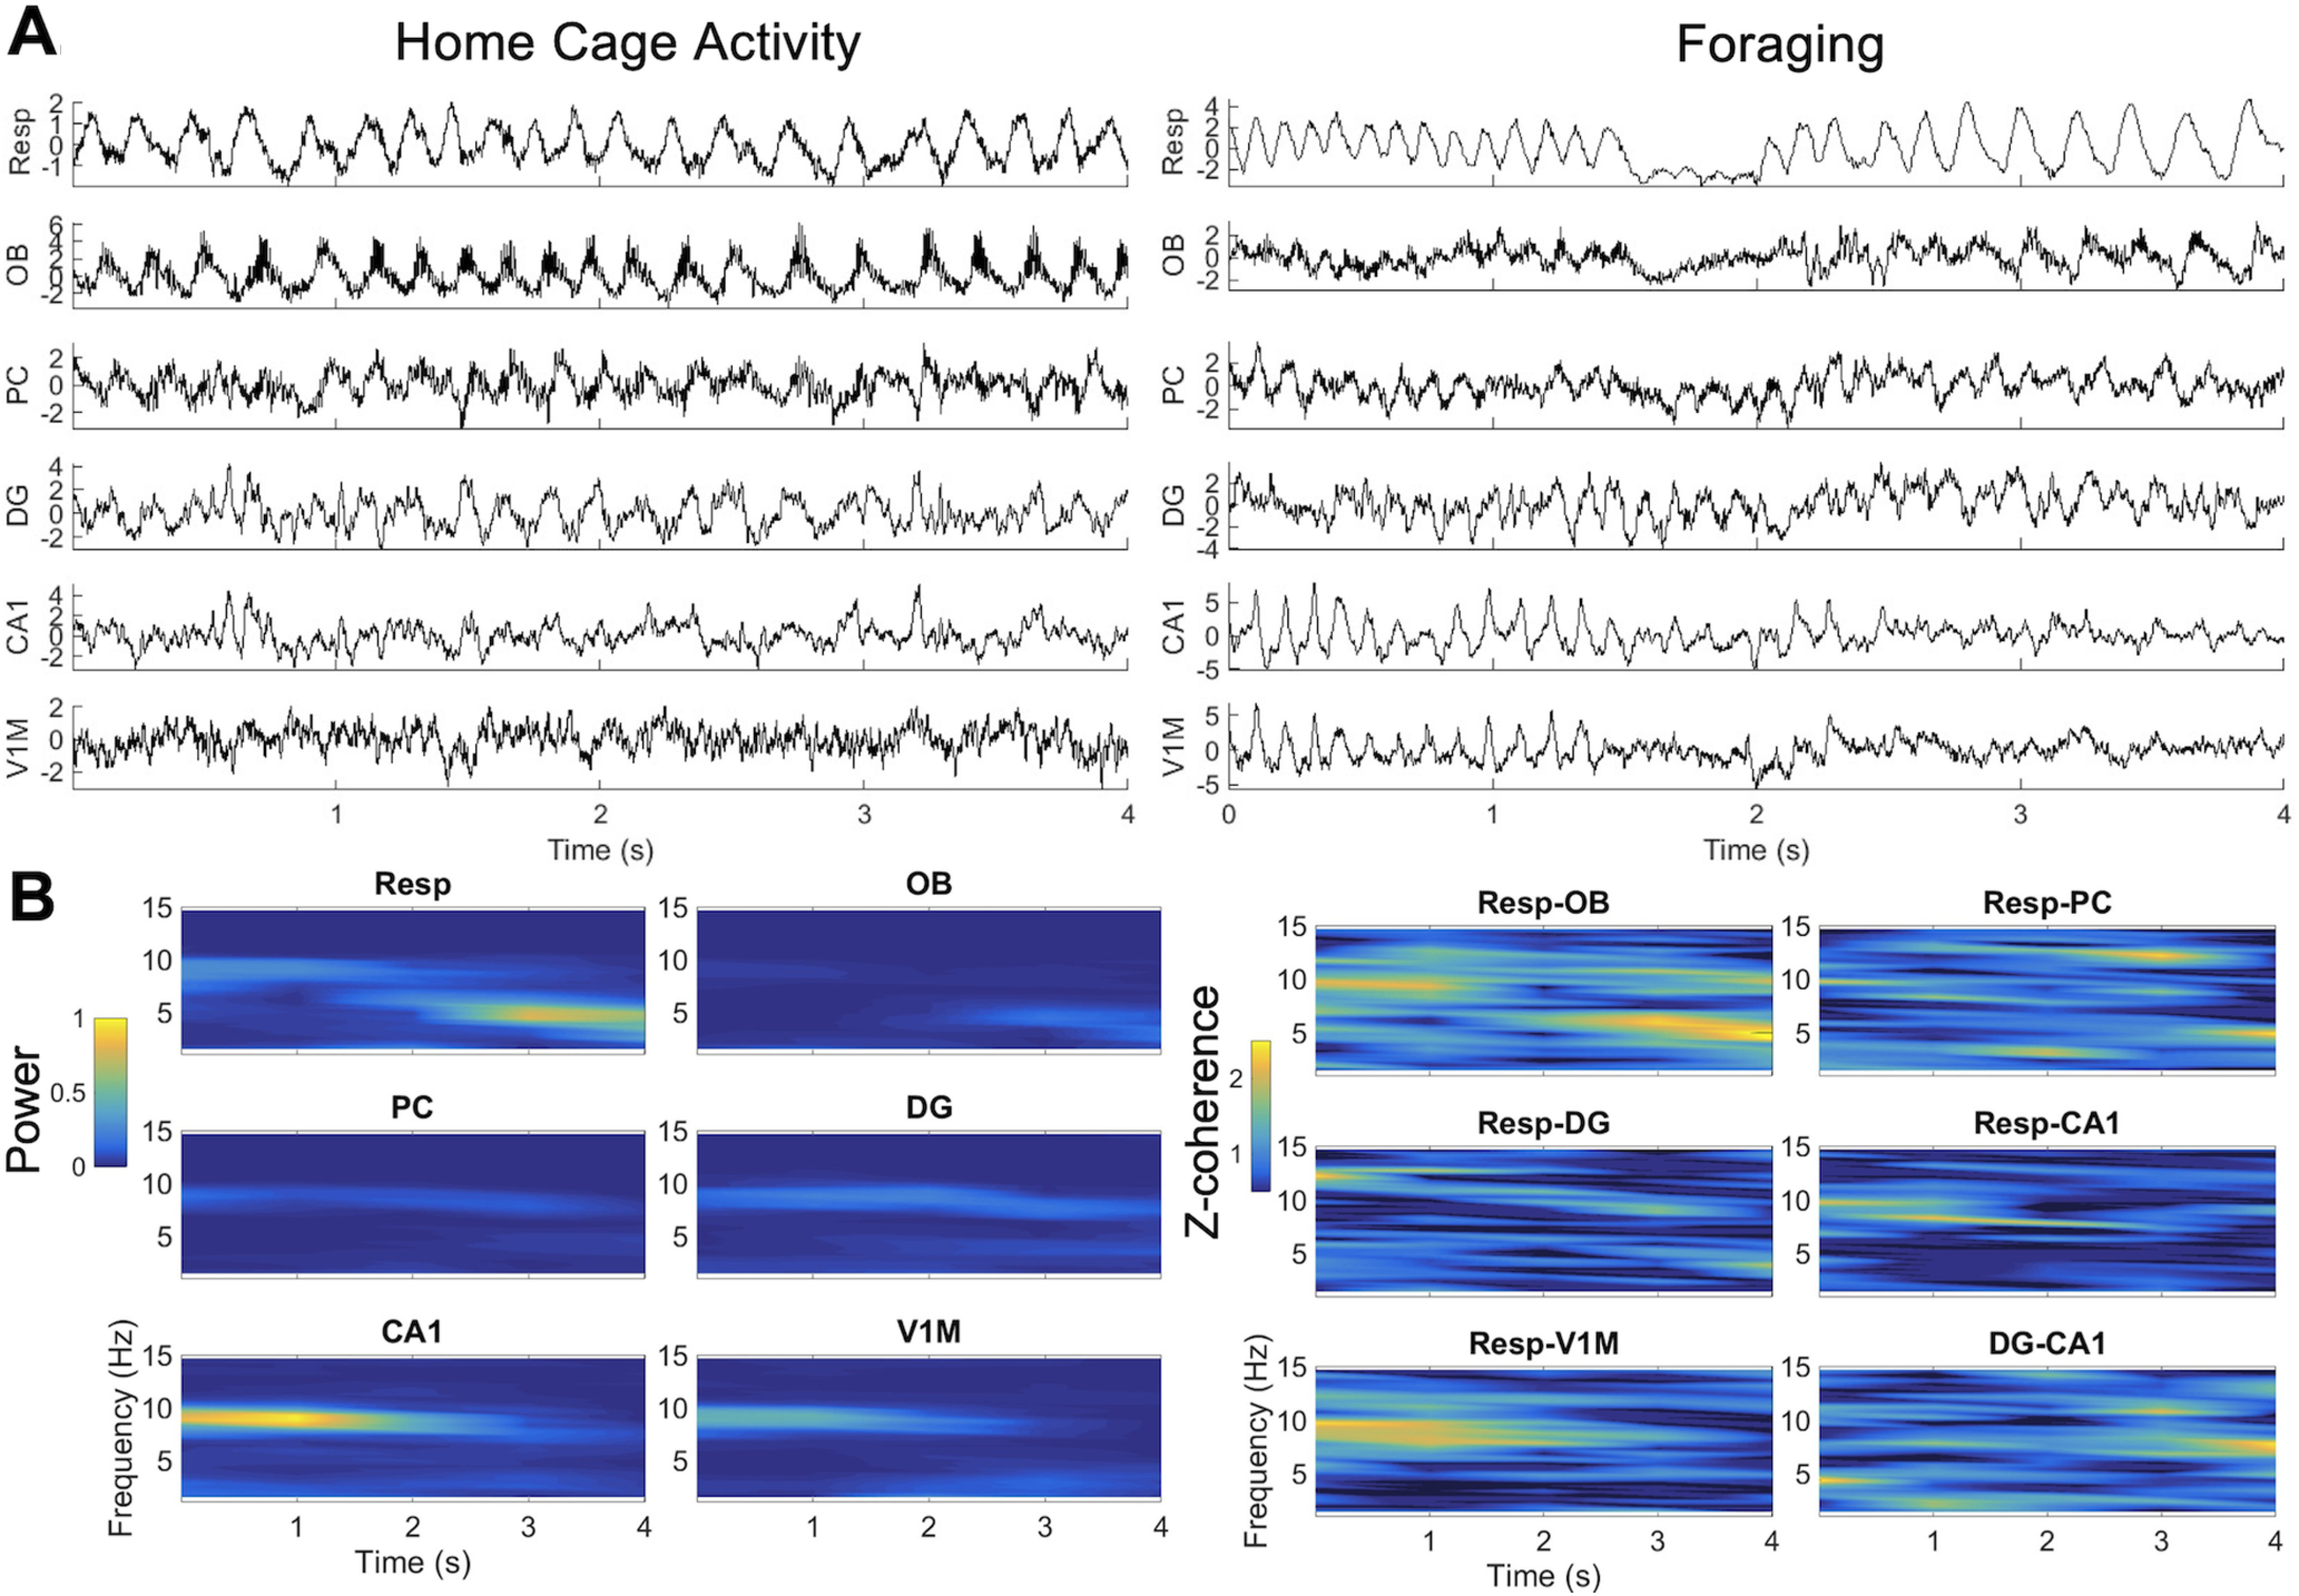
Representative data. A, Example of signals from one rat during home cage activity (left) and foraging (right). Note 4–6 Hz respiratory frequency in the home cage. During foraging, faster respiration ∼9 Hz is seen in the first second of this example, whereas 2–4 s show slower respiration ∼6 Hz. B, Power and coherence across time for the same sample of signals during foraging shown in A.
Spectral analysis—power and coherence
Power in the 0.1–18 Hz band was compared across the three behavioral conditions, with signals normalized by the SDs of the signals. During home cage baseline activity (Fig. 3A) Resp and low-frequency OB power was centered around a slow frequency of ∼1.5–2 Hz and another faster frequency at 6 Hz, consistent with resting and exploratory behavior in the home cage (Rojas-Líbano et al., 2014). Power at 7 Hz was apparent in both DG and CA1, consistent with the range of hippocampal theta rhythms (Newman et al., 2013; Agarwal et al., 2014). PC also exhibited a peak in power at theta frequency, and V1M power was negligible (Fig. 3A). The slow frequency component at ∼0.1–1 Hz in PC, DG, CA1, and V1M in all three conditions (Fig. 3A), and in all regions during the two foraging conditions (Fig. 3A), is likely movement artifact or DC drift as chance coherence of those pairs in that frequency band is also elevated (Fig. 4).
Figure 3.
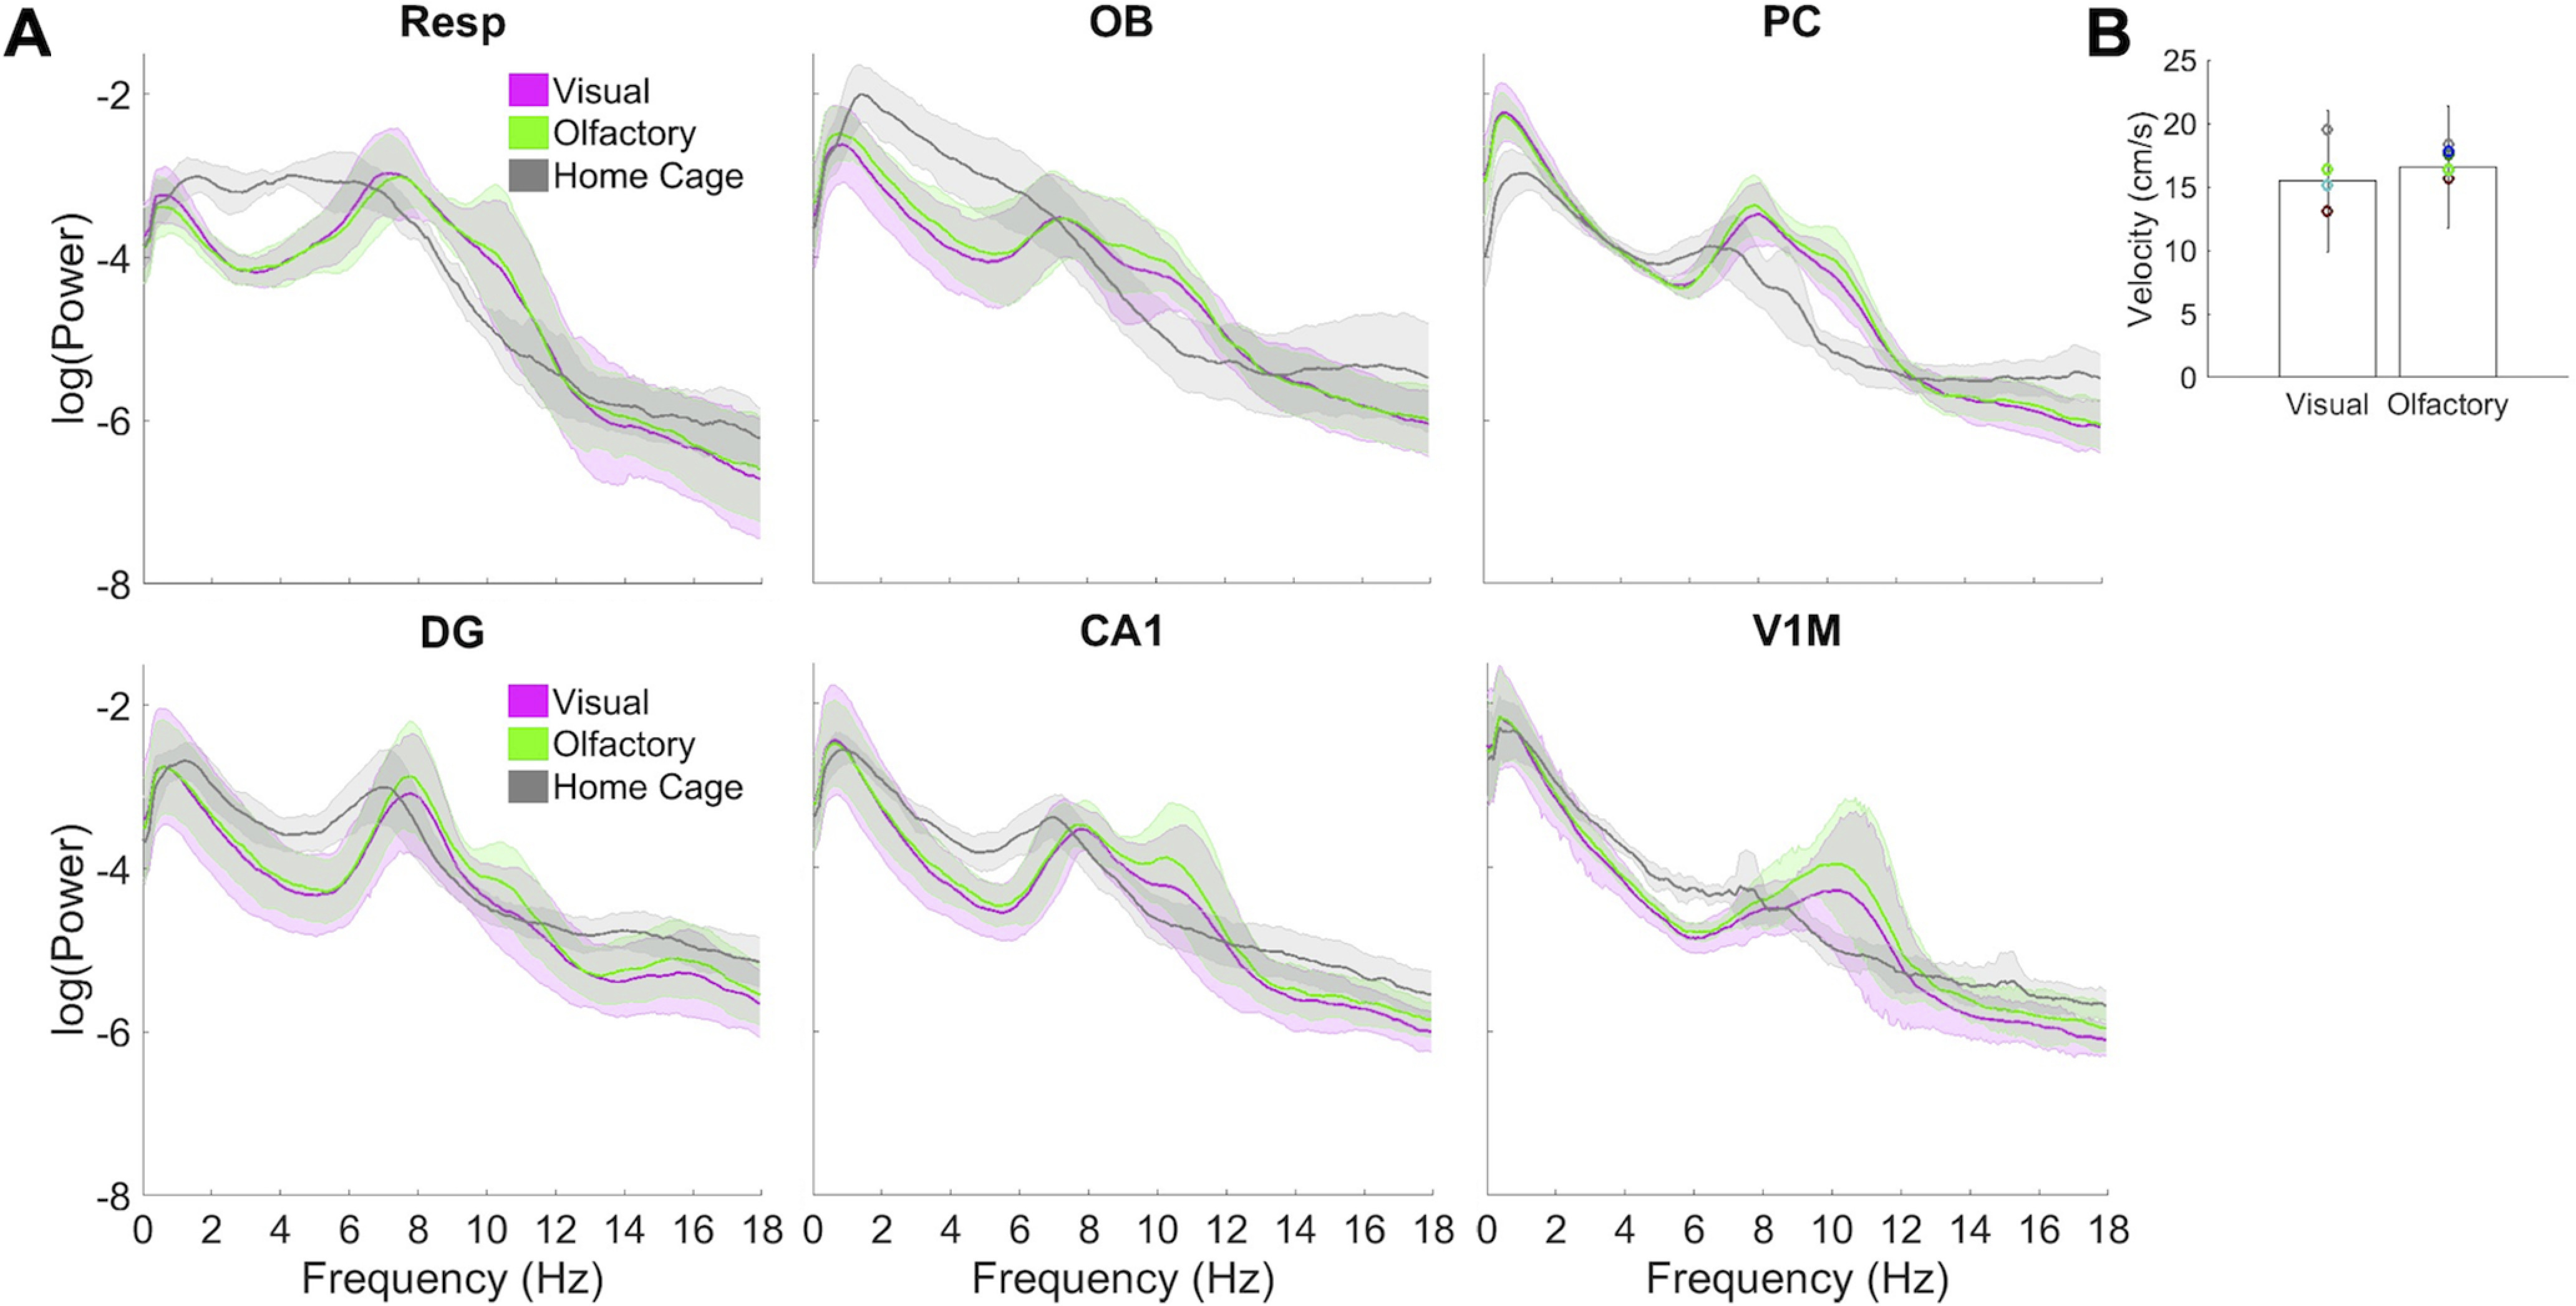
Power across the three behavioral conditions and velocity during foraging. For all regions other than V1M, n = 6; for V1M, n = 4. A, Power is averaged across all sessions by condition for each rat, with bootstrap 95% confidence intervals from 1000 permutations across the six subjects (4 subjects for V1M) shown. B, Mean velocity is compared for visual (left) versus olfactory (right) spatial cues, with Se bars and individual subject means shown.
Figure 4.
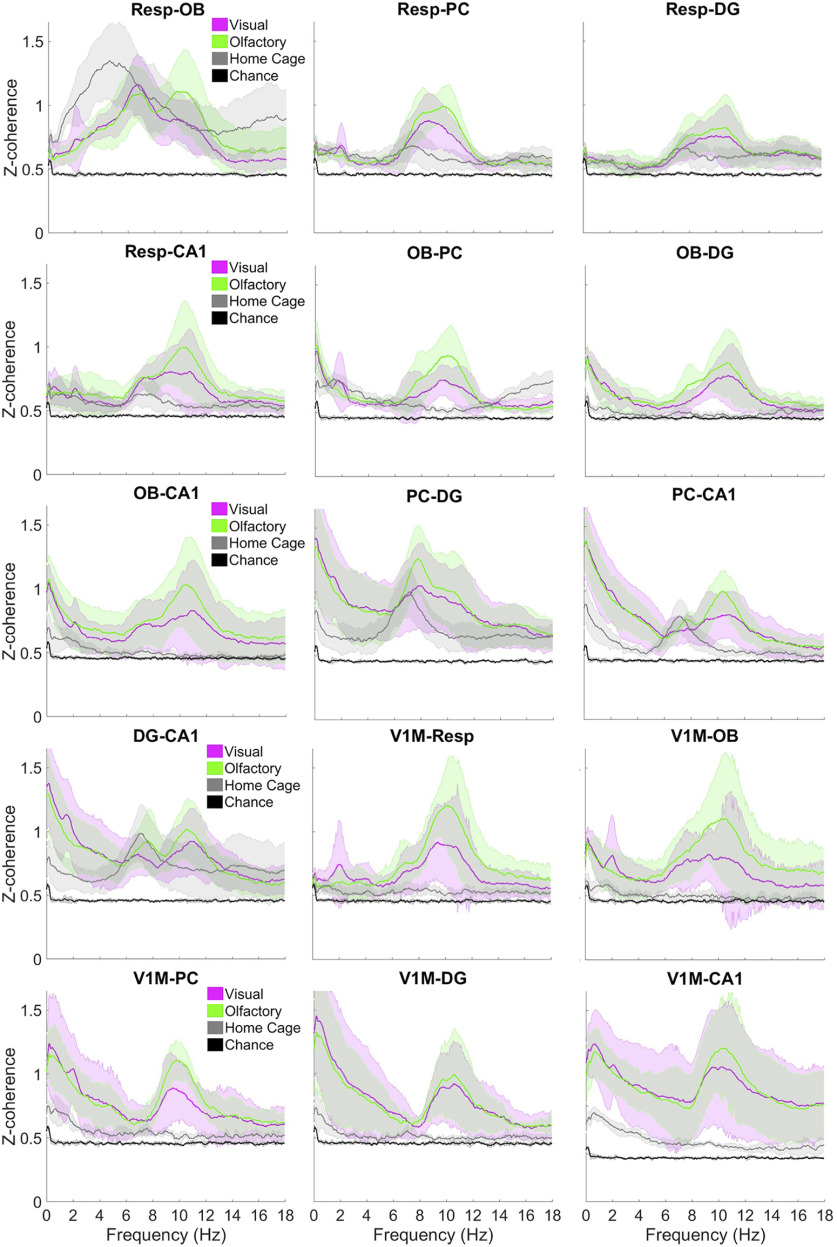
Coherence across the three behavioral conditions compared with chance levels. The z-coherence is averaged across all sessions for each condition by rat with 95% bootstrap confidence intervals permuted 1,000 times across rats for all pairs. V1M was recorded in fewer rats (n = 4), whereas the rest of the pairs were recorded in all rats (n = 6). Bottom, Note difference in scale of y-axis for V1M-CA1 (right).
During foraging, respiration exhibited two frequencies, shown by peaks in power at 6–8 and 10–12 Hz in both olfactory and visual conditions (Fig. 3A). V1M showed a peak in power at 9–12 Hz, and DG showed power peaking at 6–8 Hz. CA1 showed power in 6–8 and 9–12 Hz frequency bands in both foraging modalities. Both of these frequencies can also be seen in the signals during foraging in Figure 2A. Velocity (Fig. 3B) was comparable in both conditions (F(1,5) = 1.87, n.s.). Average velocity was too low (∼15–16 cm/s) for speed or acceleration modulation of hippocampal theta frequency (Hinman et al., 2011; Kropff et al., 2021). Video recording was not usable for the visual sessions of one rat, so velocity analyses have n = 5 rats for visual and n = 6 rats for olfactory foraging (Fig. 3B).
Coherence reveals the degree of phase coordination between two oscillatory signals as a ratio of 0:1, with 1 being maximal coherence where the signals are identical and may be shifted in phase. We normalized coherence using the Fisher Z--transform, which results in a scale from zero to infinity for statistical comparisons (Kay and Freeman, 1998). Low-frequency coherent neural oscillations are suggested to facilitate coordinated activity among brain areas (Fell and Axmacher, 2011). Examination of coherence across the three behavioral conditions therefore allows us to understand how the network might configure itself to share activity flexibly depending on momentary behavioral or cognitive needs.
Resp-OB exhibits coherence high above chance levels with a peak at 4–6 Hz during home cage activity and two peaks at 6–8 and 9–12 Hz while foraging with visual or olfactory spatial cues (Fig. 4). Compared with Resp-OB coherence at 6–8 Hz during home cage activity, coherence among Resp-PC, Resp-DG, and Resp-CA1 shows a significantly smaller peak. Coherence among these pairs elevates in magnitude and increases in frequency to 8–12 Hz during foraging, especially with olfactory spatial cues between Resp-PC and Resp-CA1. A similar pattern is seen for these areas paired with OB, with OB-PC, OB-DG, and OB-CA1 showing coherence levels significantly above those during home activity at 8–12 Hz during foraging with visual and olfactory spatial cues.
More centrally, PC shows a distinct peak in coherence with DG and CA1 at 6–8 Hz during home cage activity, which persists during both foraging conditions (Fig. 4). PC-CA1 also shows coherence at 9–12 Hz significantly above home cage activity during foraging in both conditions. DG-CA1 shows peaks in the same frequency bands as PC does with each.
V1M exhibits negligible coherence during home cage activity with all other recorded areas. In both foraging conditions, V1M shows a distinct peak in coherence at 9–12 Hz with all recorded areas. V1M-OB and V1M-Resp also show coherence in the 6–8 Hz range.
Respiratory state
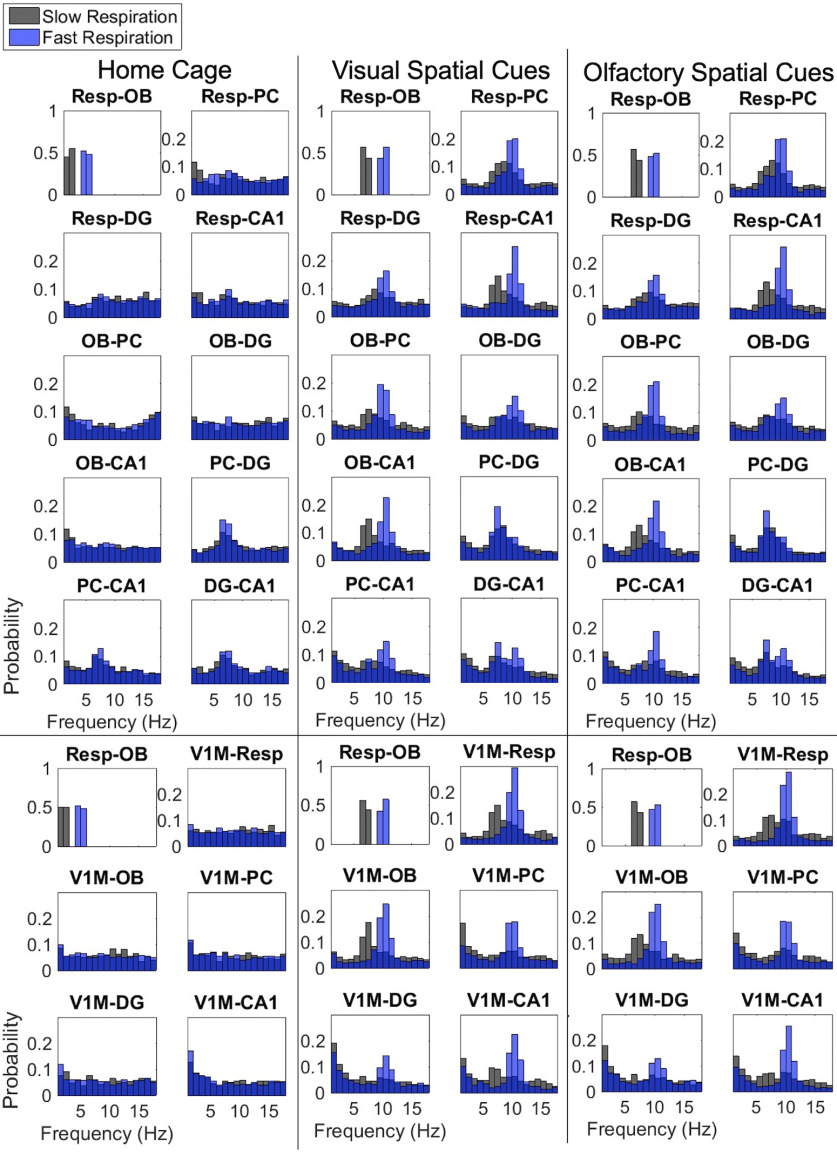
Because respiratory frequency can be used to track different behavioral states (Rojas-Líbano et al., 2014), we used this frequency to bin the data to understand possible network states that might be associated with different behavioral states associated with slow or fast respiration. The frequency of Resp-OB coherence was used as a proxy for respiratory frequency instead of the frequency of the respiratory signal, because coherence represents the measure of the frequency that the OB produces in response to input from the sensory nerve. Because we chose the peak frequency in each time window to bin the data by respiratory rate, using coherence also avoids bias to low frequencies represented by the 1/fα falloff of log(power) over log(frequency) of cortical signals. We indexed times from coherence spectrograms at which Resp-OB coherence peaked within select frequency bands. Data were binned in two respiratory frequency bands because average Resp-OB coherence occurred primarily in these two bands for each condition (Fig. 4). An example for foraging is shown in Fig. 2A,B. For home cage activity, the data were binned at periods of Resp-OB coherence at 1–3 Hz for slow respiration and at 4–6 Hz for fast respiration (Fig. 4). For both visual and olfactory foraging conditions, the data were binned at periods of Resp-OB coherence at 6–8 Hz for slow respiration and at 9–11 Hz for fast respiration. The probability of Resp-OB coherence is maximal at the frequency identified for each bin (Fig. 5).
Figure 5.
Probability of peak coherence after binning by respiratory rate. Bottom, Results for coherence with V1M electrodes (n = 4). Data are indexed at time points of peak Resp-OB coherence in select frequency bands, then the probabilities of peak coherence are calculated in 2 s moving windows stepped by 1 s.
In the home cage, few areas exhibit significantly coherent activity during either slow or fast respiratory states (Fig. 5), similar to that seen in average coherence plots across all states (Fig. 4). Resp-PC and Resp-CA1 show coherence that peaks at frequencies that match the respiratory bin (Fig. 5). Similar to average coherence (Fig. 4), PC-DG, PC-CA1, and DG-CA1 exhibit oscillations at 8 Hz in both slow and fast respiratory bins (Fig. 5). V1M shows minimal likelihood of coherence in the 2–20 Hz range with any other structure during either respiratory bin in the home cage.
During foraging, the frequency distributions of peak coherence between pairs of recorded areas are comparable across the two foraging conditions (Fig. 5). Most pairs show peak probability at a frequency that matches the respiratory bin, slow (6–8 Hz) or fast (9–11 Hz). This is especially true for the fast respiratory state, where most pairs, except PC-DG and DG-CA1, show high probability of peak coherence that matches that respiratory bin. PC-DG maintains highest probability of peak coherence at 8 Hz in both slow and fast respiratory bins, whereas DG-CA1 shows coherence in both slow and fast bands during the fast respiratory bin, again similar to average coherence (Fig. 4).
Spectral analysis—Granger causality
We used multivariate Granger causality, which relies on autoregressive modeling, for measures of directionality in functional connectivity (Barnett and Seth, 2014) as was used in reports on respiratory rhythm coherence with neural oscillations (Nguyen Chi et al., 2016). We estimated directionality in the frequency domain using Granger causality for each pair of brain areas across all sessions within a behavioral condition (home cage, olfactory, visual) for each subject. These spectra were averaged across subjects resulting in an averaged spectrum for each pair of brain areas and directional influence for each of the three behavioral conditions. Data were shuffled to determine chance Granger causality, as surrogate statistics are necessary for frequency analyses of Granger causality (Seth et al., 2015), and data were considered significant if >2 SDs above shuffled or chance Granger causality levels. All Granger causality values shown are significant, with peaks an order of magnitude greater than the significance threshold. Granger causality magnitude for 1–18 Hz frequencies was then transformed into arrow weights for network diagrams representing frequency and Granger causality magnitude between recorded areas. The range of Granger causality magnitudes will be described as weak for a Granger causality magnitude ∼0.05, moderate for ∼0.15, strong for ∼0.3, and very strong for ∼0.5 (Fig. 6).
Figure 6.
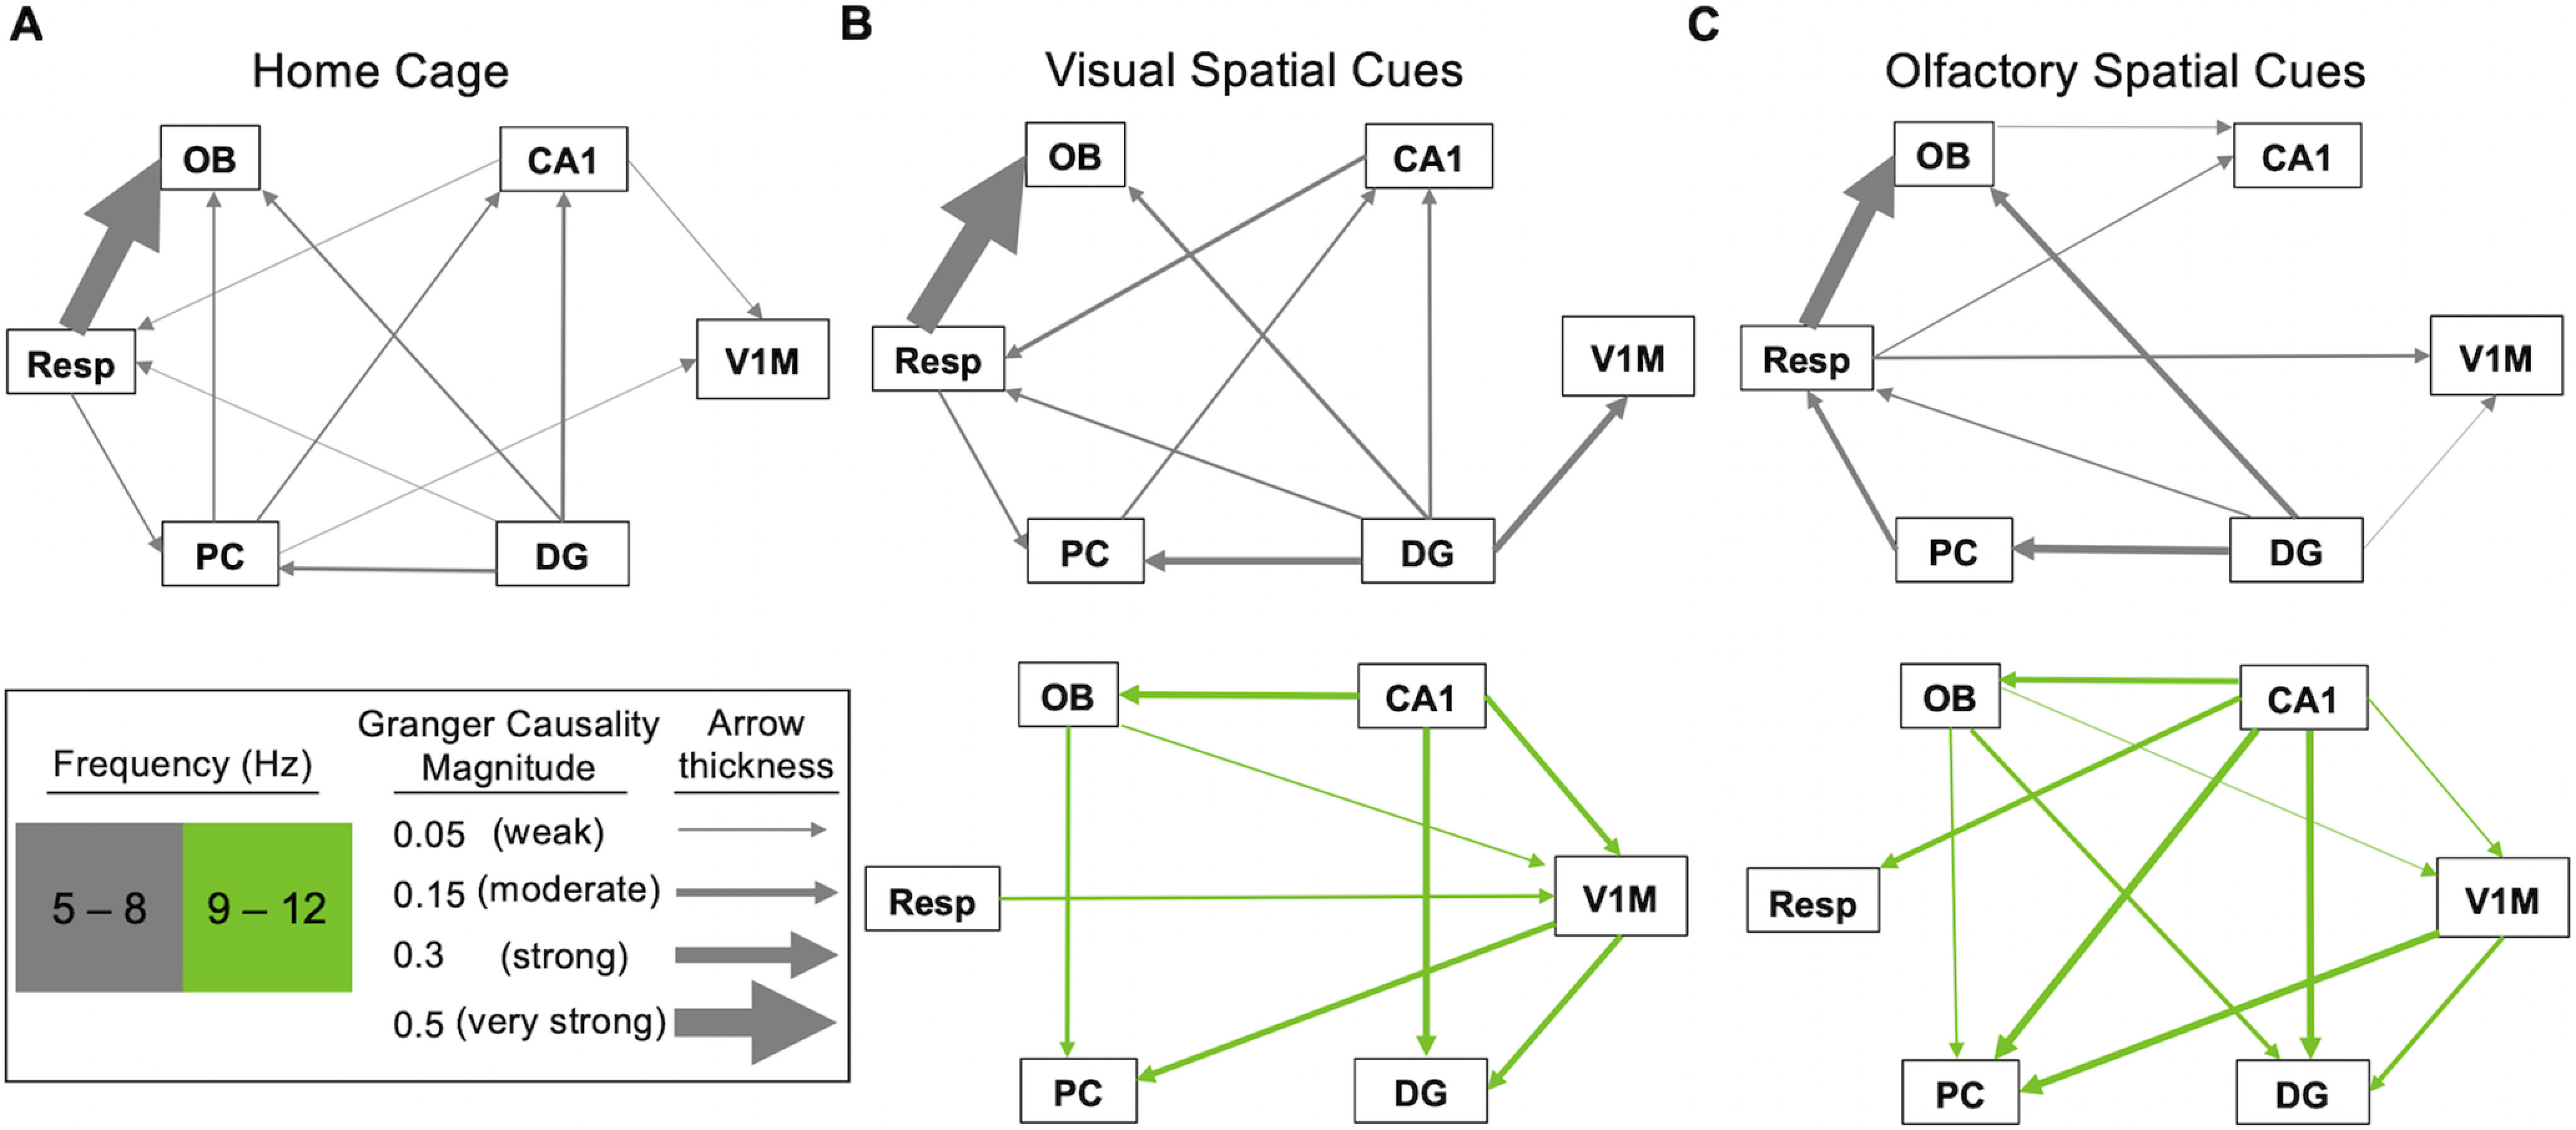
Granger causality across the three behavioral conditions. A–C, Direction of arrows shows which direction had greater causal influence; color denotes frequency, and the thickness of arrow denotes causal magnitude.
Peaks in Granger analysis mirror what appeared in the coherence results. During home cage activity (Fig. 6A), all causality peaks were in the 5–8 Hz frequency band. For pairs with Resp, there was very strong causality from Resp to OB, weak causality from Resp to PC, and weak causality from DG and CA1 to Resp. OB received weak causality from PC and DG. For other pairs with PC, there was weak causality from PC to CA1 and V1M. Within the hippocampus, there was weak to moderate causality from DG to CA1. CA1 showed weak causality on V1M. In summary, influences are relatively weak during home cage activity except for respiratory drive to OB, and there is minimal effective connectivity between the olfactory and hippocampal systems, except for the influence of DG onto PC. Furthermore, all directional interactions occur at 5–8 Hz during home cage activity.
Causal influences between brain areas during foraging emerged at frequency bands similar to those seen with coherence analysis (5–8 and 9–12 Hz). We begin with the lower frequency band (5–8 Hz; Fig. 6A–C, top row, gray arrows). The network of Granger connections seen in this band during visual foraging is similar to that in the home cage. There are some notable differences during olfactory foraging, which we highlight below. Respiratory influences on OB are very strong in home cage and visual foraging conditions and strong during olfactory foraging. Respiratory influences onto PC are weak, but they are strong onto OB in the home cage and during visual foraging; this interaction between Resp and PC is reversed during olfactory foraging. Both hippocampal areas show a weak influence on respiration in the home cage, which is weak to moderate from CA1 during visual foraging. During olfactory foraging, the influence reverses from Resp to CA1. In this lower frequency band, OB does not appear to have causal connections toward any higher cortical areas except for a weak influence on CA1 during olfactory foraging. In contrast, OB receives causal influence from PC in the home cage. Additionally, OB receives weak causal influence from DG in the visual foraging condition and moderate influence from DG in the olfactory foraging. PC shows a causal influence on CA1 in the home cage and during visual foraging, which is weaker in the home cage. DG shows moderate causal connections to PC in both foraging conditions but lacks causal connection to CA1 during olfactory foraging. Involvement of V1M in this circuit at lower frequencies varies between home cage and foraging conditions. CA1 and PC influence V1M weakly during home cage activity. During visual and olfactory foraging, only the DG shows a causal connection to V1M, which is stronger during visual foraging. Overall, the most prominent interactions in this frequency band (5–8 Hz) are consistent Resp to OB causality in all three conditions, stronger DG causality onto V1M during visual foraging, and DG causality onto PC in all three conditions but stronger onto OB during olfactory foraging.
A major difference between foraging and home cage activity was the emergence of high-frequency (9–12 Hz) Granger connections in both foraging conditions, similar to what we saw with coherence (Fig. 6B,C, bottom row, green arrows). Respiratory activity plays very different roles in the two foraging conditions in this frequency band. During olfactory foraging there is moderate causality on Resp from CA1, whereas during visual foraging Resp shows weak causality on V1M. OB shows weak causal influence on PC and receives moderate influence from CA1 in both olfactory and visual conditions. However, OB shows a moderate causal influence on DG only in the olfactory condition. PC receives moderate causality from V1M in both foraging conditions, and additionally moderate influence from CA1 in the olfactory condition. CA1 shows moderate causality toward DG in both visual and olfactory conditions. This analysis shows that hippocampal interactions with V1M are stronger during foraging with visual versus olfactory spatial cues. Specifically, CA1 shows moderate causality to V1M, which itself shows moderate causality to DG in the visual condition. These same directional interactions are weak in the olfactory condition. This is also true at 5–8 Hz for DG to V1M, as mentioned above.
Overall, the most notable interactions in the higher frequency band (9–12 Hz) are from CA1 toward OB, DG, and V1M during visual foraging, with the same interactions present (although weaker toward V1M) during olfactory foraging, plus the addition of CA1 influence on PC and Resp during olfactory foraging. Furthermore, OB causality on DG is only present in the olfactory foraging condition for this frequency band. The top-down influences from CA1 toward Resp and PC are present only in the olfactory foraging condition in this frequency band.
Phase-amplitude coupling
Above, we characterized distal interactions between brain areas that are important for sensation and memory, limited to coupling of coherent slower oscillations in rodent respiratory and theta frequency bands (4–12 Hz). We now address how these slow oscillations may organize faster oscillations that represent temporal organization of local neuronal populations (Singer, 1993; Canolty et al., 2006; Jensen and Colgin, 2007; Womelsdorf et al., 2007; Tort et al., 2008). To do this, we analyzed phase-amplitude coupling of low- and high-frequency oscillations during home cage activity and foraging and compare respiratory and theta modulation of faster cortical oscillations in both foraging conditions. We focus our analysis on respiratory and theta phase-amplitude coupling between primary sensory and hippocampal areas, along with PC interactions. Phase-amplitude coupling is presented in comodulogram plots, which represent in pseudocolor scale the MI values, by pairs of areas shown with the phase of one area to the amplitude modulation of all others, at phase frequencies of 4–14 Hz and amplitude frequencies of 15–250 Hz. Each comodulogram is from data concatenated across subjects by condition. Subtracted from these are the average plus 2 SDs of comodulograms from shuffled data, so all phase-amplitude couplings that are not dark blue Figs. 7–10 are significant at p < 0.05.
Figure 7.
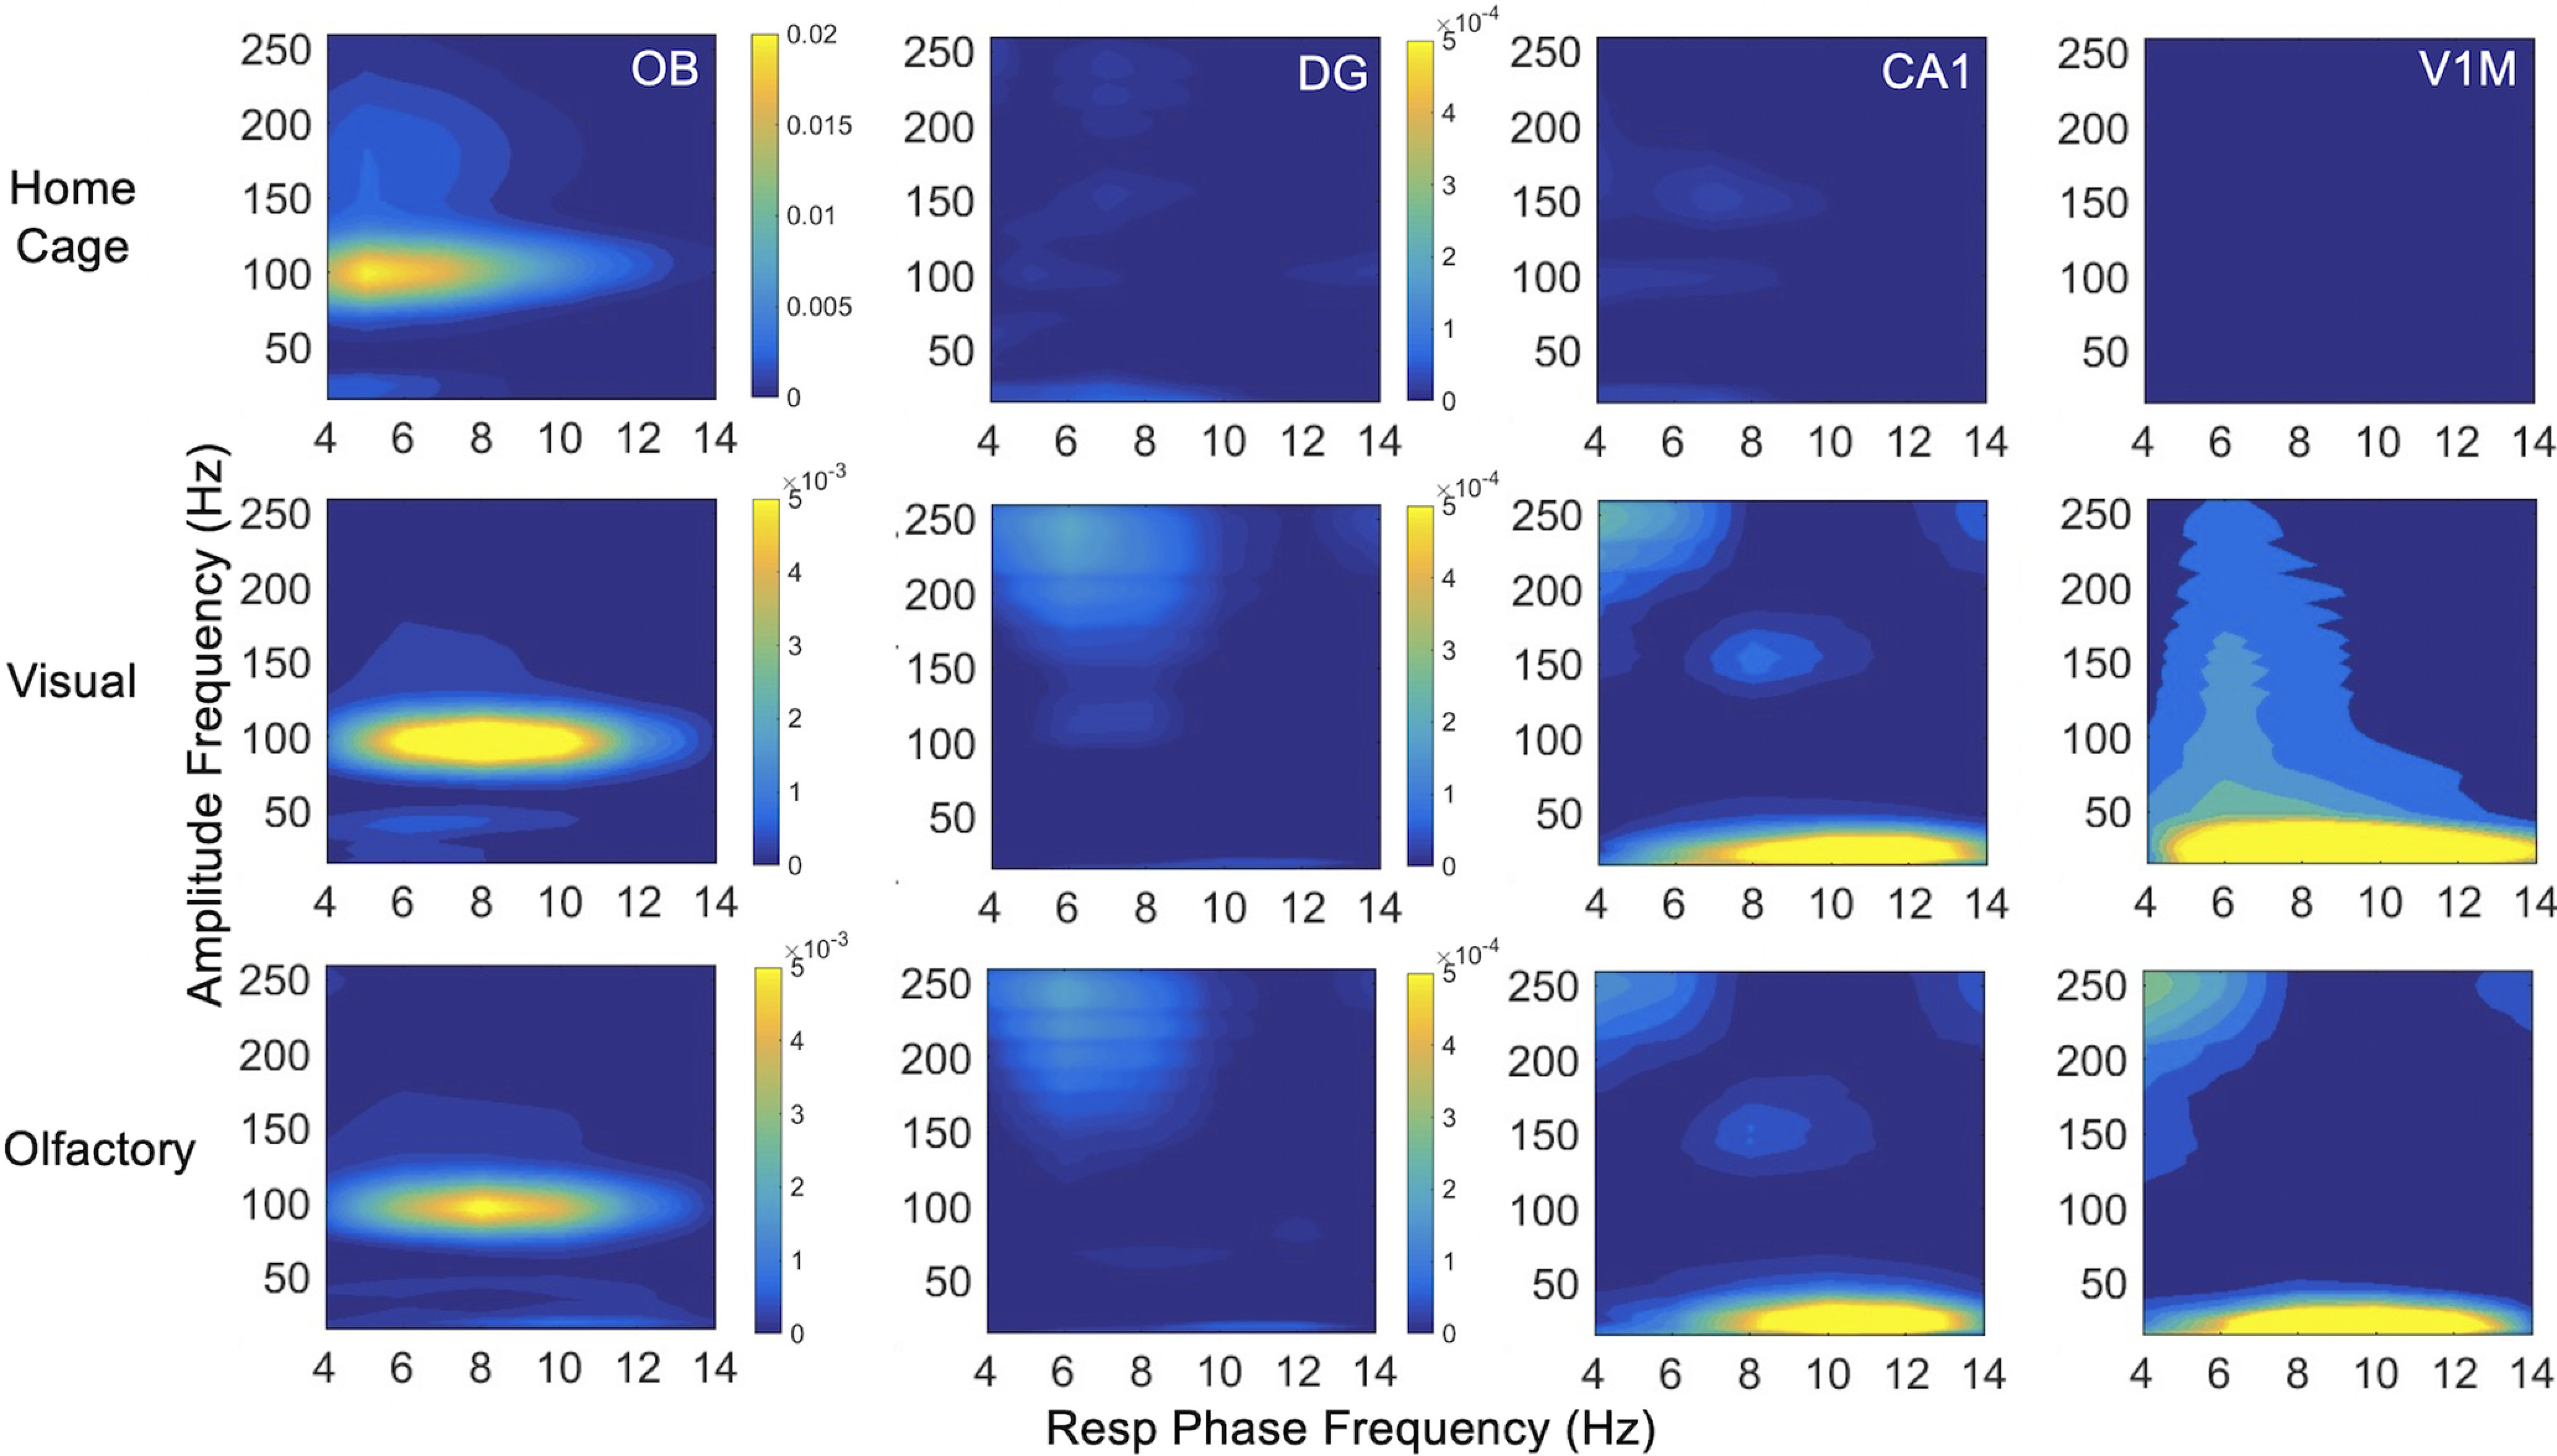
Phase-amplitude coupling with respiratory phase to primary olfactory and visual areas. Comodulograms are shown for respiratory phase frequency at 4–14 Hz with OB, DG, CA1, and V1M amplitude frequency at 15–250 Hz. Note color axis for comodulogram values are larger and vary between conditions for Resp-OB. Values have been subtracted by 2 SDs of shuffled comodulograms, so all couplings that are not dark blue are significant at p < 0.05.
Figure 10.
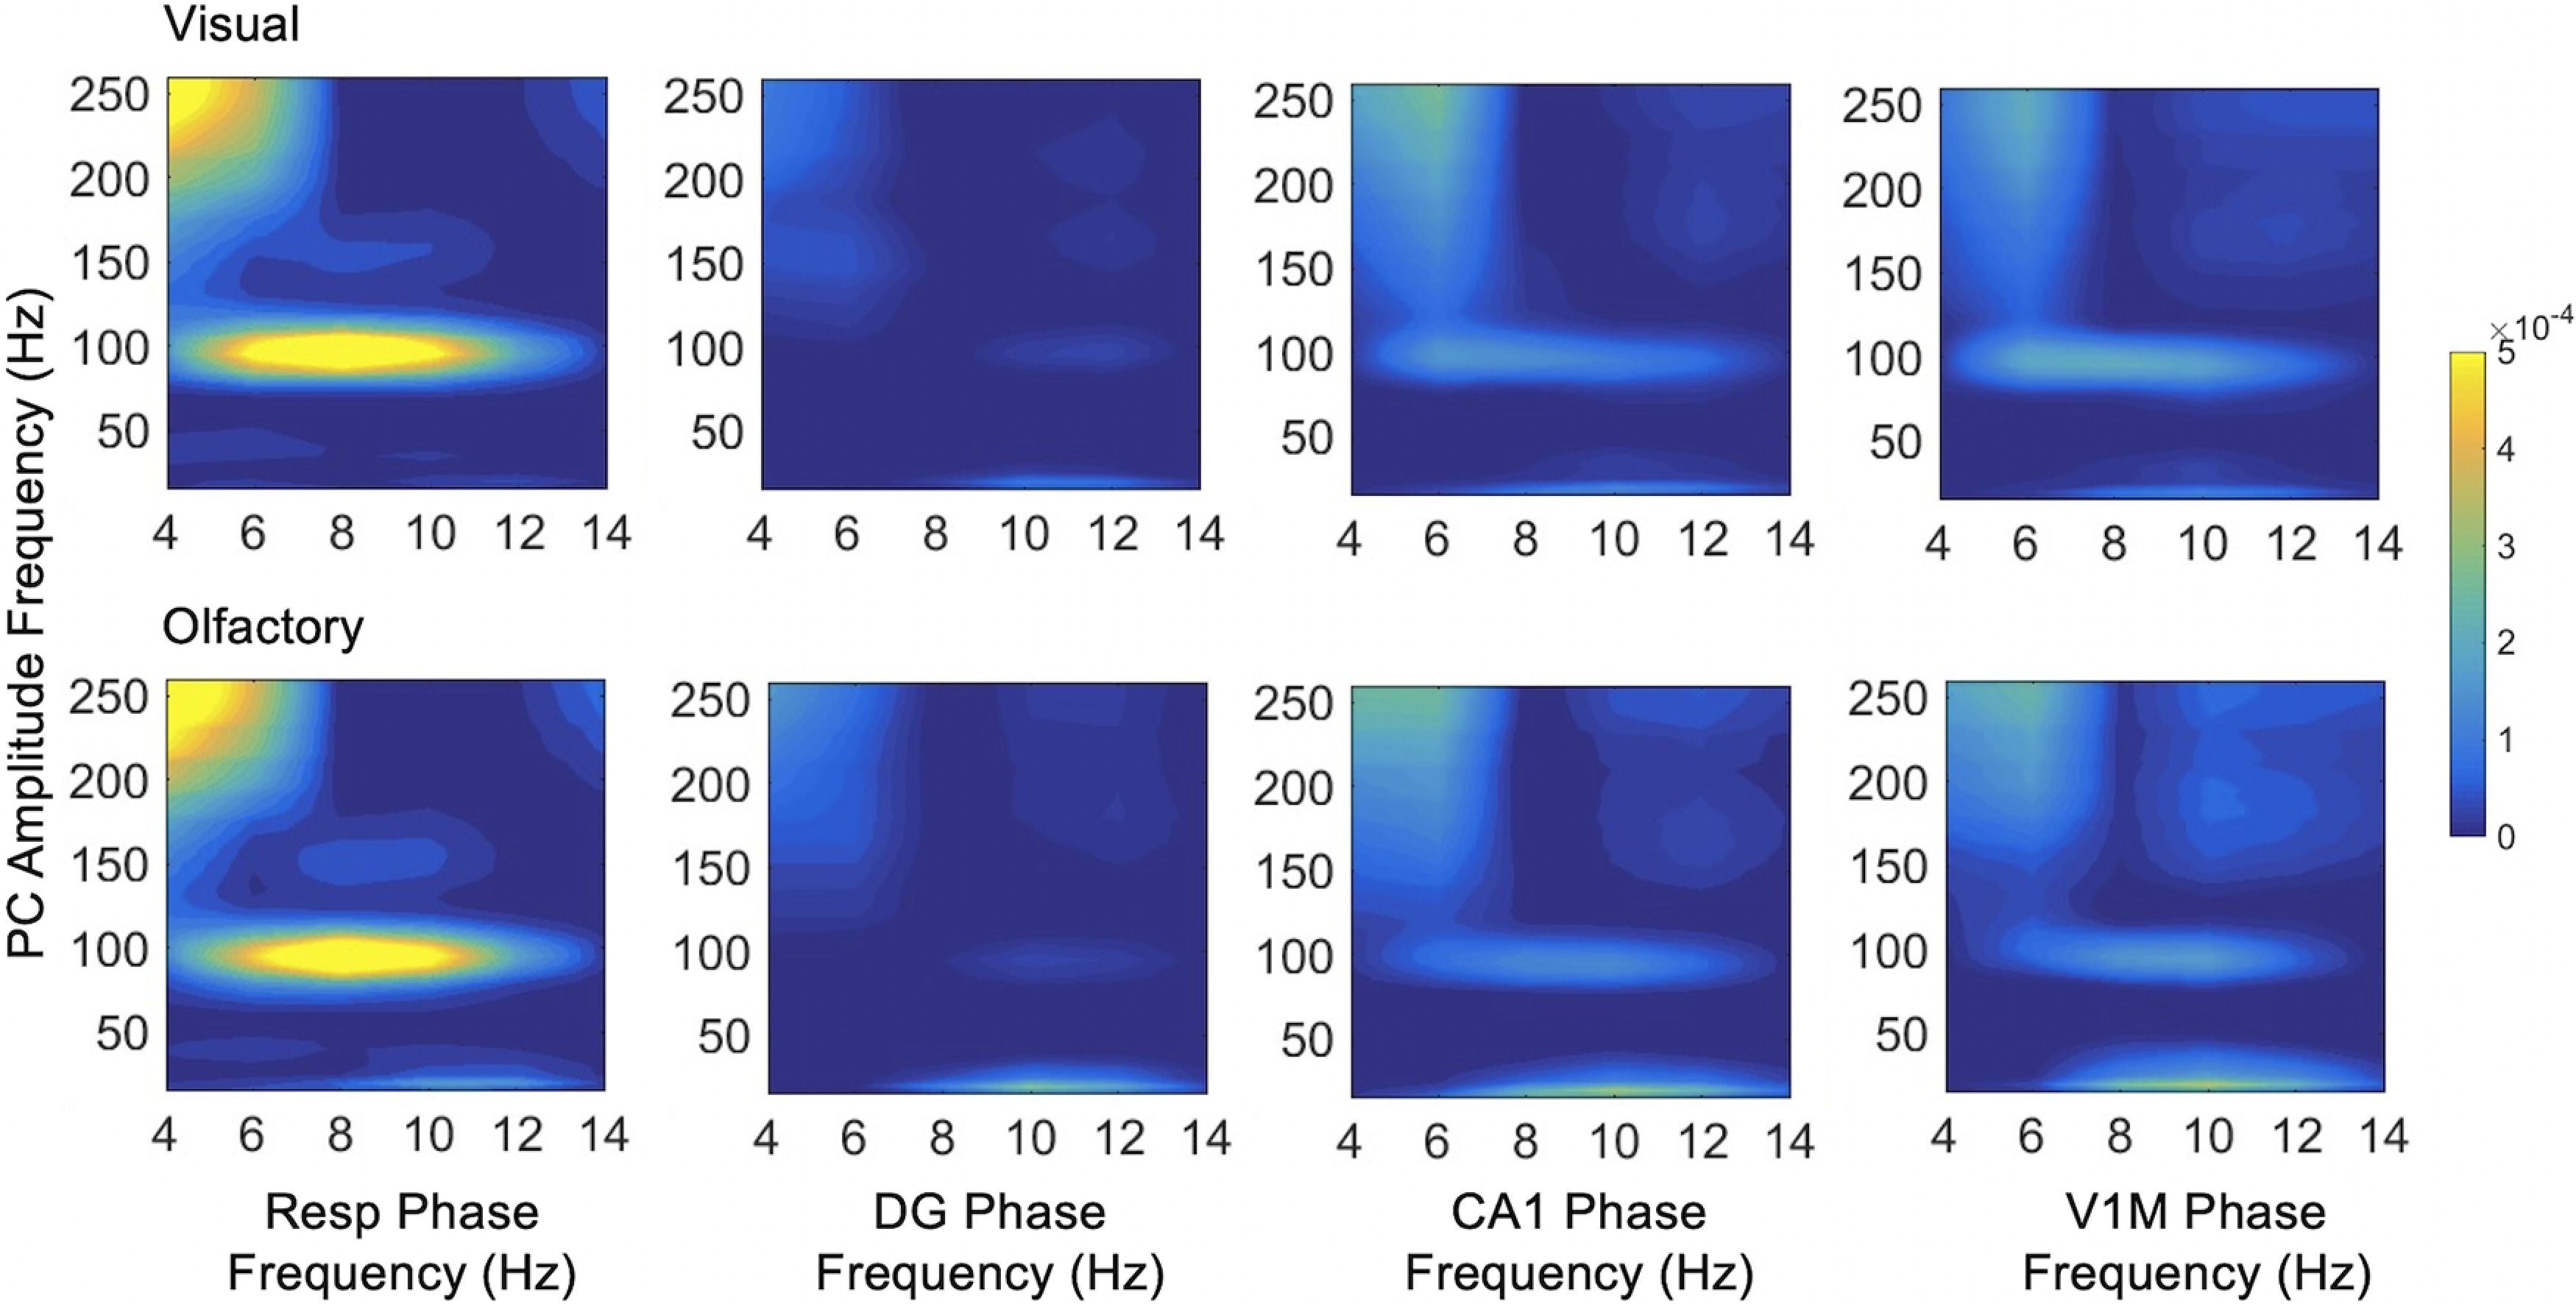
Phase-amplitude coupling between all areas and PC. Comodulograms are shown for the phase frequency of all areas at 4–14 Hz with PC amplitude frequency at 15–250 Hz.
During home cage activity and both foraging conditions, the phase of respiration modulates the amplitude of fast gamma oscillations (∼100 Hz) in OB (Fig. 7), as expected from previous studies (Rojas-Líbano et al., 2014). Respiratory phase-amplitude coupling is absent in hippocampus and V1M in the home cage. During both foraging conditions, respiratory phase-amplitude coupling emerges with high frequency (>100 Hz) in both hippocampal areas and with CA1 beta oscillations. V1M beta oscillations are also modulated by respiratory phase (15–35 Hz) amplitude in both foraging conditions.
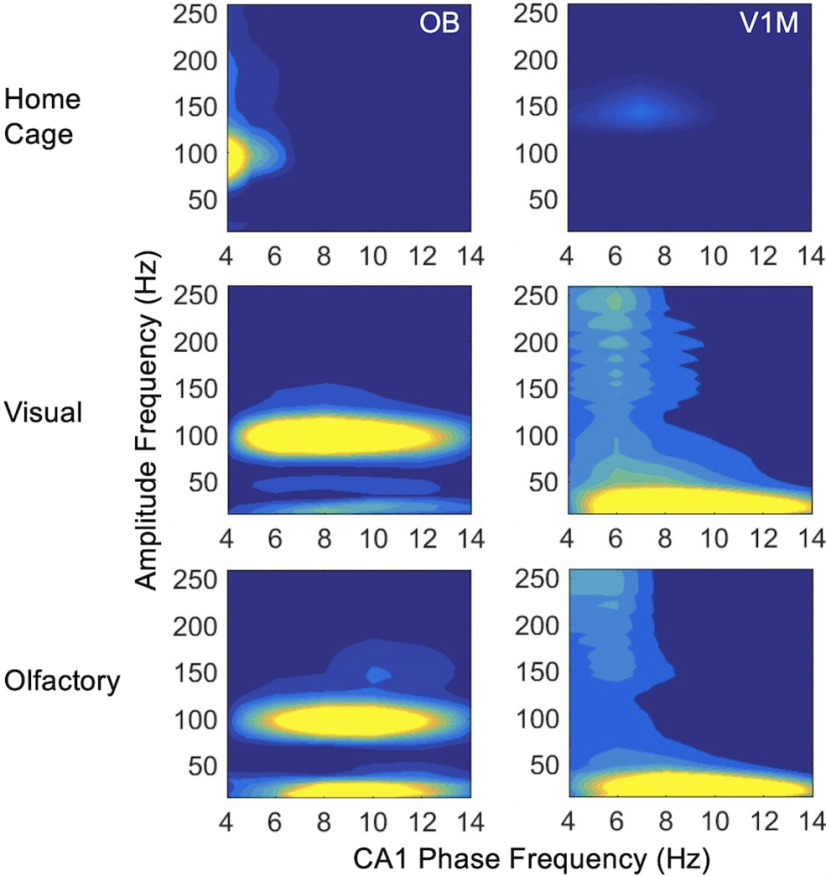
Slow hippocampal oscillations also couple with faster oscillations in primary olfactory and visual areas (Fig. 8). CA1 6–8 Hz oscillations couple with the amplitude of high-frequency oscillations (>100 Hz) in V1M in the home cage and both foraging conditions. CA1 couples with high gamma (∼100 Hz) oscillations in OB and with V1M beta oscillations (15–35 Hz) in a wide band of low frequencies during foraging in both conditions. PC low-frequency activity is coupled with high-frequency hippocampal oscillations (Fig. 9). The phase of 6–8 Hz PC oscillations couples with DG amplitude at 100–150 and 200–250 Hz in all three conditions, although more prominently during foraging. Note that this was the slower frequency band at which PC-DG showed high probability peak coherence even while respiration was fast at 9–11 Hz (Fig. 5) and at which DG showed Granger causality toward PC (Fig. 6). PC phase at 6–8 Hz also couples with CA1 fast oscillations at 150 Hz in all three conditions, again more prominently during foraging than in the home cage. PC phase at 8–12 Hz couples with CA1 beta oscillations in both foraging conditions (Fig. 9). This overlaps with the faster frequency band (9–11 Hz) at which CA1 showed moderate Granger causal interactions to many areas, including PC (Fig. 6) and at which PC-CA1 and most other pairs exhibited peak coherence (Figs. 4–5).
Figure 8.
Phase-amplitude coupling between hippocampus (CA1) and primary olfactory and visual areas. Comodulograms are shown for CA1 phase frequency at 4–14 Hz with OB (left) and V1M (right) amplitude frequency at 15–250 Hz.
Figure 9.
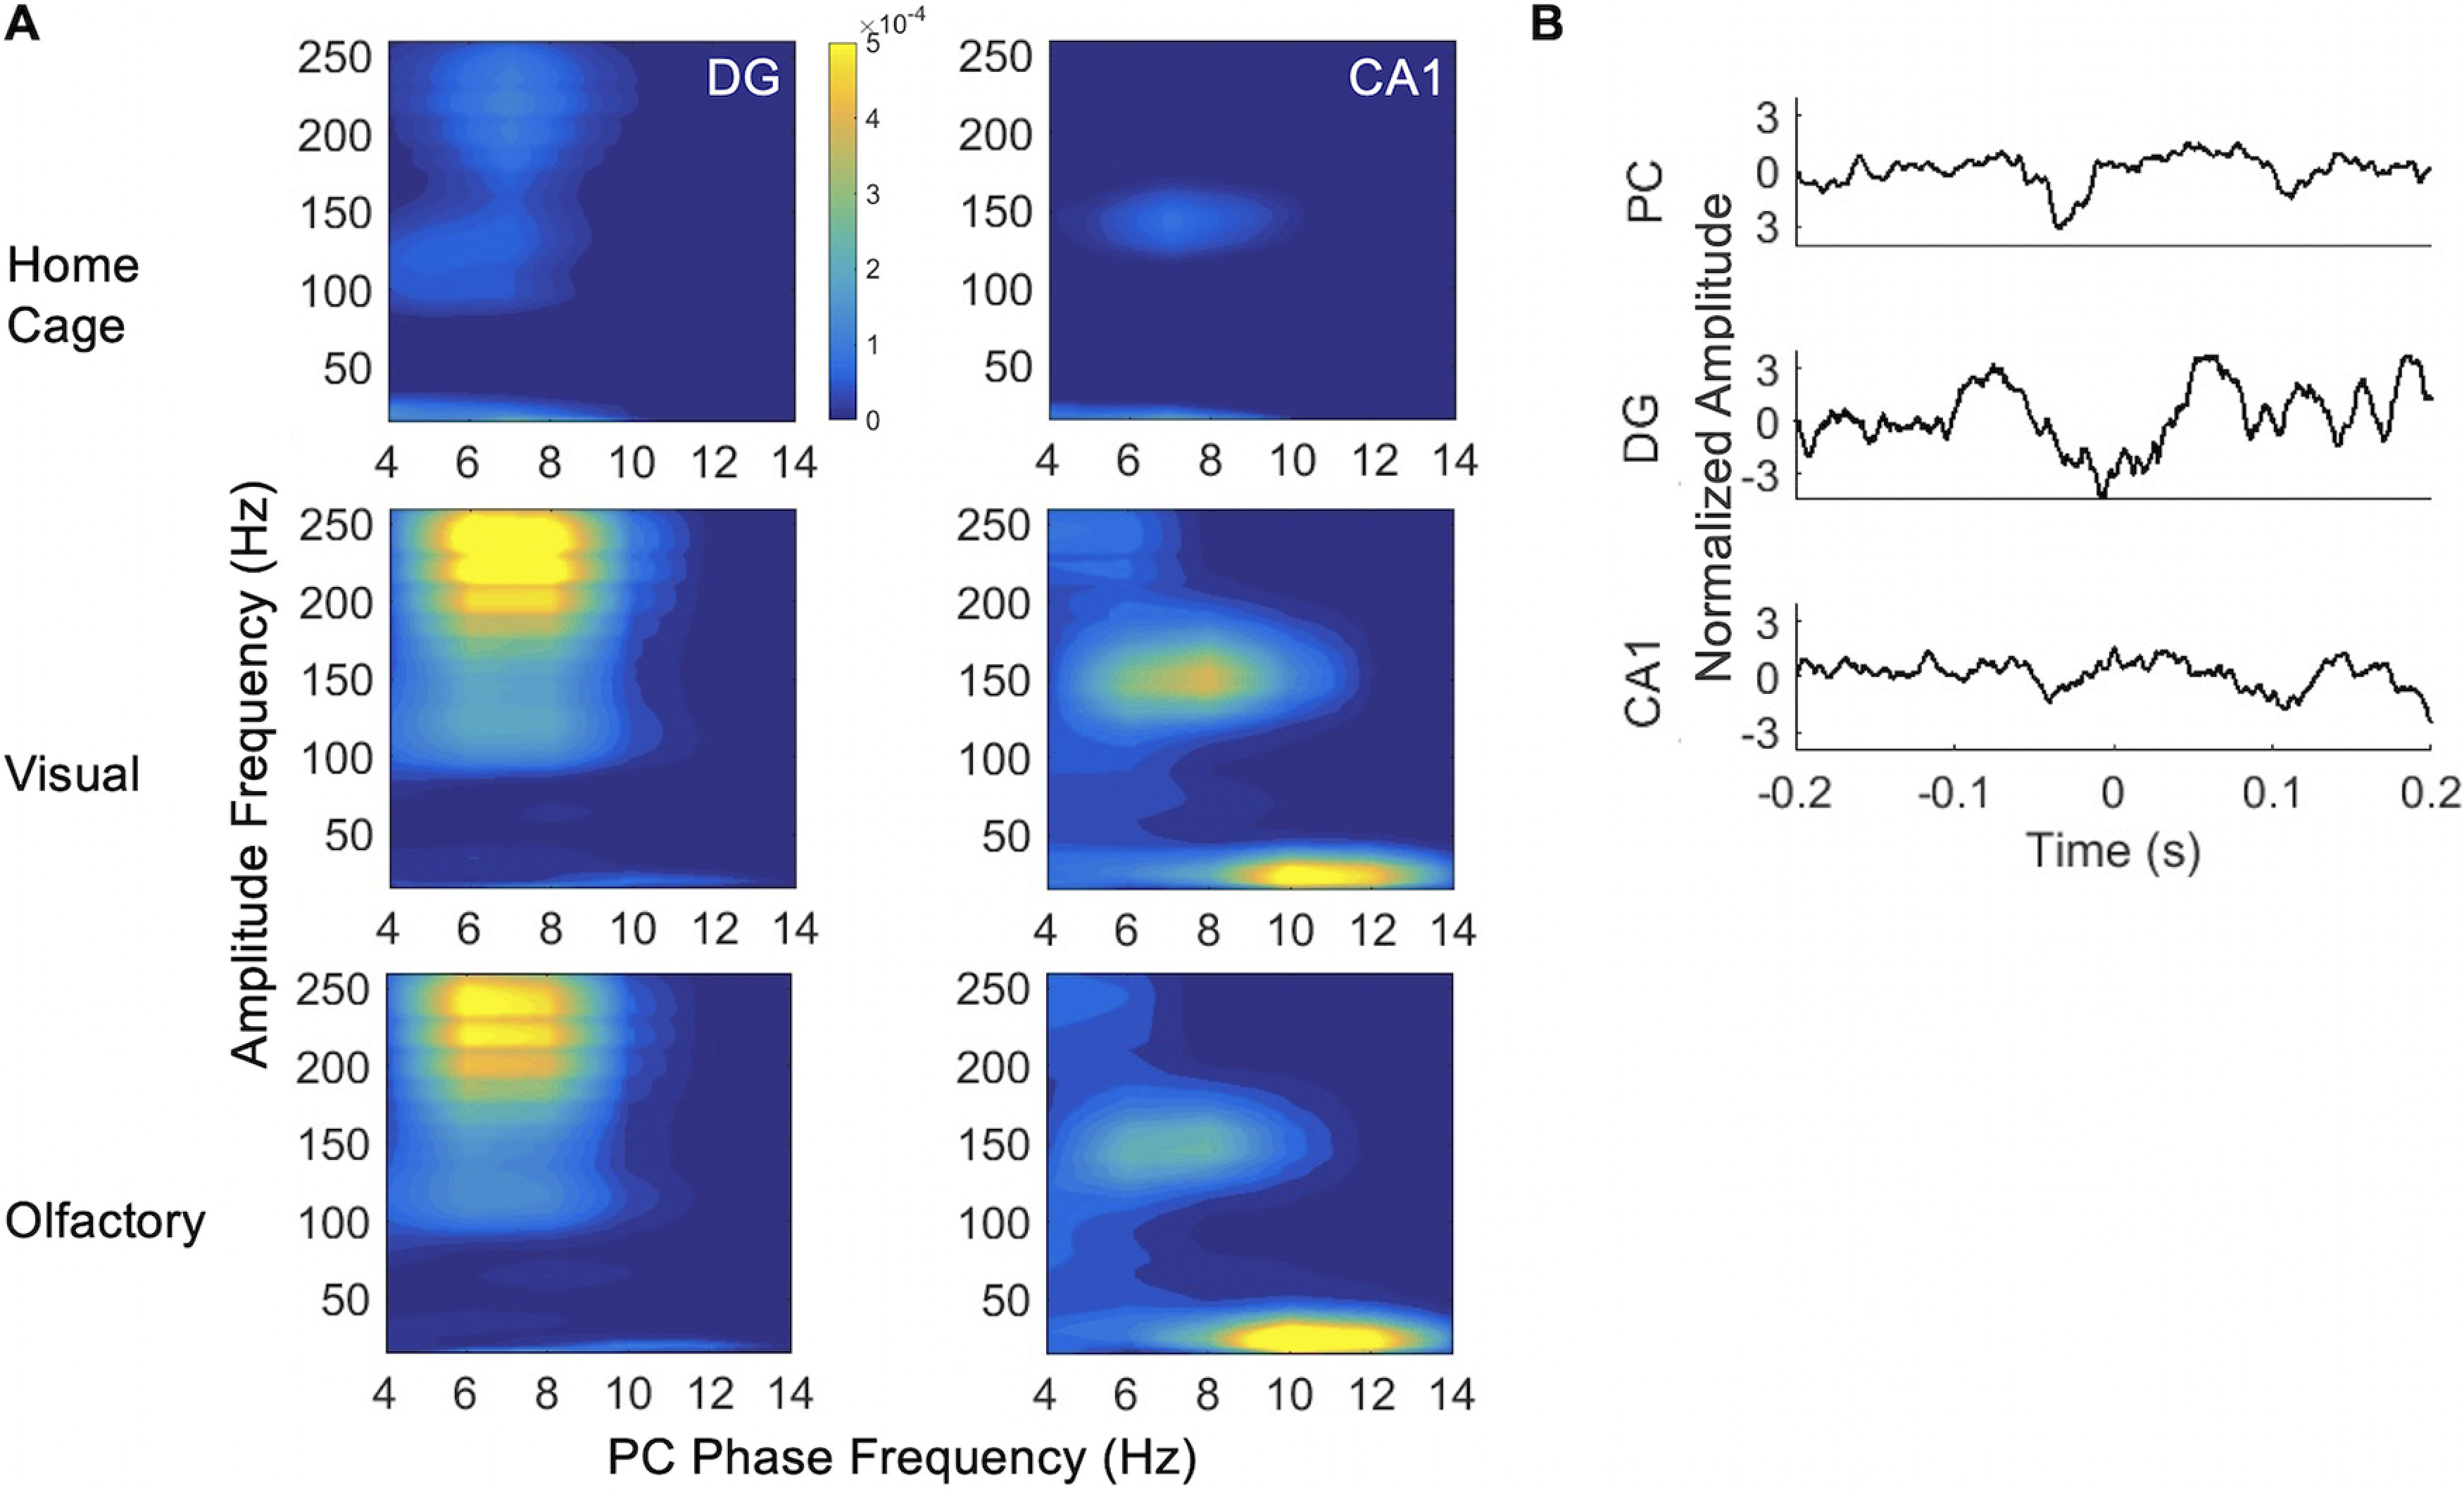
Phase-amplitude coupling between PC and hippocampus. A, Comodulograms are shown for PC phase frequency at 4–14 Hz with DG (left) and CA1 (right) amplitude frequency at 15–250 Hz. B, Example of signals centered around high-frequency ripple detected in CA1 associated with what appears to be a PC sharp wave.
PC fast frequencies did not couple with slow frequencies in other recorded areas in the home cage, but fast PC oscillations did show coupling to the phase of slow respiratory and hippocampal rhythms during both types of foraging (Fig. 10). High gamma (∼100 Hz) oscillations in PC were coupled to 6–12 Hz respiratory, CA1, and V1M phase across a wide range of low frequencies. OB slow oscillations 4–8 Hz modulated PC amplitude at 100 Hz gamma (data not shown) similarly to respiratory modulation.
Phase-amplitude coupling demonstrates that respiratory and theta network interactions occur beyond those at overlapping frequencies, as reported above for coherence and Granger causality, with dynamic and robust modulation of fast oscillatory amplitude representative of more local activity. The phase of slow respiratory rhythms modulates the amplitude of fast oscillations in primary sensory areas across the entire range of respiratory frequencies at 4–12 Hz. For PC oscillations, the slower end of this frequency band at 6–8 Hz modulates fast hippocampal oscillations, and the faster 9–12 Hz band modulates hippocampal beta amplitude. These higher frequency modulation effects were not detectable in analyses of one-to-one frequency interactions using coherence or Granger causality. Altogether, primary sensory and hippocampal LFPs appear to interact directly in respiratory and theta frequencies, along with the modulation of faster local activity in primary sensory and hippocampal areas by ongoing slower respiratory and theta rhythms.
Discussion
In this study, we address dynamic network configurations associated with different perceptual states. Our results support the hypothesis that respiration works dynamically with hippocampal theta to coordinate neural activity across multiple cortical areas (Tort et al., 2018a). We find a set of frequencies, coupling patterns, and interaction statistics that may define the network states associated with home cage behavior and foraging in two different sensory contexts, olfaction and vision.
Network interactions depend on behavioral state
There was a clear change in network connectivity patterns based on behavioral context, with fewer significant interactions during home cage activity compared with foraging conditions. During foraging with either olfactory or visual cues, we found distal interactions among respiration, olfactory, visual, and hippocampal areas. Coherence among these areas was elevated in both foraging conditions compared with home cage activity in two frequency bands (6–8 and 9–12 Hz), matching the frequency range in recent reports of respiratory coupling between hippocampal and neocortical areas (Tsanov et al., 2014; Rojas-Líbano et al., 2018; Tort et al., 2018b). Resp to OB causality is very strong in the home cage and during visual foraging, and strong during olfactory foraging, possibly because of greater afferent feedback on the bulb in the olfactory condition. This is supported in our results by increased causality onto OB from DG in the same frequency band. We saw effects of modality on directional interactions in the 9–12 Hz frequency band. Causal influence at 9–12 Hz from CA1 to V1M increased during visual foraging and emerged from OB to DG only during olfactory foraging (Fig. 6). Furthermore, we found CA1 causal influence on respiration during olfactory foraging and respiratory influence on V1M during visual foraging.
The widespread coherence and directional interactions during foraging suggests respiratory and theta oscillations may play important roles in coordinating sensory information with hippocampal activity for navigation and memory, as suggested in other behavioral contexts (Macrides et al., 1982; Forbes and Macrides, 1984; Vanderwolf, 1992; Kay, 2005). Motor activity related to navigation, including sensorimotor whisking and head and orofacial orientation, shows coherence with respiration (Moore et al., 2013; Kleinfeld et al., 2014), and motor signals show up in sensory areas (Parker et al., 2020), which suggests that there may be additional sensorimotor pathways by which the distal coherence reported here could occur.
Potential mediators of widespread respiratory and theta interactions
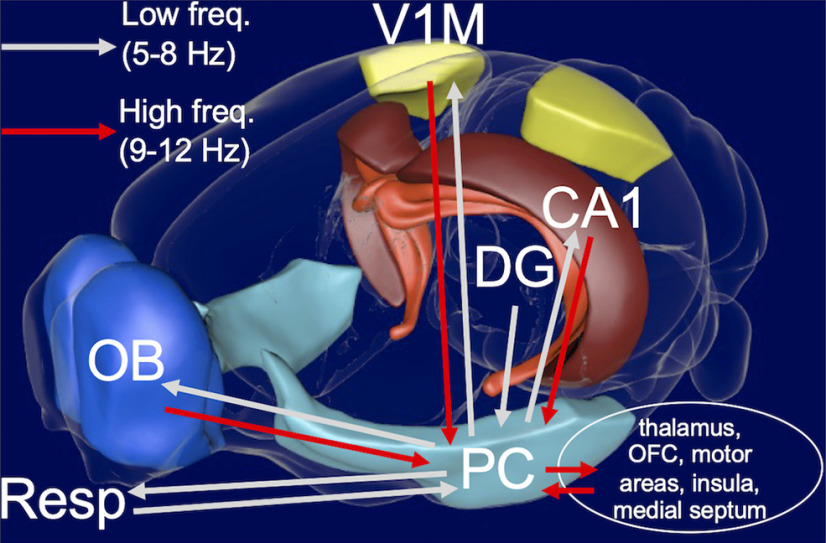
PC interacted flexibly with olfactory and hippocampal systems. Specifically, PC showed 6–8 Hz coherence with HPC in the home cage when other regions showed no coherence. PC also interacted with HPC at 6–8 Hz during foraging in periods of fast respiration (9–12 Hz), when all other pairs except for DG-CA1 exhibited coherence only at 9–12 Hz (Fig. 5). Our results suggest that PC is richly and dynamically involved in this network, confirming its anatomic role as a conduit for rhythmic drive across systems in lower respiratory and theta ranges. In the upper range of these rhythms, PC appears to receive but not drive influence in the network (Fig. 6), which suggests at least two interpretations. One possibility is that this convergence onto PC in the higher frequency range engages the multisensory and associative nature of the PC (Johnson et al., 2000; Kay and Sherman, 2007). In this scenario, the connectivity and convergence from sensory and hippocampal inputs facilitates transformation of unit activity that is not evident in the low-frequency band of the LFP. We found that high-frequency activity in PC is coordinated with low-frequency rhythms in OB, CA1, and V1M (Fig. 10), which signifies underlying organization of unit activity (Eeckman and Freeman, 1990). Another possibility is that we have not recorded from areas that might be recipients of this convergence from PC at higher theta and respiratory frequencies. The most obvious targets would be medial septum, amygdala, motor areas (Hermer-Vazquez et al., 2007), mediodorsal thalamus, insula, and orbitofrontal cortex (Fig. 11).
Figure 11.
Schematic highlighting PC interactions based on frequency. Most low-frequency interactions (light gray arrows) were from the PC, whereas most high-frequency interactions (red arrows) were toward the PC. The high-frequency input to PC may be propagated to other areas such as thalamus, orbitofrontal cortex (OFC), motor areas (e.g., striatum), and the medial septum. Figure was obtained from the Scalable Brain Atlas Composer (Lein et al., 2007; Bakker et al., 2015).
Both bands (6–8 and 9–12 Hz) at which we report interactions between LFPs and nasal respiration are within the range of rodent hippocampal theta (Hinman et al., 2011; Tort et al., 2018b) and respiration (Rojas-Líbano et al., 2014) and overlap with human theta (4–8 Hz) and alpha (8–13 Hz) frequencies (Zelano et al., 2016). OB and especially CA1 both appear to drive this faster 9–12 Hz frequency during foraging as shown in the Granger causality results (Fig. 6B,C, bottom row). Medial septum is reciprocally connected to olfactory and hippocampal areas including OB, PC, DG, and CA1 via CA3 (Truchet et al., 2002) and is a generator of hippocampal theta (Buzsáki, 2002). Additionally, medial septum receives projections from the brainstem pontine respiratory group (Cornwall et al., 1990). A study using a similar open-field foraging task showed fast respiratory coupling with CA1 in the 9–12 Hz band, which was shifted to 6–8 Hz with muscimol blockade of medial septum (Tsanov et al., 2014). This suggests that the faster frequency of coupling we saw here only during foraging and not home cage activity may be mediated by the medial septum, although it may also be driven by higher frequency sniffing (Rojas-Líbano et al., 2014).
Notably, the faster frequency coupling at 9–12 Hz was more prominent in this study for coherence during foraging, especially in the olfactory condition (Fig. 4) and when data were binned by respiratory rate (Fig. 5). Thus, this faster frequency band at 9–12 Hz, previously characterized in OB activity during active sniffing associated with olfactory learning (Kay and Laurent, 1999; Kepecs et al., 2007; Wesson et al., 2009; Ranade et al., 2013), may be optimal for olfactory respiratory coherence with hippocampal and neocortical areas.
Modulation of high-frequency oscillations
High-frequency oscillations (>100 Hz) were present in DG, CA1, and V1M. These oscillations were coupled to the phase of PC and CA1 oscillations at 6–12 Hz during foraging behavior. DG and CA1 showed phase-locked oscillations at 150 Hz to 6–8 Hz PC oscillations (Fig. 9). This coupling occurred at a slower frequency than the 8–12 Hz PC oscillations that coupled to CA1 beta, suggesting possibly different pathways supporting these distinct couplings. Examination of the data suggest that these may be sharp wave ripples (Fig. 9). Sharp wave ripples are extremely synchronous events largely driven by hippocampal circuits that fall within this frequency range (100–250 Hz) and also occur in the piriform cortex with similar behavioral correlates as hippocampal sharp wave ripples in regard to planning and memory consolidation (Manabe et al., 2011; Barnes and Wilson, 2014; Narikiyo et al., 2014; Buzsáki, 2015). PC sharp wave ripples appear to occur separately from hippocampal sharp waves (Manabe et al., 2011; Narikiyo et al., 2014), although some coupling has been described (Buzsáki, 2015).
The high-frequency of DG oscillations shown here is within range of pathologic ripples that occur above 200 Hz in epileptic rat models and humans (Bragin et al., 1999, 2004; Buzsáki, 2015). However, we saw no signs of seizure activity in the data, and the CA1 oscillations centered at normal sharp wave ripple frequency of 150 Hz argues against this. It is notable this high-frequency hippocampal activity is modulated by the phase of PC oscillations at 6–8 Hz, the same frequency where PC-DG showed coherence in all three conditions, whereas this coupling with faster DG oscillations that represent more local activity only emerged during foraging. Furthermore, no coherence or causality between any sites were seen in high-frequency bands apart from OB-PC gamma coherence (data not shown).
Study limitations and future directions
The design of this study attempted to compare interactions among anatomic nodes in a large network during somewhat naturalistic behavioral conditions. This leads to some complexity in the results—there are many interactions to report, and natural foraging behavior is difficult to control and quantify. Some limitations include the presence of olfactory cues in the visual condition (e.g., chocolate sprinkles), although place cells should have been formed based on a visual map with the use of the salient visual spatial cues, and adult rats perform no worse on a spatial task when olfactory cues are removed (Rossier and Schenk, 2003). In the olfactory foraging condition, visual cues should be minimized by using only red light, which is outside of the rat visual spectrum. In an upcoming report we will describe these same effects during spatial learning to characterize perceptual differences more closely. Another limitation was the lack of interventions on central respiratory areas or the medial septum to parse out whether respiratory coherence is driven primarily by nasal airflow or central pattern generators in the brainstem. We have focused on the involvement of PC as a hub and multisensory structure, but clearly there may be other ways to interpret very complex interactions among the areas and frequency bands.
In conclusion, we show dynamic interactions between primary sensory and limbic areas, which are closely related to respiratory rate and depend on the behavioral and perceptual conditions of freely exploring rats. Findings here lay groundwork for future studies to parse out roles of respiratory and hippocampal rhythms for interregional network communication in navigation and memory.
Footnotes
This work was supported by the National Institute on Deafness and Other Communication Disorders Grant R01 DC014367 and the Lifelong Learning Machines (L2M) program at the Defense Advanced Research Projects Agency/Microsystems Technology Office Grant HR0011-18-2-0024 (L.M.K.). We thank Shane T. Peace for assistance with surgeries and Boleslaw L. Osinski for assistance with Granger causality code.
The authors declare no competing financial interests.
References
- Agarwal G, Stevenson IH, Berényi A, Mizuseki K, Buzsáki G, Sommer FT (2014) Spatially distributed local fields in the hippocampus encode rat position. Science 344:626–630. 10.1126/science.1250444 [DOI] [PMC free article] [PubMed] [Google Scholar]
- Arshamian A, Iravani B, Majid A, Lundström JN (2018) Respiration modulates olfactory memory consolidation in humans. J Neurosci 38:10286–10294. [DOI] [PMC free article] [PubMed] [Google Scholar]
- Bakker R, Tiesinga P, Kötter R (2015) The scalable brain atlas: instant web-based access to public brain atlases and related content. Neuroinform 13:353–366. [DOI] [PMC free article] [PubMed] [Google Scholar]
- Bao X, Gjorgieva E, Shanahan LK, Howard JD, Kahnt T, Gottfried JA (2019) Grid-like neural representations support olfactory navigation of a two-dimensional odor space. Neuron 102:1066–1075. e5. 10.1016/j.neuron.2019.03.034 [DOI] [PMC free article] [PubMed] [Google Scholar]
- Barnes DC, Wilson DA (2014) Sleep and olfactory cortical plasticity. Front Behav Neurosci 8:1–11. [DOI] [PMC free article] [PubMed] [Google Scholar]
- Barnett L, Seth AK (2014) The MVGC multivariate Granger causality toolbox: a new approach to Granger-causal inference. J Neurosci Methods 223:50–68. 10.1016/j.jneumeth.2013.10.018 [DOI] [PubMed] [Google Scholar]
- Bedrosian TA, Vaughn CA, Weil ZM, Nelson RJ (2013) Behaviour of laboratory mice is altered by light pollution within the housing environment. Anim Welf 22:483–487. 10.7120/09627286.22.4.483 [DOI] [Google Scholar]
- Behan M, Haberly LB (1999) Intrinsic and efferent connections of the endopiriform nucleus in rat. J Comp Neurol 408:532–548. [DOI] [PubMed] [Google Scholar]
- Bettis TJ, Jacobs LF (2013) Sex differences in memory for landmark arrays in C57BL/J6 mice. Anim Cogn 16:873–882. 10.1007/s10071-013-0619-x [DOI] [PubMed] [Google Scholar]
- Bokil H, Andrews P, Kulkarni JE, Mehta S, Mitra PP (2010) Chronux: a platform for analyzing neural signals. J Neurosci Methods 192:146–151. 10.1016/j.jneumeth.2010.06.020 [DOI] [PMC free article] [PubMed] [Google Scholar]
- Bota M, Sporns O, Swanson LW (2015) Architecture of the cerebral cortical association connectome underlying cognition. Proc Natl Acad Sci U S A 112:E2093–E2101. 10.1073/pnas.1504394112 [DOI] [PMC free article] [PubMed] [Google Scholar]
- Bragin A, Engel J, Wilson CL, Fried I, Mathern GW (1999) Hippocampal and entorhinal cortex high-frequency oscillations (100-500 Hz) in human epileptic brain and in kainic acid-treated rats with chronic seizures. Epilepsia 40:127–137. 10.1111/j.1528-1157.1999.tb02065.x [DOI] [PubMed] [Google Scholar]
- Bragin A, Wilson CL, Almajano J, Mody I, Engel J (2004) High-frequency oscillations after status epilepticus: epileptogenesis and seizure genesis. Epilepsia 45:1017–1023. 10.1111/j.0013-9580.2004.17004.x [DOI] [PubMed] [Google Scholar]
- Bressler SL, Coppola R, Nakamura R (1993) Episodic multiregional cortical coherence at multiple frequencies during visual task performance. Nature 366:153–156. 10.1038/366153a0 [DOI] [PubMed] [Google Scholar]
- Buzsáki G (2002) Theta oscillations in the hippocampus. Neuron 33:325–340. 10.1016/s0896-6273(02)00586-x [DOI] [PubMed] [Google Scholar]
- Buzsáki G (2015) Hippocampal sharp wave-ripple: a cognitive biomarker for episodic memory and planning. Hippocampus 25:1073–1188. 10.1002/hipo.22488 [DOI] [PMC free article] [PubMed] [Google Scholar]
- Canolty RT, Edwards E, Dalal SS, Soltani M, Nagarajan SS, Kirsch HE, Berger MS, Barbaro NM, Knight RT (2006) High gamma power is phase-locked to theta oscillations in human neocortex. Science 313:1626–1628. 10.1126/science.1128115 [DOI] [PMC free article] [PubMed] [Google Scholar]
- Cornwall J, Cooper JD, Phillipson OT (1990) Afferent and efferent connections of the laterodorsal tegmental nucleus in the rat. Brain Res Bull 25:271–284. 10.1016/0361-9230(90)90072-8 [DOI] [PubMed] [Google Scholar]
- de Olmos J, Hardy H, Heimer L (1978) The afferent connections of the main and the accessory olfactory bulb formations in the rat: an experimental HRP-study. J Comp Neurol 181:213–244. 10.1002/cne.901810202 [DOI] [PubMed] [Google Scholar]
- Eeckman FH, Freeman WJ (1990) Correlations between unit firing and EEG in the rat olfactory system. Brain Res 528:238–244. 10.1016/0006-8993(90)91663-2 [DOI] [PubMed] [Google Scholar]
- Fell J, Axmacher N (2011) The role of phase synchronization in memory processes. Nat Rev Neurosci 12:105–118. 10.1038/nrn2979 [DOI] [PubMed] [Google Scholar]
- Fontanini A, Bower JM (2005) Variable coupling between olfactory system activity and respiration in ketamine/xylazine anesthetized rats. J Neurophysiol 93:3573–3581. 10.1152/jn.01320.2004 [DOI] [PubMed] [Google Scholar]
- Forbes WB, Macrides F (1984) Temporal matching of sensory-motor behavior and limbic θ rhythm deteriorates in aging rats. Neurobiol Aging 5:7–17. 10.1016/0197-4580(84)90080-0 [DOI] [PubMed] [Google Scholar]
- Frederick DE, Brown A, Brim E, Mehta N, Vujovic M, Kay LM (2016) Gamma and beta oscillations define a sequence of neurocognitive modes present in odor processing. J Neurosci 36:7750–7767. 10.1523/JNEUROSCI.0569-16.2016 [DOI] [PMC free article] [PubMed] [Google Scholar]
- Freeman WJ (2004) Origin, structure, and role of background EEG activity. Part 2. Analytic phase. Clin Neurophysiol 115:2089–2107. 10.1016/j.clinph.2004.02.028 [DOI] [PubMed] [Google Scholar]
- Freeman WJ (2015) Mechanism and significance of global coherence in scalp EEG. Curr Opin Neurobiol 31:199–205. 10.1016/j.conb.2014.11.008 [DOI] [PubMed] [Google Scholar]
- Fries P (2015) Neuron perspective rhythms for cognition: communication through coherence. Neuron 88:220–235. [DOI] [PMC free article] [PubMed] [Google Scholar]
- Gretenkord S, Kostka JK, Hartung H, Watznauer K, Fleck D, Minier-Toribio A, Spehr M, Hanganu-Opatz IL (2019) Coordinated electrical activity in the olfactory bulb gates the oscillatory entrainment of entorhinal networks in neonatal mice. PLOS Biol 17:e2006994. 10.1371/journal.pbio.2006994 [DOI] [PMC free article] [PubMed] [Google Scholar]
- Haberly LB, Price JL (1978) Association and commissural fiber systems of the olfactory cortex of the rat II. Systems originating in the olfactory peduncle. J Comp Neurol 181:781–807. 10.1002/cne.901810407 [DOI] [PubMed] [Google Scholar]
- Heck DH, Kozma R, Kay LM (2019) The rhythm of memory: how breathing shapes memory function. J Neurophysiol 122:563–571. 10.1152/jn.00200.2019 [DOI] [PMC free article] [PubMed] [Google Scholar]
- Hermer-Vazquez R, Hermer-Vazquez L, Srinivasan S, Chapin JK (2007) Beta- and gamma-frequency coupling between olfactory and motor brain regions prior to skilled, olfactory-driven reaching. Exp Brain Res 180:217–235. 10.1007/s00221-007-0850-2 [DOI] [PMC free article] [PubMed] [Google Scholar]
- Hinman JR, Penley SC, Long LL, Escabí MA, Chrobak JJ (2011) Septotemporal variation in dynamics of theta: speed and habituation. J Neurophysiol 105:2675–2686. 10.1152/jn.00837.2010 [DOI] [PubMed] [Google Scholar]
- Hurtado JM, Rubchinsky LL, Sigvardt KA (2004) Statistical method for detection of phase-locking episodes in neural oscillations. J Neurophysiol 91:1883–1898. 10.1152/jn.00853.2003 [DOI] [PubMed] [Google Scholar]
- Ito J, Roy S, Liu Y, Cao Y, Fletcher M, Lu L, Boughter JD, Grün S, Heck DH (2014) Whisker barrel cortex delta oscillations and gamma power in the awake mouse are linked to respiration. Nat Commun 5:3572. 10.1038/ncomms4572 [DOI] [PMC free article] [PubMed] [Google Scholar]
- Jacobs LF (2003) The evolution of the cognitive map. Brain Behav Evol 62:128–139. 10.1159/000072443 [DOI] [PubMed] [Google Scholar]
- Jacobs LF (2012) From chemotaxis to the cognitive map: the function of olfaction. Proc Natl Acad Sci U S A 109:10693–10700. 10.1073/pnas.1201880109 [DOI] [PMC free article] [PubMed] [Google Scholar]
- Jensen O, Colgin LL (2007) Cross-frequency coupling between neuronal oscillations. Trends Cogn Sci 11:267–269. 10.1016/j.tics.2007.05.003 [DOI] [PubMed] [Google Scholar]
- Johnson DMG, Illig KR, Behan M, Haberly LB (2000) New features of connectivity in piriform cortex visualized by intracellular injection of pyramidal cells suggest that “primary” olfactory cortex functions like “association” cortex in other sensory systems. J Neurosci 20:6974–6982. 10.1523/JNEUROSCI.20-18-06974.2000 [DOI] [PMC free article] [PubMed] [Google Scholar]
- Kay LM (2005) Theta oscillations and sensorimotor performance. Proc Natl Acad Sci U S A 102:3863–3868. 10.1073/pnas.0407920102 [DOI] [PMC free article] [PubMed] [Google Scholar]
- Kay LM, Freeman WJ (1998) Bidirectional processing in the olfactory-limbic axis during olfactory behavior. Behav Neurosci 112:541–553. 10.1037//0735-7044.112.3.541 [DOI] [PubMed] [Google Scholar]
- Kay LM, Laurent G (1999) Odor- and context-dependent modulation of mitral cell activity in behaving rats. Nat Neurosci 2:1003–1009. 10.1038/14801 [DOI] [PubMed] [Google Scholar]
- Kay LM, Sherman SM (2007) An argument for an olfactory thalamus. Trends Neurosci 30:47–53. 10.1016/j.tins.2006.11.007 [DOI] [PubMed] [Google Scholar]
- Kay LM, Beshel J (2010) A beta oscillation network in the rat olfactory system during a 2-alternative choice odor discrimination task. J Neurophysiol 104:829–839. 10.1152/jn.00166.2010 [DOI] [PMC free article] [PubMed] [Google Scholar]
- Kepecs A, Uchida N, Mainen ZF (2007) Rapid and precise control of sniffing during olfactory discrimination in rats. J Neurophysiol 98:205–213. 10.1152/jn.00071.2007 [DOI] [PubMed] [Google Scholar]
- Kleinfeld D, Deschênes M, Wang F, Moore JD (2014) More than a rhythm of life: breathing as a binder of orofacial sensation. Nat Neurosci 17:647–651. 10.1038/nn.3693 [DOI] [PMC free article] [PubMed] [Google Scholar]
- Kropff E, Carmichael JE, Moser EI, Moser M-B (2021) Frequency of theta rhythm is controlled by acceleration, but not speed, in running rats. Neuron 109:1029–1039. e8. 10.1016/j.neuron.2021.01.017 [DOI] [PMC free article] [PubMed] [Google Scholar]
- Lein ES, Hawrylycz MJ, Ao N, Ayres M, Bensinger A, Bernard A, Boe AF, Boguski MS, Brockway KS, Byrnes EJ, Chen L, Chen L, Chen T-M, Chin MC, Chong J, Crook BE, Czaplinska A, Dang CN, Datta S, Dee NR, et al. (2007) Genome-wide atlas of gene expression in the adult mouse brain. Nature 445:168–176. 10.1038/nature05453 [DOI] [PubMed] [Google Scholar]
- Litaudon P, Garcia S, Buonviso N (2008) Strong coupling between pyramidal cell activity and network oscillations in the olfactory cortex. Neuroscience 156:781–787. 10.1016/j.neuroscience.2008.07.077 [DOI] [PubMed] [Google Scholar]
- Liu Y, McAfee SS, Heck DH (2017) Hippocampal sharp-wave ripples in awake mice are entrained by respiration. Sci Rep 7:8950. 10.1038/s41598-017-09511-8 [DOI] [PMC free article] [PubMed] [Google Scholar]
- Lockmann AL, V, Laplagne DA, Leão RN, Tort ABL (2016) A respiration-coupled rhythm in the rat hippocampus independent of theta and slow oscillations. J Neurosci 36:5338–5352. 10.1523/JNEUROSCI.3452-15.2016 [DOI] [PMC free article] [PubMed] [Google Scholar]
- Macrides F, Eichenbaum HB, Forbes WB (1982) Temporal relationship between sniffing and the limbic theta rhythm during odor discrimination reversal learning. J Neurosci 2:1705–1717. [DOI] [PMC free article] [PubMed] [Google Scholar]
- Manabe H, Kusumoto-Yoshida I, Ota M, Mori K (2011) Olfactory cortex generates synchronized top-down inputs to the olfactory bulb during slow-wave sleep. J Neurosci 31:8123–8133. 10.1523/JNEUROSCI.6578-10.2011 [DOI] [PMC free article] [PubMed] [Google Scholar]
- Moberly AH, Schreck M, Bhattarai JP, Zweifel LS, Luo W, Ma M (2018) Olfactory inputs modulate respiration-related rhythmic activity in the prefrontal cortex and freezing behavior. Nat Commun 9:1528. 10.1038/s41467-018-03988-1 [DOI] [PMC free article] [PubMed] [Google Scholar]
- Moore JD, Deschênes M, Furuta T, Huber D, Smear MC, Demers M, Kleinfeld D (2013) Hierarchy of orofacial rhythms revealed through whisking and breathing. Nature 497:205–210. 10.1038/nature12076 [DOI] [PMC free article] [PubMed] [Google Scholar]
- Narikiyo K, Manabe H, Mori K (2014) Sharp wave-associated synchronized inputs from the piriform cortex activate olfactory tubercle neurons during slow-wave sleep. J Neurophysiol 111:72–81. 10.1152/jn.00535.2013 [DOI] [PMC free article] [PubMed] [Google Scholar]
- Newman EL, Gillet SN, Climer JR, Hasselmo ME (2013) Cholinergic blockade reduces theta-gamma phase amplitude coupling and speed modulation of theta frequency consistent with behavioral effects on encoding. J Neurosci 33:19635–19646. 10.1523/JNEUROSCI.2586-13.2013 [DOI] [PMC free article] [PubMed] [Google Scholar]
- Nguyen Chi V, Müller C, Wolfenstetter T, Yanovsky Y, Draguhn A, Tort ABL, Branka k J (2016) Hippocampal respiration-driven rhythm distinct from theta oscillations in awake mice. J Neurosci 36:162–177. 10.1523/JNEUROSCI.2848-15.2016 [DOI] [PMC free article] [PubMed] [Google Scholar]
- O'Keefe J, Recce ML (1993) Phase relationship between hippocampal place units and the EEG theta rhythm. Hippocampus 3:317–330. 10.1002/hipo.450030307 [DOI] [PubMed] [Google Scholar]
- Parker PRL, Brown MA, Smear MC, Niell CM (2020) Movement-related signals in sensory areas: roles in natural behavior. Trends Neurosci 43:581–595. 10.1016/j.tins.2020.05.005 [DOI] [PMC free article] [PubMed] [Google Scholar]
- Perl O, Ravia A, Rubinson M, Eisen A, Soroka T, Mor N, Secundo L, Sobel N (2019) Human non-olfactory cognition phase-locked with inhalation. Nat Hum Behav 3:501–512. 10.1038/s41562-019-0556-z [DOI] [PubMed] [Google Scholar]
- Ranade S, Hangya B, Kepecs A (2013) Multiple modes of phase locking between sniffing and whisking during active exploration. J Neurosci 33:8250–8256. 10.1523/JNEUROSCI.3874-12.2013 [DOI] [PMC free article] [PubMed] [Google Scholar]
- Rennaker RL, Chen CFF, Ruyle AM, Sloan AM, Wilson DA (2007) Spatial and temporal distribution of odorant-evoked activity in the piriform cortex. J Neurosci 27:1534–1542. 10.1523/JNEUROSCI.4072-06.2007 [DOI] [PMC free article] [PubMed] [Google Scholar]
- Rojas-Líbano D, Frederick DE, Egaña JI, Kay LM (2014) The olfactory bulb theta rhythm follows all frequencies of diaphragmatic respiration in the freely behaving rat. Front Behav Neurosci 8:214. 10.3389/fnbeh.2014.00214 [DOI] [PMC free article] [PubMed] [Google Scholar]
- Rojas-Líbano D, Wimmer Del Solar J, Aguilar-Rivera M, Montefusco-Siegmund R, Pedro X, Maldonado E (2018) Local cortical activity of distant brain areas can phase-lock to the olfactory bulb's respiratory rhythm in the freely behaving rat. J Neurophysiol 120:960–972. 10.1152/jn.00088.2018 [DOI] [PubMed] [Google Scholar]
- Rossier J, Schenk F (2003) Olfactory and/or visual cues for spatial navigation through ontogeny: olfactory cues enable the use of visual cues. Behav Neurosci 117:412–425. 10.1037/0735-7044.117.3.412 [DOI] [PubMed] [Google Scholar]
- Save E, Nerad L, Poucet B (2000) Contribution of multiple sensory information to place field stability in hippocampal place cells. Hippocampus 10:64–76. [DOI] [PubMed] [Google Scholar]
- Seth AK, Barrett AB, Barnett L (2015) Granger causality analysis in neuroscience and neuroimaging. J Neurosci 35:3293–3297. 10.1523/JNEUROSCI.4399-14.2015 [DOI] [PMC free article] [PubMed] [Google Scholar]
- Singer W (1993) Synchronization of cortical activity and its putative role in information processing and learning. Annu Rev Physiol 55:349–374. 10.1146/annurev.ph.55.030193.002025 [DOI] [PubMed] [Google Scholar]
- Sosulski DL, Lissitsyna Bloom M, Cutforth T, Axel R, Datta SR (2011) Distinct representations of olfactory information in different cortical centres. Nature 472:213–219. 10.1038/nature09868 [DOI] [PMC free article] [PubMed] [Google Scholar]
- Tort ABL, Kramer MA, Thorn C, Gibson DJ, Kubota Y, Graybiel AM, Kopell NJ (2008) Dynamic cross-frequency couplings of local field potential oscillations in rat striatum and hippocampus during performance of a T-maze task. Proc Natl Acad Sci U S A 105:20517–20522. 10.1073/pnas.0810524105 [DOI] [PMC free article] [PubMed] [Google Scholar]
- Tort ABL, Komorowski R, Eichenbaum H, Kopell N (2010) Measuring phase-amplitude coupling between neuronal oscillations of different frequencies. J Neurophysiol 104:1195–1210. 10.1152/jn.00106.2010 [DOI] [PMC free article] [PubMed] [Google Scholar]
- Tort ABL, Brankačk J, Draguhn A (2018a) Respiration-entrained brain rhythms are global but often overlooked. Trends Neurosci 41:186–197. 10.1016/j.tins.2018.01.007 [DOI] [PubMed] [Google Scholar]
- Tort ABL, Ponsel S, Jessberger J, Yanovsky Y, Brankačk J, Draguhn A (2018b) Parallel detection of theta and respiration-coupled oscillations throughout the mouse brain. Sci Rep 8:6432. 10.1038/s41598-018-24629-z [DOI] [PMC free article] [PubMed] [Google Scholar]
- Travlos GS, Wilson R, Murrell JA, Chignell CF, Boorman GA (2001) The effect of short intermittent light exposures on the melatonin circadian rhythm and NMU-induced breast cancer in female F344/N rats. Toxicol Pathol 29:126–136. 10.1080/019262301301418937 [DOI] [PubMed] [Google Scholar]
- Truchet B, Chaillan FA, Soumireu-Mourat B, Roman FS (2002) Learning and memory of cue-reward association meaning by modifications of synaptic efficacy in dentate gyrus and piriform cortex. Hippocampus 12:600–608. 10.1002/hipo.10097 [DOI] [PubMed] [Google Scholar]
- Tsanov M, Chah E, Reilly R, O'Mara SM (2014) Respiratory cycle entrainment of septal neurons mediates the fast coupling of sniffing rate and hippocampal theta rhythm. Eur J Neurosci 39:957–974. 10.1111/ejn.12449 [DOI] [PMC free article] [PubMed] [Google Scholar]
- Vanderwolf CH (1969) Hippocampal electrical activity and voluntary movement in the rat. Electroencephalogr Clin Neurophysiol 26:407–418. 10.1016/0013-4694(69)90092-3 [DOI] [PubMed] [Google Scholar]
- Vanderwolf CH (1992) Hippocampal activity, olfaction, and sniffing: an olfactory input to the dentate gyrus. Brain Res 593:197–208. 10.1016/0006-8993(92)91308-2 [DOI] [PubMed] [Google Scholar]
- Wesson DW, Verhagen JV, Wachowiak M (2009) Why sniff fast? The relationship between sniff frequency, odor discrimination, and receptor neuron activation in the rat. J Neurophysiol 101:1089–1102. 10.1152/jn.90981.2008 [DOI] [PMC free article] [PubMed] [Google Scholar]
- Womelsdorf T, Schoffelen J-M, Oostenveld R, Singer W, Desimone R, Engel AK, Fries P (2007) Modulation of neuronal interactions through neuronal synchronization. Science 316:1609–1612. 10.1126/science.1139597 [DOI] [PubMed] [Google Scholar]
- Yanovsky Y, Ciatipis M, Draguhn A, Tort AB, Brankačk J (2014) Slow oscillations in the mouse hippocampus entrained by nasal respiration. J Neurosci 34:5949–5964. 10.1523/JNEUROSCI.5287-13.2014 [DOI] [PMC free article] [PubMed] [Google Scholar]
- Zelano C, Jiang H, Zhou G, Arora N, Schuele S, Rosenow J, Gottfried JA (2016) Nasal respiration entrains human limbic oscillations and modulates cognitive function. J Neurosci 36:12448–12467. 10.1523/JNEUROSCI.2586-16.2016 [DOI] [PMC free article] [PubMed] [Google Scholar]
- Zhang S, Manahan-Vaughan D (2015) Spatial olfactory learning contributes to place field formation in the hippocampus. Cereb Cortex 25:423–432. 10.1093/cercor/bht239 [DOI] [PMC free article] [PubMed] [Google Scholar]


