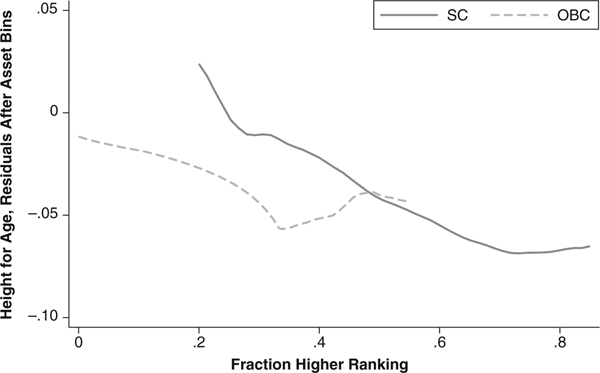
Fig. 5.
Child height, net of SES, and the fraction of households in a child’s locality that outranks hers. Local kernel-weighted regression. Epanechnikov kernel, bandwidth = 0.15. The large set of regression SES controls is used. Observations are children included in column 4 of Table 3 for whom the fraction of households that outrank their own is between the 10th and 90th percentiles of this variable for their own caste group.

