

Abstract
Anaplastic lymphoma kinase (ALK) is a receptor tyrosine kinase (RTK) regulating important functions in the central nervous system1,2. The ALK gene is a hotspot for chromosomal translocation events that result in several fusion proteins that cause a variety of human malignancies3. Somatic and germline gain-of-function mutations in ALK were identified in pediatric neuroblastoma4–7. ALK is composed of an extracellular region (ECR), a single transmembrane helix and an intracellular tyrosine kinase domain8,9. ALK is activated by the binding of ALKAL1 and ALKAL2 ligands10–14 to its ECR, but the lack of structural information for ALK-ECR or ALKAL ligands has limited our understanding of ALK activation. Here we used cryo-EM, NMR, and X-ray crystallography to determine the atomic details of human ALK dimerization and activation by ALKAL1 and ALKAL2. Our data reveal a new mechanism for RTK activation that allows dimerization by either dimeric (ALKAL2) or monomeric (ALKAL1) ligands. This mechanism is underpinned by an unusual architecture of the receptor-ligand complex. ALK-ECR undergoes a pronounced ligand-induced rearrangement and adopts an orientation parallel to the membrane surface. This orientation is further stabilized by an interaction between the ligand and the membrane. Our findings highlight the diversity in RTK oligomerization and activation mechanisms.
Keywords: Anaplastic lymphoma kinase, Leukocyte tyrosine kinase, Receptor tyrosine kinases, Kinase regulation, cryo-EM, NMR spectroscopy
The ALK-ECR is 1,038 residues long and is composed of two meprin, A-5, receptor protein-tyrosine phosphatase mu (MAM) domains separated by a low-density lipoprotein receptor class A (LDL) domain, a glycine-rich region (GlyR), a TNF-like15 domain and an EGF-like domain (Fig. 1a). The ALK-ECR fragment (residues 648–1,030, Fig. 1a) is sufficient for ALKAL binding12. Here we used an integrative structural biology approach to determine the structure of the ligand-binding ALK-ECR (hereafter ALK-ECRABR, residues 673–1025), in the unliganded state (Extended Data Fig. 1a–g) and in complex with ALKAL2 (also known as AUGɑ or FAM150B) and ALKAL1 (AUGβ or FAM150A).
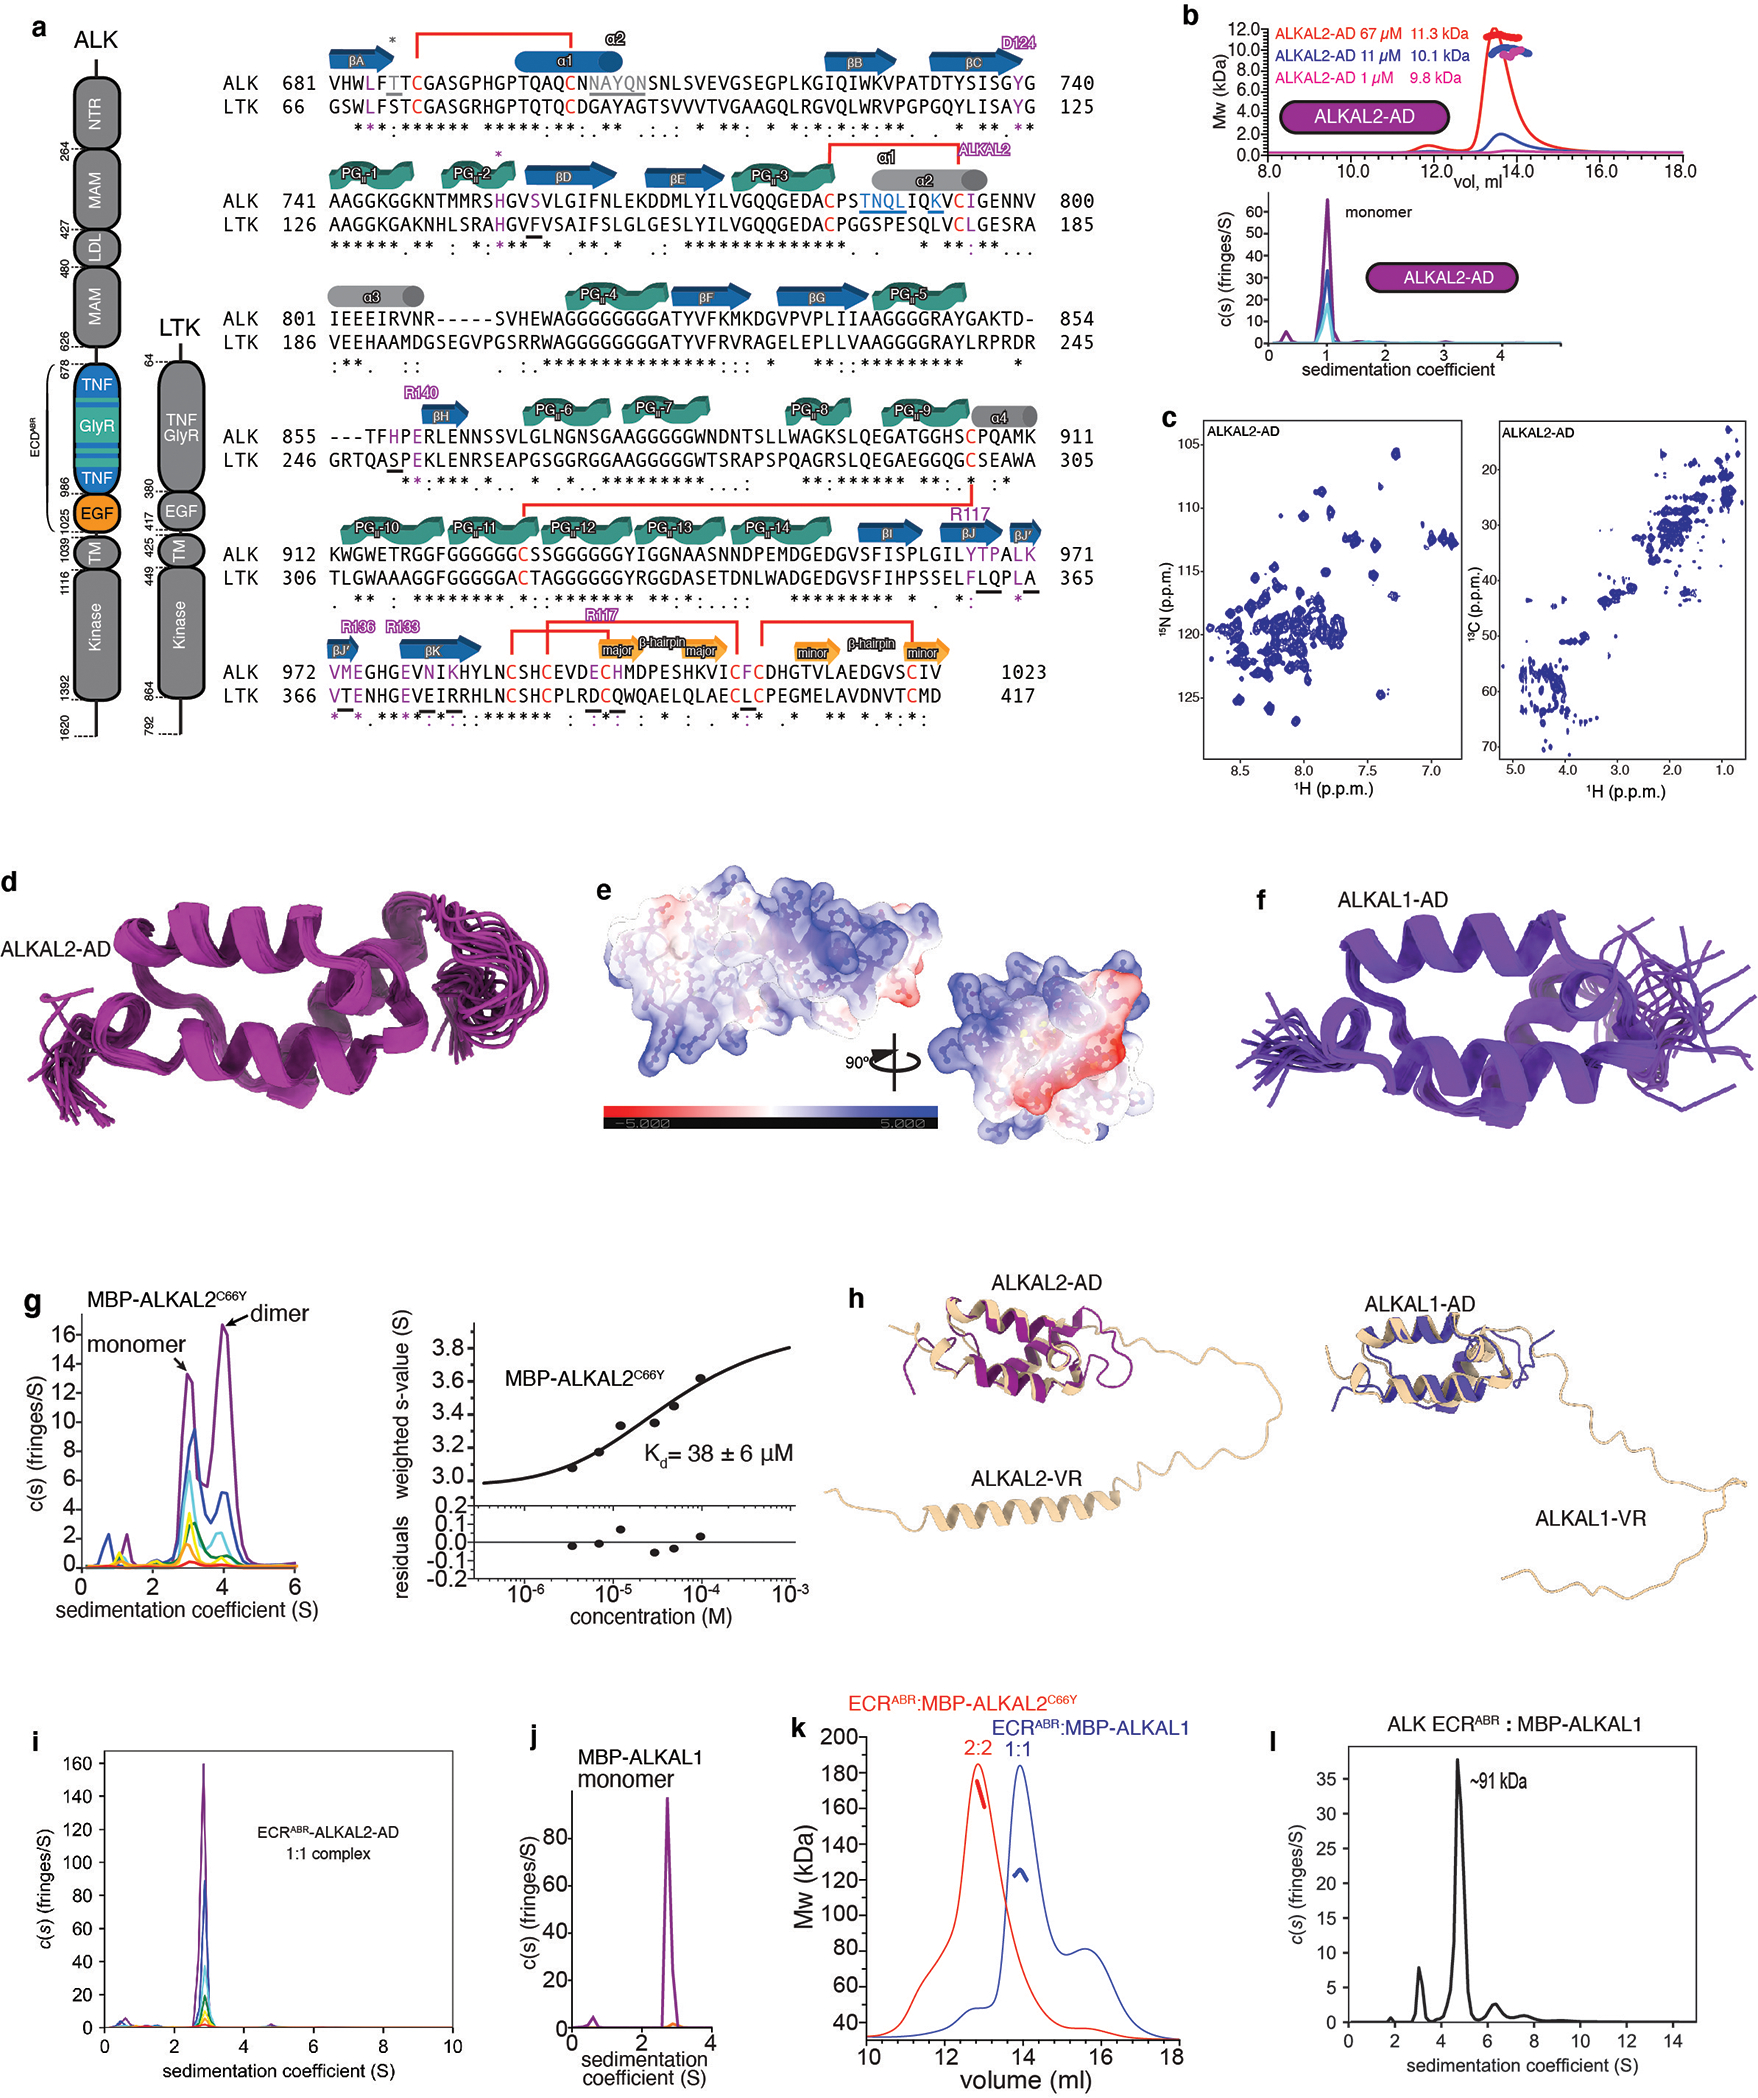
Fig. 1|. Structural features of ALK ECRABR and ALKAL2.
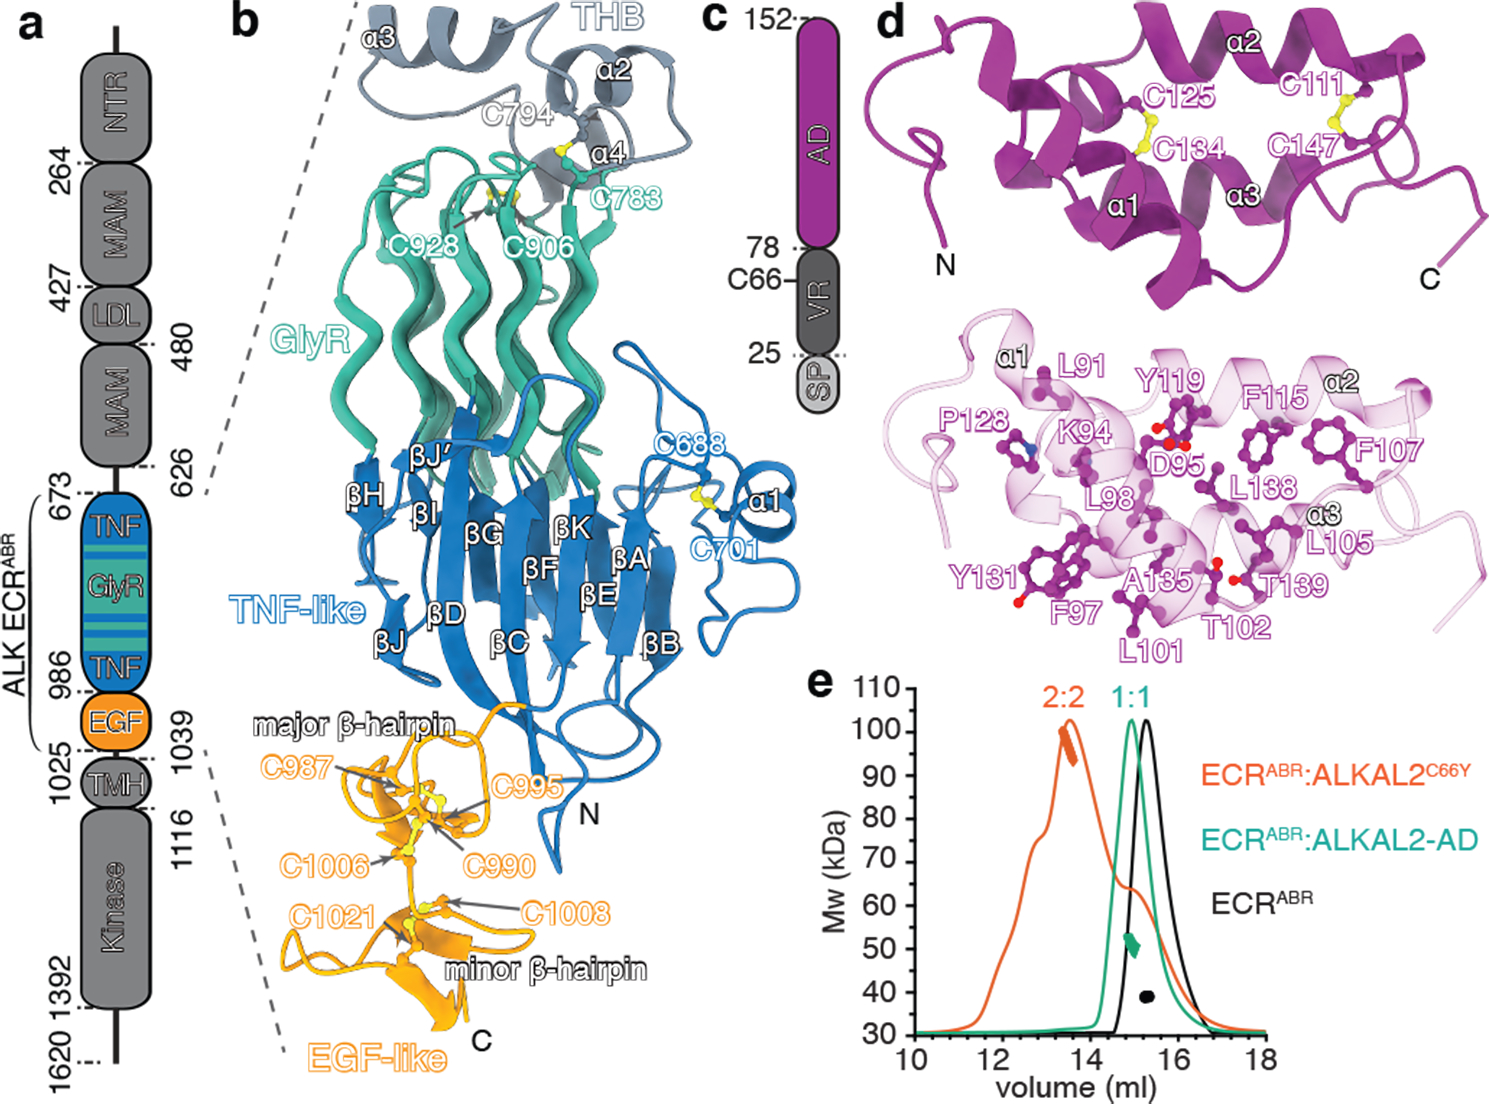
a, Domain organization of human ALK. b, Structure of ALK ECRABR determined by X-ray crystallography and NMR spectroscopy. Disulfide bonds are shown in ball-and-stick with sulfur atoms colored in yellow. Secondary structure elements are labeled. PGII helices are shown as tubes. c, Domain organization of human ALKAL2. SP, signal peptide. d, Solution NMR structure of ALKAL2-AD. Key hydrophobic contacts stabilizing the ALKAL2 fold are shown (lower panel). e, SEC-MALS data for ALK ECRABR–ALKAL2C66Y complex, ALK ECRABR–ALKAL2-AD complex, and ALK ECRABR (theoretical masses are 108 kDa, 46 kDa, and 37 kDa, respectively). RI signal is normalized, molecular masses in kDa as determined by in-line MALS.
Structure of ALK-ECRABR
The structure of ALK-ECRABR revealed a jelly roll β-sandwich in the TNF-like domain, followed by a hexagonal array of polyglycine II (PGII) helices in GlyR and a three-helix bundle (THB) (Fig. 1b). The core of the jelly roll is formed by two antiparallel β-sheets connected by helix α1 (Fig. 1b and Extended Data Fig. 1h). The TNF-like domain and GlyR are discontinuous and traverse each other multiple times, with the fold additionally stabilized by three disulfide bridges. The PGII helix is a rare secondary structure that forms a left-handed helix16,17. ALK GlyR contains 14 PGII helices, organized in an array wherein a central helix is surrounded by six PGII helices, creating a hexagonal shape (Fig.1b and Extended Data Fig. 1i–l). The PGII array is rigid (as indicated by the low B-factors, Extended Data Fig. 1g), allowing GlyR to function as a scaffold to anchor the ligand-binding site in the TNF-like domain and the dimerization motif in THB. The structure suggests that loss-of-function glycine mutations previously reported in the GyR of Drosophila Alk18 would disrupt the GlyR fold.
The EGF-like domain consists of major (N-terminal) and minor (C-terminal) β-hairpins, connected by a short loop and stabilized by three conserved disulfide bridges (Fig. 1b). The interface between the TNF-like and EGF-like domains is enriched in hydrophobic residues and buries approximately 400 Å2 (Extended Data Fig. 1m). The ECR of LTK has high sequence similarity (72%) to ALK-ECRABR (Extended Data Fig. 2a) and the two ECRs are thus expected to have similar domain architecture and structure.
Structure of ALKAL1 and ALKAL2 ligands
Both ALKAL1 and ALKAL2 contain an N-terminal variable region (VR) and a conserved C-terminal augmentor domain (AD) (Fig. 1c)12,15. Full-length ALKAL2 tends to aggregate, so we determined the structure of ALKAL2-AD, which can stimulate ALK phosphorylation activity at a similar level as the full-length ALKAL215. Size-exclusion chromatography coupled with multi-angle light scattering (SEC-MALS) and sedimentation velocity analytical ultracentrifugation (SV-AUC) experiments showed that even at high concentrations (~70 μM) used for NMR, ALKAL2-AD is monomeric (Extended Data Fig. 2b). The solution NMR structure of ALKAL2-AD (Extended Data Fig. 2c,d and Extended Data Table 1) shows a simple three-helical bundle (Fig. 1d) that features an extended positively charged surface (Extended Data Fig. 2e). Helices α2 and α3 form a helix-turn-helix motif, held together via two conserved disulfide bridges15 (Fig. 1d). We also determined the NMR structure of ALKAL1-AD (Extended Data Fig. 2f), which, given its high sequence similarity (91%) to ALKAL2-AD, adopts a similar structure.
In human and primate ALKAL2, Cys66 in the VR mediates homodimerization via an inter-molecular disulfide bond (Fig. 1c)15; in lower vertebrates, Cys66 is replaced by a hydrophobic residue, typically Tyr15. To assess the role of Cys66, we studied the ALKAL2C66Y variant and noted that it is less aggregation-prone than wild-type ALKAL2. To further increase its solubility, we prepared ALKAL2C66Y as a fusion with maltose-binding protein (MBP). MBP-ALKAL2C66Y can form homodimers with an apparent Kd of 38±6 μM (Extended Data Fig. 2g), showing that the disulfide bond formed by Cys66 is not required for ALKAL2 dimerization. Because of its low solubility, we could not characterize ALKAL2C66Y by NMR, but the AlphaFold-predicted19 structure of ALKAL2 indicates the presence of an α-helix in the VR (Extended Data Fig. 2h), which could mediate dimerization.
We investigated whether full-length ALKAL2 (dimeric) and ALKAL2-AD (monomeric) can induce ALK-ECRABR dimerization using SEC-MALS (Fig. 1e). Unliganded ALK-ECRABR eluted at 39 kDa, consistently with the monomer’s predicted mass (37 kDa). Addition of ALKAL2C66Y (at a concentration in which the ligand exists almost exclusively as a monomer) to ALK-ECRABR yielded a 2:2 complex, as indicated by the apparent molecular weight of ~99 kDa (Fig. 1e and Extended Data Fig. 3a). The dimerization Kd (i.e. transition between 1:1 heterodimeric and 2:2 heterotetrameric complex) was measured to be ~3.2±1.5 μM (Extended Data Fig. 3a–c); these findings were confirmed by AUC experiments (Extended Data Fig. 3b). By contrast, ALKAL2-AD-bound ALK-ECRABR formed primarily a 1:1 heterodimeric complex (Fig. 1e and Extended Data Fig. 2i).
ALKAL1 has a shorter VR domain with no sequence similarity to that of ALKAL2. In contrast to MBP-ALKAL2, MBP-ALKAL1 was monomeric even at high concentrations (Fig. 1j) and could not promote dimerization of ALK-ERCABR (Extended Data Fig. 2k, i). The AlphaFold-predicted19 structure of ALKAL1 shows no secondary structural elements in the VR domain (Extended Data Fig. 2h). We thus conclude that full-length ALKAL1 is monomeric.
The ALK-ECRABR−ALKAL2 complex
We determined the cryo-EM structure of the ALK-ECRABR−ALKAL2C66Y complex (hereafter ALK-ECRABR−ALKAL2 for simplicity) to 2.3-Å-resolution (Extended Data Fig. 4 and Extended Data Table 2). We first assembled the complex using MBP−ALKAL2C66Y, but removed the MBP moiety prior to cryo-EM analyses. The complex is a 2:2 heterotetramer (dimer of heterodimers), wherein the two ALK-ECRABR−ALKAL2 heterodimers are related by C2 symmetry (Fig. 2a). ALKAL2-AD bound to ALK is similar to its structure in the unliganded state (r.m.s.d. 0.79 Å, Extended Data Fig. 5a). The density for ALKAL2 VR domain in the cryo-EM map was extremely weak, presumably owing to structural flexibility in the linker between the VR and AD, thus preventing unambiguous building of the VR structure.
Fig. 2|. Cryo-EM structure of the hetero-tetrameric ALK ECRABR-ALKAL2 complex.
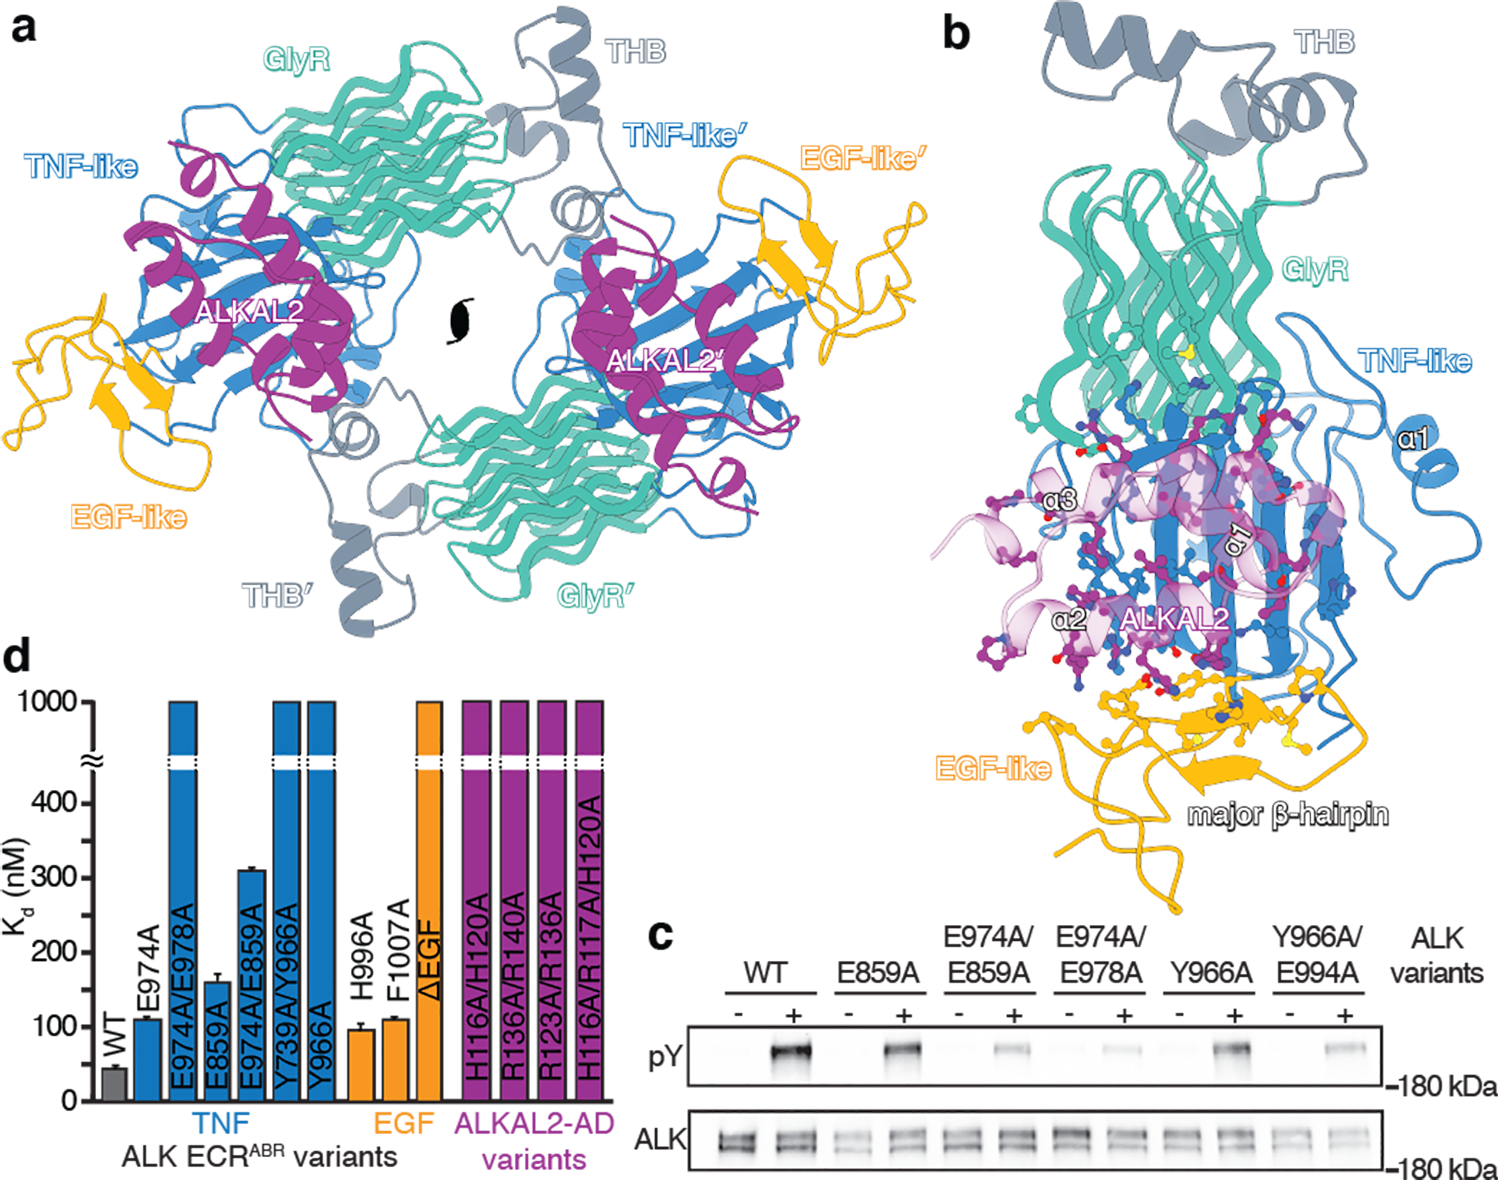
a, Cryo-EM structure of the hetero-tetrameric ALK ECRABR–ALKAL2 complex shown as cartoon model with C2 symmetry axis. b, Structure of ALK ECRABR–ALKAL2 showing the protein-ligand interface (only one subunit is shown). c, Immunoblots showing autophosphorylation of ALK variants in cells stimulated with 10 nM of ALKAL2-AD. pY, phospho-tyrosine; position of the 180 kDa MW marker is shown. d, Binding affinities of ALK ECRABR variants harboring substitutions in the TNF-like (blue) or EGF-like (orange) domains for ALKAL2-AD, or of ALKAL2-AD mutants (magenta) for wild-type ALK ECRABR, measured by BLI. For variants with no detectable binding, the Kd is shown as 1000 nM (detection limit). Steady-state dissociation constants and standard errors were determined as described in the methods section.
ALKAL2 binding to ALK-ECRABR is mediated by the TNF-like and EGF-like domains, burying ~2000 Å2 of surface area. The helix-turn-helix motif of ALKAL2 juxtaposes with the five-strand β-sheet of ALK-ECRABR TNF-like domain (Fig. 2b; all contacts listed in Extended Data Table 3). ALKAL2 binding elicits a pronounced reorientation of EGF-like, which rotates by 80° to form a cleft into which ALKAL2 docks. Extensive interactions between the ALKAL2 helix ɑ2 and the major β-hairpin of EGF-like form. The key residues in ALK-ECRABR-ALKAL2 interface are conserved between ALK and LTK (Extended Data Fig. 2a).
We confirmed by NMR spectroscopy that the binding mode between ALKAL2-AD and ALK-ECRABR is the same in the solution as in the cryo-EM structure (Extended Data Fig. 6a). We then investigated how ALKAL1-AD binds to ALK-ECRABR by NMR (Extended Data Fig. 6 b–g). Mapping of the chemical shift perturbation (CSP) values onto the structure of ALK-ECRABR matched the binding interface seen in the cryo-EM structure (Extended Data Fig. 6 c–f). Thus, ALKAL2-AD and ALKAL1-AD share the same binding site on ALK-ECRABR, and this conclusion was supported by measuring inter-molecular NOEs between ALK-ECRABR and either ALKAL2-AD or ALKAL1-AD (Extended Data Fig. 6g). The NOE analysis also captured the marked reorientation of the EGF-like domain in solution upon binding of either ALKAL2-AD or ALKAL1-AD (Extended Data Fig. 6h). Since ALK-ECRABR and ALKAL1/2-AD form 1:1 heterodimeric complexes, these observations show that the EGF-like domain reorientation is a direct result of ALKAL binding and does not require receptor dimerization.
To validate the biological relevance of the ALK-ECRABR−ALKAL2 interface, we mutated several ALK residues, individually or combined, and evaluated the ALK variants’ ability to be activated by ALKAL2-AD (Fig. 2c and Extended Data Fig. 3d). We stimulated NIH/3T3 cells stably expressing ALK variants with saturating concentration of ALKAL2-AD and assessed autophosphorylation by immunoblotting, as described previously15. Most single mutations caused moderate decreases in autophosphorylation levels compared to wild-type ALK (Fig. 2c and Extended Data Fig. 3d), with His996A and Phe1007A in the EGF-like domain showing a more substantial effect. Combining ALK mutations abolished receptor activation almost completely (Fig. 2c). We also introduced Ala substitutions into ALKAL2-AD, designed to disrupt binding to ALK; combining multiple mutations substantially reduced activation of wild-type ALK in cells (Extended Data Fig. 3e). The effect of the mutations on the affinity of ALKAL2-AD for ALK-ECRABR was determined using bio-layer interferometry (BLI) (Fig. 2d): single substitutions reduced the affinity by 2–3-fold, whereas double substitutions decreased the affinity more than 10-fold or abolished binding altogether. Deleting the entire EGF-like domain from ALK-ECRABR abolished ALKAL2-AD binding, providing additional evidence that EGF-like is required for ligand binding.
Receptor dimerization
The cryo-EM structure of ALK-ECRABR−ALKAL2 shows that receptor dimerization is mediated by direct contacts between two receptor protomers and between a receptor protomer and the ALKAL2 bound to the second protomer (ALKAL2′) (Fig. 3a). The receptor-receptor interface buries a surface area of ~1,130 Å2 and forms when THB helix α2 from one ALK-ECRABR protomer interacts with helix α1′ and strand βA′ of the TNF-like domain from the other protomer (Fig. 3a, b). The two helices are packed in an almost linear arrangement, with the C-terminus of helix α1′ positioned nearby the N-terminus of helix α2, resulting in a favorable juxtaposition of the helical dipole moments from each helix that gives rise to an attractive inter-protomer interaction. In addition, carbonyl groups of helix α1′ residues form hydrogen bonds with main-chain and side-chain amide groups in helix α2 (Fig. 3b). The interface between receptor protomer and ALKAL2 bound to the other receptor protomer is relatively small, burying ~250 Å2, and involves residues in THB helix α2 of ALK-ECRABR and α2 of ALKAL2′ (Fig. 3b).
Fig. 3 |. Structural features of the ALK ECRABR-ALKAL2 tetramerization interface.
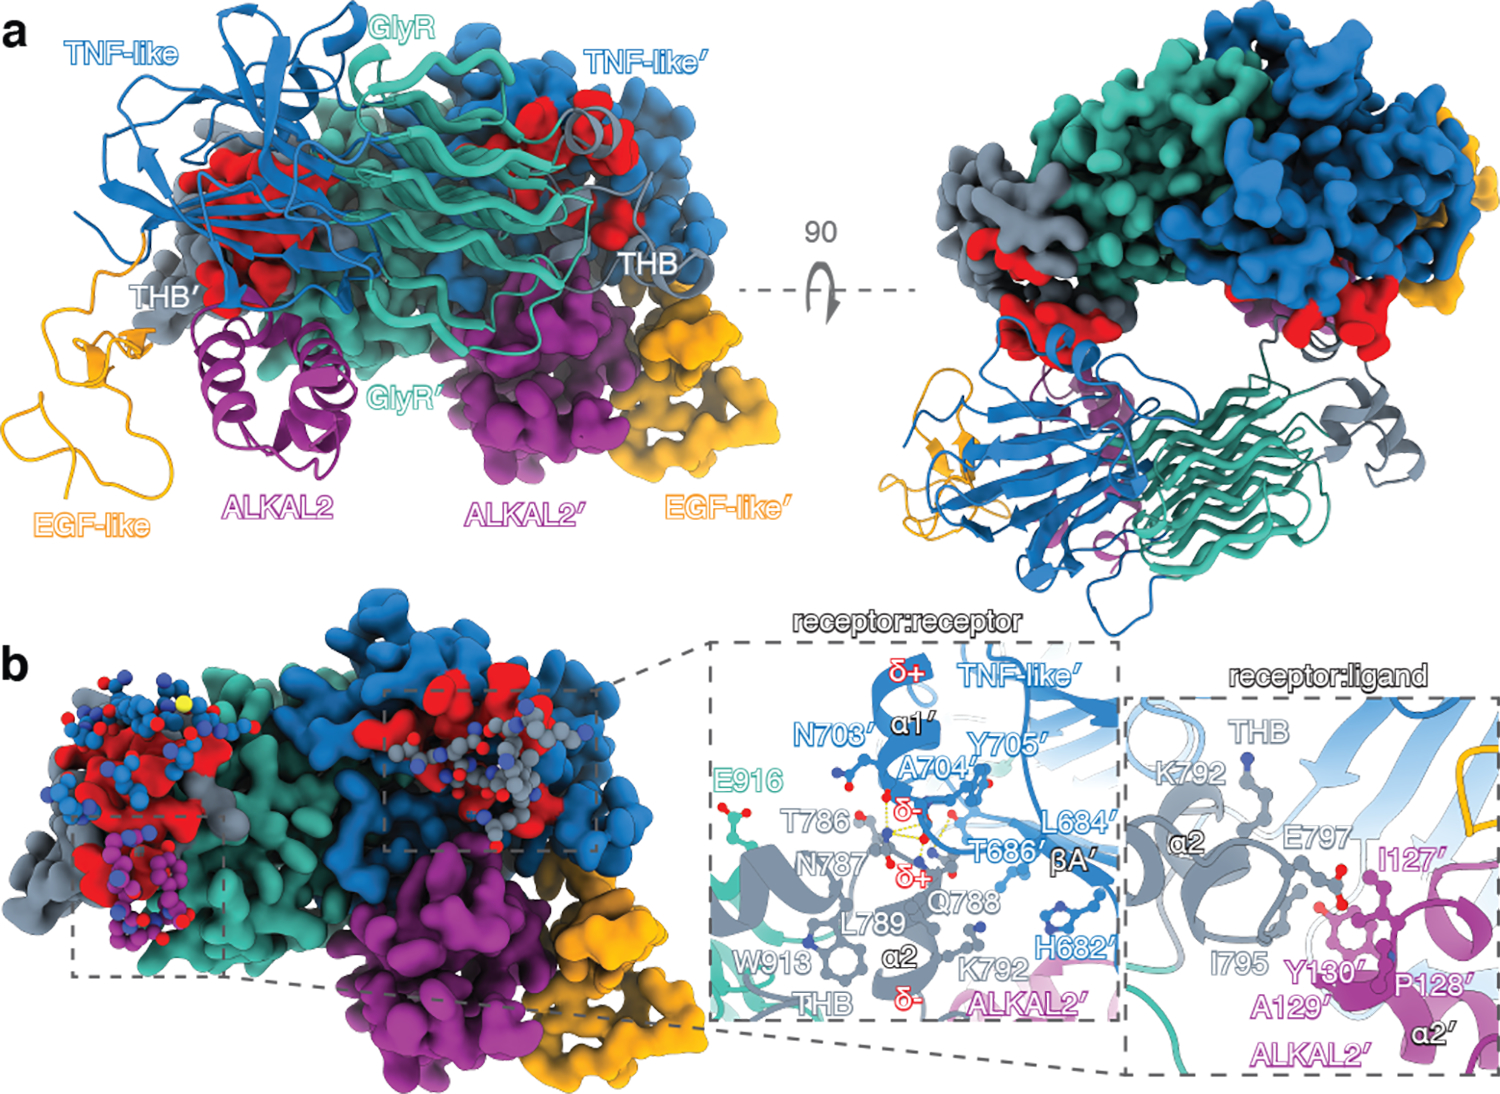
a, Structure of the hetero-tetrameric ALK ECRABR–ALKAL32 complex. One hetero-dimer is shown in cartoon representation and the other (′) in surface rendering with the surface involved in tetramerization colored in red. b, The tetramerization interface is highlighted, by showing only the residues from the first hetero-dimer that mediate tetramerization in ball-and-stick; the second hetero-dimer is displayed as in panel a. Close-up views of ALK ECRABR–ECRABR′ and ALK ECRABR–ALKAL2′ interfaces are shown. Yellow dashed lines denote hydrogen bonds; δ indicates the dipole moment of the helices.
To validate these structural observations, we mutated the residues at the dimeric interfaces and tested their impact on receptor dimerization in vitro. Single mutations had little effect, likely due to receptor dimerization being mediated primarily via main-chain hydrogen bonds and weak van der Waals interactions (Fig. 3b), which are difficult to disrupt by single-site substitutions. We thus tested an ALK-ECRABR variant carrying four substitutions (T686A/N787A/Q788A/I795A, designated ALK-ECRABR−4M) and an ALKAL2C66Y variant carrying two substitutions (I127A/Y130A, designated ALKAL22M). ALK-ECRABR−4M and ALKAL22M could still form a 1:1 complex in solution, but that complex showed a 5-fold reduction in its ability to dimerize to form a 2:2 complex (Extended Data Fig. 3f, g).
Next, we assessed the ability of ALKAL22M-AD to stimulate the phosphorylation activity of full-length ALKI795A in cells. Ile795 interacts with the two residues mutated in ALKAL22M-AD. ALKI795A exhibits much lower phosphorylation activity in response to ALKAL22M-AD (Extended Data Fig. 3h) than wild-type ALK, indicating that receptor dimerization is dependent on ligand-receptor interactions in the absence of the VR dimerization motif.
EGF-like repositioning is required for activation
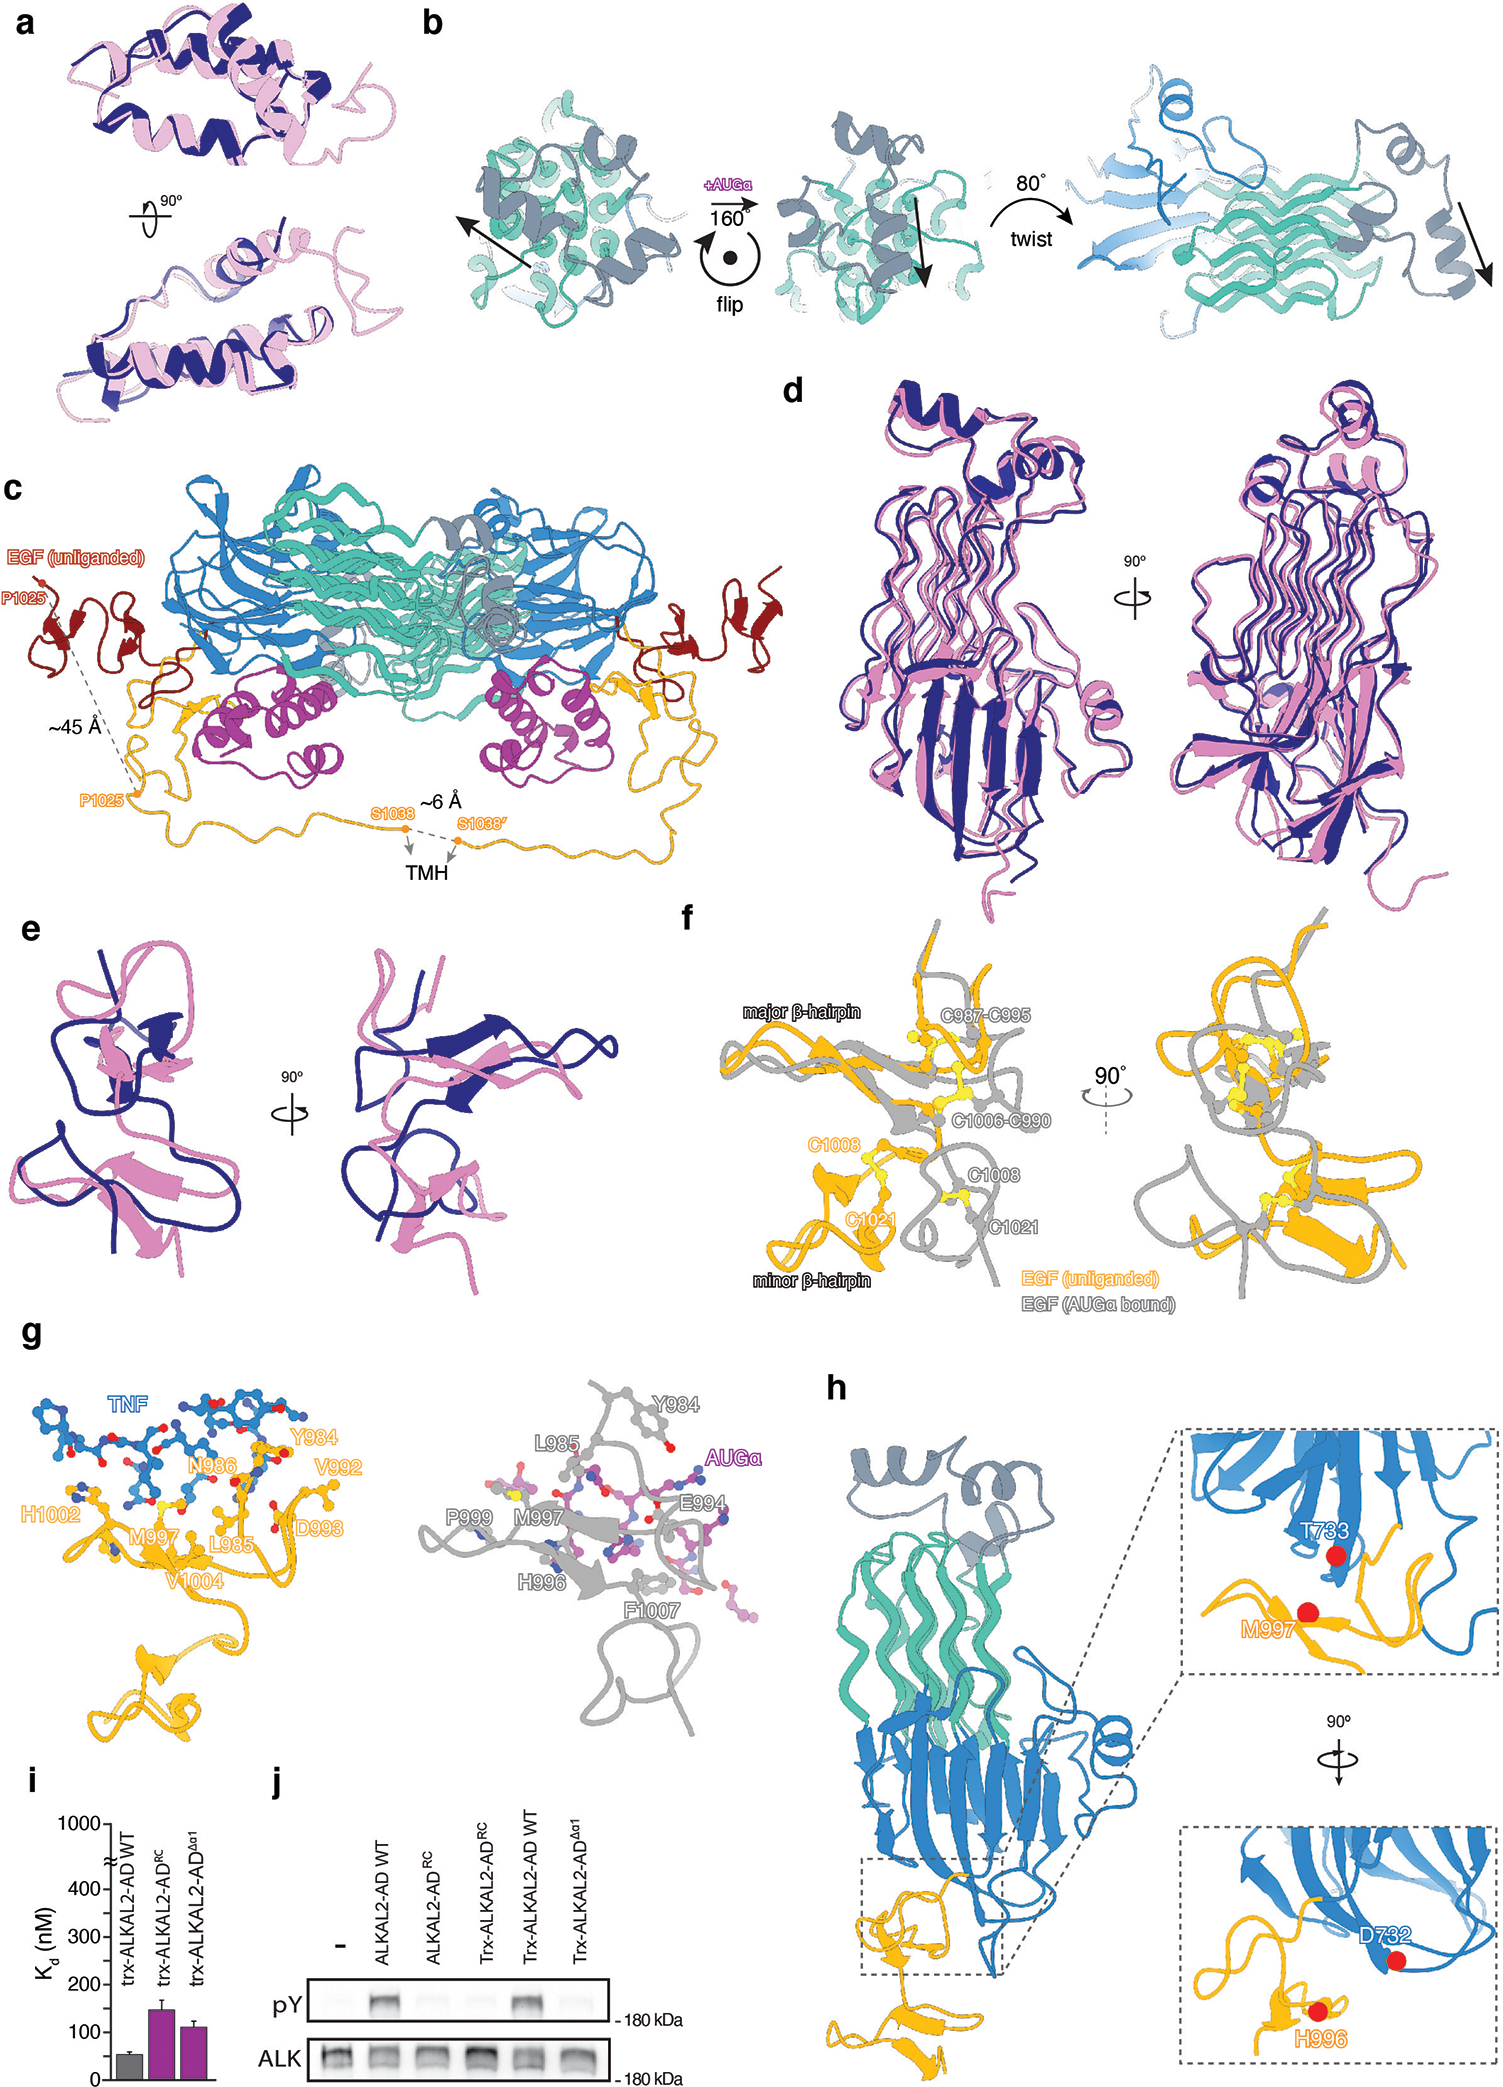
The conformational rearrangement of ALK-ECRABR upon ALKAL2 binding can be visualized as two rotation events: (i) an 80° bending of the TNF-GlyR region towards the membrane, with the linker between the TNF-like and EGF-like domains acting as a hinge; and (ii) a 160° rotation about the z axis running across the TNF-GlyR region (Fig. 4a, Extended Data Fig. 5b and Supplementary Video 1). In the full-length ALK, EGF-like is proximal to the membrane and the 80° bending would move the TNF-GlyR region towards the membrane plane (Fig. 4a). In the dimeric, activated state of ALK, the TMH from two protomers dimerize20. EGF-like is tethered to the TMH via a 13-residue-long linker (Fig. 1a), and modeling the linker in an extended conformation into the structure of ALK-ECRABR−ALKAL2 indicates that TMH dimerization is compatible with the architecture of the complex (Extended Data Fig. 5c). On the other hand, TMH dimerization would not be possible without the pronounced reorientation of ALK-ECRABR upon ALKAL2 binding (Extended Data Fig. 5c). Because of space constraints imposed by the linker tethering EGF-like and TMH, the dimeric ALK-ECRABR–ALKAL2 complex has to lie flat on the membrane (Fig. 4b). Of note, our data show that the EGF-like domain is malleable and can adjust its structure upon domain or ligand interaction (Extended Data Fig. 5d–g).
Fig. 4 |. ALKAL2-mediated receptor dimerization.
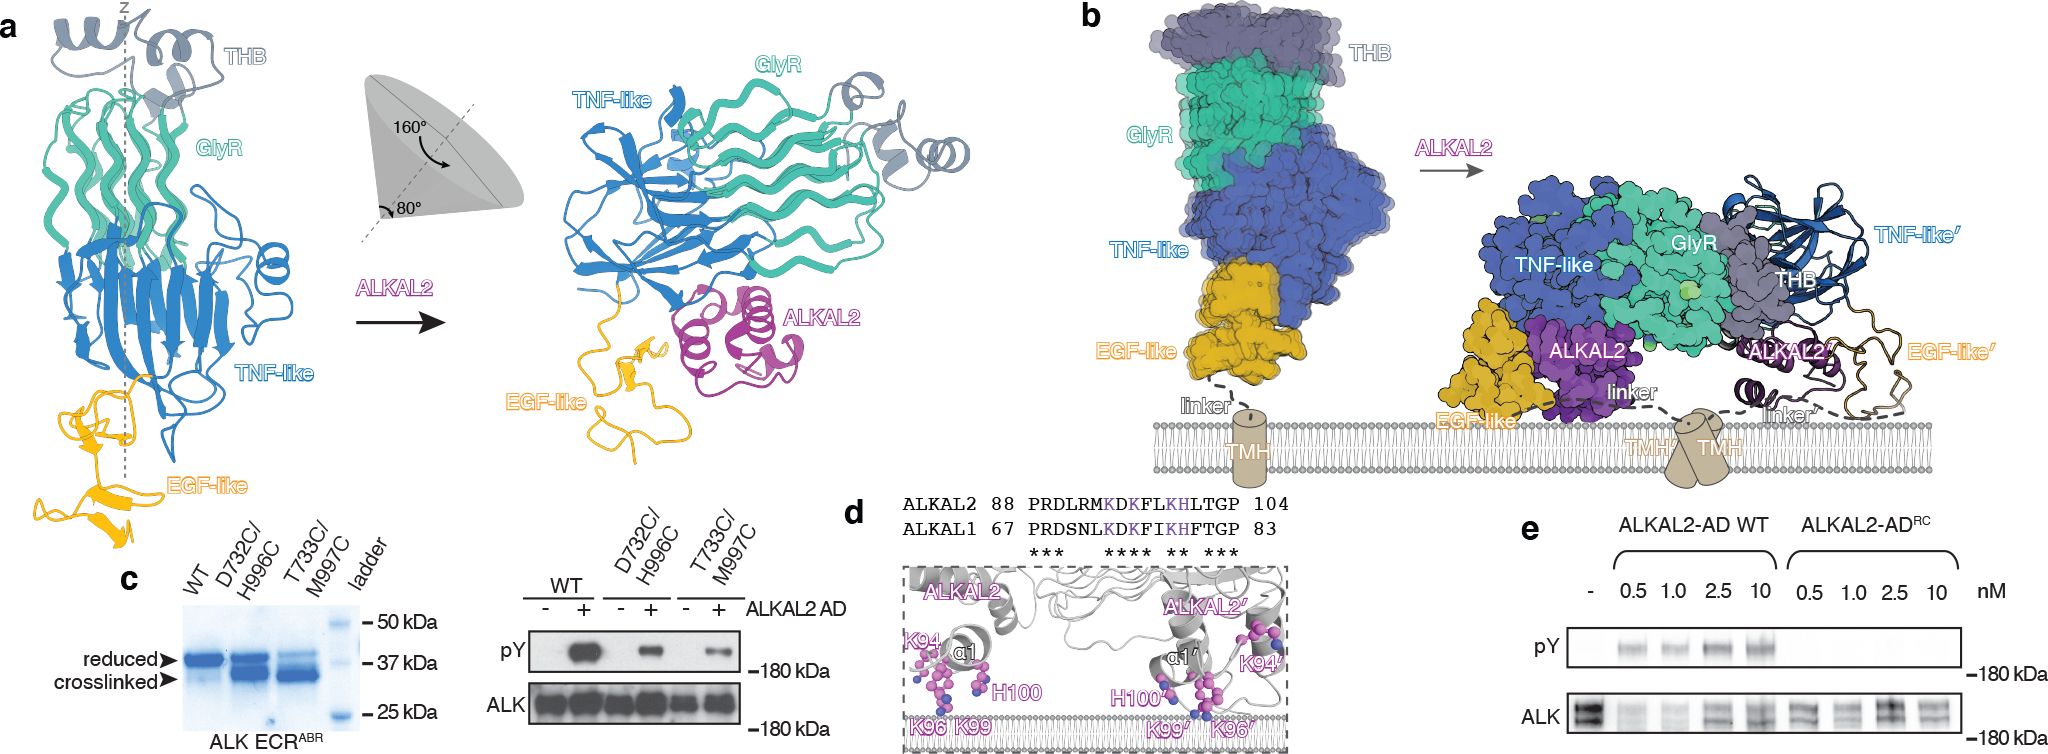
a, ALKAL2-induced repositioning of ALK-ECRABR with respect to the stationary EGF-like domain. b, The transition of ALK ECRABR from unliganded monomer to hetero-tetrameric complex with ALKAL2 is shown with respect to the membrane. See also Supplementary Video 1. c, SDS-PAGE (left) and immunoblots showing auto-phosphorylation of ALK variants in cells stimulated with 10 nM of ALKAL2-AD. SDS-PAGE was performed in non-reducing conditions to monitor crosslinking between EGF-like and TNF-like domains. d, Top, sequence alignment of α1 helix in ALKAL1 and ALKAL2, with conserved positively charged residues in magenta. Bottom, cartoon representation highlighting the positively charged residues in helix α1 of ALKAL2 that are poised to engage with the negatively charged membrane surface via electrostatic interactions. e, Immunoblots showing autophosphorylation of WT ALK in cells stimulated with indicated concentrations of ALKAL2-AD WT or ALKAL2-ADRC. pY, phospho-tyrosine; position of the180 kDa MW marker is shown in c (right) and e.
To test whether EGF-like repositioning upon ALKAL2 binding is required for receptor activation in cells, we engineered two independent intramolecular disulfide bonds between the EGF-like and the TNF-like domains that would lock the former in the orientation adopted in the unliganded ALK (Extended Data Fig. 5h). We verified formation of each disulfide bond by SDS-PAGE (Fig. 4c) and mass spectrometry analysis (Supplementary Fig. 3). ALKAL2-induced autophosphorylation of ALK was strongly compromised by introduction of either disulfide bond (Fig. 4c), thus supporting our model that repositioning of EGF-like domain is required for ALK activation.
ALKAL2 interacts with the membrane
The rearrangement of ALK-ECRABR upon ALKAL2 binding described above could be further stabilized by electrostatic attraction between ALKAL2’s positively charged surface and the membrane’s negatively charged surface (Fig. 4d). ALKAL2 α1 helix features four positively charged residues (Lys94, Lys96, Lys99, His100) that are highly conserved across species in both ALKAL1 and ALKAL2 (Fig. 4d). In our cryo-EM structure, those residues point toward where the membrane surface would be (Fig. 4d) and we tested their role in positioning ALK-ECR parallel to the membrane surface. Mutating them to Glu (K94E/K96E/K99E/H100E) generated the variant ALKAL2-ADRC (for reversed charge), which bound to ALK with high affinity in vitro (Extended Data Fig. 5i) but lost the ability to activate ALK in cells (Fig. 4e). Similarly, removing the α1 helix from ALKAL2 generated a variant (ALKAL2-ADΔα1) that could not activate ALK (Extended Data Fig. 5j). Our data provide strong evidence for the key role of the ALKAL2 α1 helix in ALK activation, presumably by anchoring ALKAL2 to the membrane.
Concluding remarks
The atomic details of the dimerization and activation of ALK reveal unique features, not seen before in RTKs. In the ligand-free state, ALK-ECRABR adopts an extended structure (Fig. 1b) that is anchored to the membrane through flexible linker (Fig.4b). This conformation of ALK-ECRABR is not compatible with dimer formation even if two ALK molecules were close together, thus corresponding to the monomeric, inert state. Binding of ALKAL1/2 induces a horizontal orientation of ALK-ECRABR (Fig. 4b), likely further stabilized by direct contacts between positively charged residues in ALKAL1/2 and the membrane surface (Fig. 4d). Interaction between ligands and the membrane is rare in RTKs21 and has not been reported for small activating ligands. As with other RTK ligands, ALKAL2 forms a homodimer that would bring two ALK molecules into close proximity, promoting receptor dimer formation. By contrast, ALKAL1 is monomeric and yet efficiently activates ALK11,12. While lateral diffusion22–24 arising from confining the receptor within the membrane is necessary, it is not sufficient for activation by a monomeric ligand (ALKAL1 or ALKAL2-AD). Accordingly, stabilization of the bent, dimerization-competent ALK-ECRABR parallel to the membrane surface has a crucial role, as it reduces the search for a second ALK protomer to a pure two-dimensional diffusion that would markedly amplify the weak dimerizing interactions between ALK-ECRs.
Ligand-induced oligomerization of RTKs occurs through different mechanisms: (i) conformational changes elicited by ligands expose dimerization motifs in the ECR (e.g., EGF-receptor family); (ii) conformational changes elicited by ligand binding to pre-existing RTK dimers (e.g., insulin receptor family); and, (iii) binding of dimeric ligands mediating homotypic ECR activating contacts (e.g., PDGFR family)25. In that regard, ALK is unique as it is activated by either a dimeric or monomeric ligand, a mechanism accomplished by the distinct architecture of its ECR, which can accommodate the geometric restraints imposed by a dimeric ligand while simultaneously poised towards efficient homodimerization even in the presence of a monomeric ligand.
While it is possible that a single ALKAL1 molecule or the AD region of ALKAL2 alone may transiently interact with ALK dimers, our structural and biophysical analyzes clearly demonstrate formation of ALKAL2-bound ALK homodimers. Moreover, ALK oligomerization can be also affected by additional interactions with cellular proteoglycans26. The main findings of this work are in agreement with the findings reported by an independent study27.
METHODS
DNA plasmids
ALK and ALKAL constructs used in this work were codon optimized for expression in E. coli and cloned into modified pET vector (Addgene #29712) using HiFi DNA assembly master mix (NEB #E262). To produce ALK fragments site specifically labeled with biotin, protein coding fragments of ALK-ECRABR were cloned into modified pCEP4 (ThermoFisher) vector in frame with N-terminal Fc-tag and C-terminal biotin acceptor peptide (BAP) followed by internal ribosome entry site (IRES) and BirA enzyme, as previously described15. For cell-based assay full-length ALK was cloned into pBabe puro as previously described12.
Protein expression and purification
The ALK-ECRABR constructs used for crystallization, NMR, cryo-EM, AUC and SEC-MALS were expressed as inclusion bodies in E. coli strain BL21-CodonPlus (DE3)-RIPL (Agilent). Inclusion bodies were washed 3 times with wash buffer (15 mM HEPES, 250 mM NaCl and 0.1% NP-40) and solubilized in solubilization buffer (10 mM Tris pH 7.5, 6 M guanidium chloride and 10 mM DTT). Solubilized inclusion bodies were diluted in dilution buffer (2.6 M guanidium chloride, 500 mM arginine chloride, 50 mM Tris⋅HCl, pH 8.8, 10 mM reduced glutathione, 1 mM oxidized glutathione, 0.001% NP-40) up to a final protein concentration of 100 mg/L and dialyzed twice against dialysis buffer (10 mM HEPES, pH 7.4, 150 mM NaCl, 0.001% NP-40). Refolded ALK-ECRABR constructs were purified by nickel affinity chromatography, SEC (HiLoad Superdex 200 26/60 equilibrated with SEC1 buffer (15 mM HEPES, pH 7.4, 500 mM NaCl, 0.5 M Urea, and 0.1% CHAPS) followed by cleavage of His-tag using Tobacco Etch Virus (TEV) protease. The ALK-ECRABR constructs were further purified by anion exchange chromatography using Source Q, equilibrated with 10 mM Tris pH 7.4, 50 mM NaCl and eluted with linear NaCl gradient 0.05–1 M, and SEC HiLoad Superdex 200 16/60, equilibrated with SEC2 buffer (15 mM HEPES, pH 7.4, 150 mM NaCl).
SeMet derivative of ALK-ECRABR-ΔEGF was expressed in non-methionine auxotrophic E. coli strain BL21-CodonPlus (DE3)-RIPL (Agilent)28. Isotopically labeled ALK-ECRABR and ALKAL samples for NMR experiments were prepared by growing cells in M9 minimal medium. For the backbone assignment 13C,15N-labeled samples were prepared by supplementing the growing medium with 15NH4Cl (1 g/L) and 13C6-glucose (2 g/L) (CIL and Isotec). The methyl and aromatically labeled samples were prepared as described before29–31.
Site specifically biotinylated ALK-ECRABR mutants were secreted from Expi293 Expression System (ThermoFisher) and purified using Protein A affinity purification. Fc-tag was cleaved using TEV protease and after Protein A subtraction, ALK fragments were separated by size exclusion chromatography (Superdex 200 Increase 10/300 GL (GE Healthcare)), equilibrated with SEC2 buffer.
All ALKAL2 constructs were expressed as insoluble inclusion bodies in E. coli15. Inclusion bodies were washed twice using wash buffer and solubilized using solubilization buffer. Solubilized proteins were diluted in dilution buffer up to 50 mg/L and refolded by dialysis using dialysis buffer. Refolded ALKAL2 constructs were purified by nickel affinity chromatography and SEC as described for ALK-ECRABR constructs. His- and solubilization-tags (MBP or trx) were cleaved using Tobacco Etch Virus (TEV) or Human Rhinovirus (HRV) 3C protease. Following tag cleavage, the ALKAL2 fragments were purified by cation exchange chromatography using Source S, equilibrated with 15 mM HEPES pH 7.4, 50 mM NaCl, 0.1% CHAPS (0.5M urea was included for full-size constructs) and eluted with linear NaCl gradient 0.05–1 M. ALKAL2 fragments were further purified using SEC HiLoad Superdex 200 16/60, equilibrated with SEC3 buffer (15 mM HEPES, pH 7.4, 150 mM NaCl, 0.1% CHAPS).
To produce ALK-ECRABR-ALKAL2C66Y complex, refolded ALK-ECRABR was mixed with refolded MBP- ALKAL2 in SEC1 buffer at 1:1 molar ratio. The complex was concentrated and MBP tag was cleaved using TEV protease followed by SEC purification (HiLoad Superdex 200 16/60 equilibrated with SEC2). To remove uncleaved MBP the complex was passed through amylose resin (NEB) and flow-through was collected. Fractions corresponding to ALK-ECRABR-ALKAL2 complex were concentrated and further purified and buffer exchanged with another round of SEC (HiLoad Superdex 200 16/60 equilibrated with SEC2 buffer). Fractions corresponding to 2:2 complex were combined and concentrated to ~ 5 mg/ml.
Structure determination of ALK-ECRABR
Our initial efforts to structurally characterize ALK-ECRABR were by X-ray crystallography, but we were unable to crystallize it. We thus turned to studying ALK-ECRABR in solution by NMR spectroscopy. Based on initial NMR experiments, we sought to improve homogeneity by removing unstructured regions and trimmed the N- and C-termini, which yielded a fragment consisting of residues 673–1025. The 1H-15N– and 1H-13C–correlated NMR spectra of ALK-ECRABR labeled in methyl-bearing (Ala, Ile, Met, Leu, Thr, and Val) and aromatic residues were of high sensitivity and resolution, and we obtained near-complete resonance assignment (Extended Data Fig. 1a,b). The structural information that emerged from the NMR analysis enabled the delineation of the GlyR, TNF-like and EGF-like domains. The NMR data (Extended Data Fig. 1a,c) suggested that the mobility of the EGF-like domain may have prevented crystallization of ALK-ECRABR. We thus prepared the ALK-ECRABR-ΔEGF variant (residues 673–986), which readily crystallized, and determined its structure to 1.5-Å-resolution by multi-wavelength anomalous diffraction (MAD) analysis (Extended Data Table 4). The asymmetric unit contained two molecules of ALK-ECRABR-ΔEGF (Extended Data Fig. 1e), both with high-quality electron density (Extended Data Fig. 1f) and allowed model building for 309 and 302 of the 314 total residues in molecules A and B, respectively. The two molecules superimpose well, with root-mean-squared deviation (r.m.s.d.) of 0.36 Å. Next, we determined by NMR the structure of the EGF-like domain in the context of ALK-ECRABR and positioned it within ALK-ECRABR by measuring inter-domain NOEs (Extended Data Fig. 1c,d). To build the structure of the entire ALK-ECRABR, we employed a hybrid approach by integrating the crystal structure of ALK-ECRABR-ΔEGF and the NMR data on EGF-like (Fig. 1b, Extended Data Table 1).
Crystallization and structure determination
ALK-ECRABR-ΔEGF crystals were grown by hanging-drop vapor diffusion at 20°C, by mixing 0.5 μl of 7.8 mg/ml of protein and 0.5 μl of reservoir solution (25.5 % PEG 4000, 15% glycerol, 0.17 M ammonium acetate and 0.085M sodium citrate pH 5.6). Single crystals were obtained by streak seeding. Se-Met labeled crystals of ALK-ECRABR-ΔEGF were obtained under the same conditions. Crystals were cryoprotected by adjusting glycerol concentration to 20%. Data from native and Se-Met derivative crystals were collected at the Southeast Regional Collaborative Access Team (SER-CAT) on ID beamline at 100K temperature. HKL2000 software32 was used to index, integrate, and scale diffraction datasets. Native and Se-Met derivative crystals grew in P21212 space group with two molecules in asymmetric unit packed in a head-to-tail arrangement (Extended Data Table 4). The phase was determined by Multiwavelength Anomalous Dispersion (MAD) method33. Seven selenium sites were located using PHENIX AutoSol34, and initial model was automatically built using PHENIX AutoBuild34. The model was refined in PHENIX35 and Coot36 to 1.5 Å with Rwork and Rfree values of 17% and 19%, respectively.
NMR Spectroscopy
All NMR data were collected on Bruker AVANCE NEO 700– 850- and 1100-MHz devices equipped with 5-mm cryogenic probes. The spectra were processed with NMRPipe37 and analyzed using NMRFAM Sparky38. A modified strategy for highly deuterated samples for de novo structure determination was employed for ALK-ECRABR (ref. 39). Transverse relaxation optimized spectroscopy (TROSY)-based 2H-decoupled triple-resonance experiments were used for backbone resonance assignment. Dihedral angle restraints were computed from the 13Cα, 13Cβ, 13C′, and backbone 1H and 15N chemical shifts using TALOSN40. Assignments for selectively [1H,13C]-labeled methyl-bearing and aromatic [1H,13C]-(Cε1-Hε1 Phe and Tyr) residues were obtained using a set of fast pulsing-based 3D 13C,15N-NOESY-HMQC and 13C,15N-HMQC-NOESY-HMQC with 300-ms mixing time using an established strategy41. Methyl assignment was aided by the MAGIC software42. ALKAL2 ligand assignment was completed utilizing traditional methodologies for small protein structure determination using U-[15N,13C] samples. Here traditional 3D HCCH-TOCSY and 3D HCCH-COSY experiments were used in addition to the 3D 15N,13C-edited NOESY to obtain backbone and sidechain assignments. Additionally, highly deuterated, selectively methyl labeled samples of ALKAL2 and ALKAL1 were prepared for the ligand for the study of the ALK-ECRABR:ALKAL1/2-AD heterodimers (1:1 complex). Assignments were transferred from the free to the ALK-ECRABR-bound forms of both ALKAL ligands. Intermolecular methyl-methyl NOEs were obtained using SOFAST methyl-NOESY experiment.
NMR Structure determination.
Structures of ALK-ECRABR, ALKAL2, and ALKAL1 were calculated using CYANA(3.98)43. Complete backbone, methyl, and aromatic side chain assignments, 3D NOESY peaklists and TALOS-derived dihedral angles, disulfide connectivities from biochemical experiments and hydrogen bonds inferred from HN-HN NOESY connectivities were used as input to CYANA automated NOE assignment protocol. Iterative cycles of structure calculation were required. The final ensemble was refined by restrained molecular dynamics in explicit water44 with CNS 1.345. Structure statistics extracted from PSVS46 and PDBstat47 packages are presented in Extended Data Table 1.
Cryo-EM data collection and processing
Since 2:2 complex with ALK-ECRABR in solution can be formed only when the full-size ALKAL2 ligand is used, we used MBP- ALKAL2 C66Y to reconstitute the complex, then we removed the MBP tag as described above for cryo-EM studies. Fractions of ALK-ECRABR-ALKAL2C66Y corresponding to 2:2 complex were used for sample vitrification and cryo-EM. 3.5 μl of 1 mg/ml of the ALK-ECRABR-ALKAL2C66Y complex was mixed with 0.5 μl of 24% PEG4000 and incubated for 5–30 seconds. Sample was loaded onto QUANTIFOIL R1.2/1/3 gold 300 mesh grids without glow-discharge and frozen in liquid-nitrogen-cooled liquid ethane using Vitrobot Mark IV (Thermo Fisher). Following settings were used for sample vitrification: blotting time 3 sec., blotting force −5, humidity 95%, temperature 10°C.
Cryo-EM data were collected at Titan Krios (Thermo Fisher) transmission electron microscope, equipped with K3 direct electron detector and post column GIF (energy filter). K3 gain reference were obtained before data collection. SerialEM software 48 was used for data collection, 9 images by image shift were collected with one defocus measurements. Movies were recorded at defocus values from −0.8 to −1.8 m at 105,000x magnification, corresponding to the pixel size of 0.826Å at the specimen level (super resolution pixel size is 0.413). 70 frames with 2.8-seconds exposure (0.04s per frame and the dose of 1.2 e/frame/A2) were collected with the total dose of ~88.4 ē, and the first frame was discarded. In total 13,597 images were collected. Motion correction was performed on raw super resolution movies stacks and binned by 2 using MotionCor2 software49. CTF parameters were determined using CTFind and refined later in Relion 3.050, cisTEM51 and cryoSPARC52. The power spectrum was manually analyzed for all micrographs and images with bad power spectrum were discarded (1,544 discarded). Particles were automatically picked using cisTEM51 and particles coordinates were transferred to Relion 3.0 (16,003,265 particles were selected). Particles containing ice, carbon edges and noise were eliminated during several rounds of 2D classification using 8x binned particles (pixel size =6.608 Å/pixel) and resulted in approximately 12,422,486 particles for further analysis. 863,243 particles were selected for further analysis after 3D classification in cryoSPARC. These particles were re-extracted with bin 1 and used for 3D classification with C2 symmetry in Relion. The best 3D class (188,516 particles) was refined to 2.64 Å resolution. The same particles were transferred to cryoSPARC and refined with C2 symmetry to 2.27 Å resolution. The major difference between high resolution (2.27 Å) structure from cryoSPARC and lower resolution (2.64 Å) from Relion is that EGF-like domain is not well defined in a higher resolution map.
The initial model for ALK-ECRABR-ALKAL2C66Y complex was built using our X-ray model of ALK-ECRABR-ΔEGF and the NMR structure of ALKAL2, which were docked into the cryo-EM density using Chimera53. EGF-like domains were manually built in Coot and the whole structure was iteratively refined in PHENIX using real-space refinement54 with secondary structure restraints. Model quality was validated using the MolProbity55. The density maps sharpened in cryoSPARC or Relion were used to produce figures using UCSF ChimeraX, Chimera and PyMOL (The PyMOL Molecular Graphics System, Version 2.0 Schrödinger, LLC).
Stable NIH 3T3 Cell Lines, Immunoprecipitation, and Immunoblotting Experiments.
NIH 3T3, cells stably expressing ALK were generated and cultured as described previously12. Cells were starved for 20 h in serum-free medium before stimulation for 10 min with indicated amount of ALKAL2-AD. Cell lysates were incubated with anti-ALK antibodies (CellSignaling #3633) and protein A Sepharose (Invitrogen) overnight at 4 °C. The immunocomplexes were washed, boiled for 5 min with Laemmli sample buffer (BioRad), separated on SDS/PAGE, and then immunoblotted with anti-ALK (CellSignaling #3633) or anti-pTyr (Millipore # 05–321) antibodies.
Affinity measurements of ALK interactions with ALKAL2
Binding measurements were performed by Bio-Layer Interferometry (BLI) on the Octet RED (ForteBio) equipped with super streptavidin biosensor chips (ForteBio). Super streptavidin biosensor chips were pre-wetted for 5 min in BLI wash buffer (15 mM HEPES pH 7.4, 150 mM NaCl). 10 μg/mL of biotinylated ALK fragments were immobilized on super streptavidin biosensor chips for 600 sec and free streptavidin sites were blocked with 100 μg/mL of biotinylated BSA for 60 sec at room temperature with 1000 rpm rotated condition. Biosensor chips were washed 150 sec in BLI wash buffer at room temperature with 1000 rpm rotated condition. Then 2000–5 nM of ALKAL2-AD fragments were loaded in sample well in BLI kinetic buffer (15 mM HEPES pH 7.4, 500 mM NaCl, 125 mM guanidine chloride, 0.05% Tween 20 and 1mg/ml bovine serum albumin). Association and the dissociation measurements were taken for 100 and 300 sec respectively at room temperature with 1000 rpm rotated condition. Steady-state dissociation constants and standard errors were calculated by the Octet data analysis software version 9.0 (ForteBio) according to previously published method56. Measurements for each ALK or ALKAL variant were performed at least twice, and the results were highly reproducible.
Sedimentation velocity Analytical Ultra Centrifugation (SV-AUC)
SV-AUC experiments were conducted in a ProteomeLab XL-I analytical ultracentrifuge (Beckman Coulter, Indianapolis, IN) following standard protocols57. Samples were loaded into cell assemblies comprised of double sector charcoal-filled centerpieces with a 12 mm path length and sapphire windows. SEC1 buffer was used for all ALKAL2 samples and SEC2 buffer was used for ALK-ECRABR samples or ALK-ECRABR in complex with ALKAL2C66Y or ALKAL1. Buffer density and viscosity were calculated using the software SEDNTERP. The partial specific volumes and the molecular masses of the proteins were calculated based on their amino acid compositions in SEDFIT58. The cell assemblies, containing identical sample and reference buffer volumes of 390 μL, were placed in a rotor and temperature equilibrated at rest at 20 °C for 2 hours before it was accelerated from 0 to 50,000 rpm. Rayleigh interference optical data were collected at 1-minute intervals for 12 hours. The velocity data were modeled with diffusion-deconvoluted sedimentation coefficient distributions c(s) in SEDFIT, using algebraic noise decomposition and with signal-average frictional ratio and meniscus position refined with non-linear regression. The s-values were corrected for time and finite acceleration of the rotor was accounted for in the evaluation of Lamm equation solutions59. Maximum entropy regularization was applied at a confidence level of P-0.70. All plots were created in GUSSI60.
Size Exclusion and Multiangle Laser Light Scattering
SEC-MALS data were collected using a Superdex 200 Increase 10/300 GL column (GE Healthcare) connected to a Hitachi HPLC system and Wyatt light scattering detector. Elution was monitored by a photodiode array UV/VIS detector (2996 PDA, Waters Corp.), differential refractometer (RI) (OptiLab-rEx Wyatt Corp.), and static, multiangle laser light scattering detector (DAWN-EOS, Wyatt Corp.). The system was equilibrated with SEC2 buffer for ALK-ECRABR samples and for ALK-ECRABR- in complex with ALKAL2C66Y, ALKAL2-AD or ALKAL1 samples; ALKAL2C66Y and ALKAL1 samples were analyzed in SEC1 buffer. All measurements were performed at flow rate of 0.5 ml/min, at room temperature. Concentrations of eluted proteins were determined using RI detector. Weight average molecular masses were determined from Zimm plot. ASTRA software (Wyatt Technology) was used to analyze data as described in ref. 61. Dissociation constants (KD) were determined by fitting weight average molar mass across a range of protein concentrations to Equation1 (Mw=Mr*((8*[M]T+KD-√(Kd2+(8*[M]T*KD)))/(4*x))) using nonlinear regression. Where Mw is the weight average molar mass, [M]T is the molar concentration of protein (measured using RI signal), and Mr is molecular mass of monomer. Nonlinear regression analysis was performed using QtiPlot software. The apparent dimerization constant for ALK-ECRABR-ALKAL2C66Y (transition from 1:1 to 2:2 complex), derived from AUC and SEC-MALS data, was calculated as a simple dimerization model. ALKAL2 is almost exclusively monomeric in the concentrations used for measuring ALKAL2-bound ALK dimerization, and ligand dissociation was not considered because the receptor-ligand dissociation constant is two orders-of-magnitude lower than the dimerization constant of the complex.
Statistics and reproducibility
The background phosphorylation varies between different ALK variants in the cell based autophosphorylation assay. This variability is caused primarily by difference in the expression level on the cell surface of ALK mutants. To make sure that our conclusions are valid and correct all ALK autophosphorylation experiments were repeated independently in different cells with similar results for Fig. 2c/Extended Data Fig. 3d (n = 5), Fig. 4c (n = 3), 4e (n = 2), Extended Data Figs. 3e, h and 5j (n = 2).
Data availability
Atomic coordinates have been deposited under the Protein Data Bank (PDB) accession codes 7N00 (cryoEM structure of ALK ECRABR-ALKAL2), 7NZY (X-ray structure of ALK ECRABR-ΔEGF), 7MZW (X-ray/NMR hybrid structure of ALK ECRABR), 7MZX (NMR structure of ALKAL2), 7MZZ (NMR structure of ALKAL1). The cryo-EM density map of ALK-ECR-AUGα has been deposited in the Electron Microscopy Data Bank (EMDB) under accession code 24095. NMR resonance assignments have been deposited in the Biological Magnetic Resonance Bank under accession codes 30910 (ALK ECRABR), 30911 (ALKAL2), 30912 (ALKAL1).
Construct boundaries used in this work:
Proteins expressed in E.coli:
>ALK648–1030
MKSSHHHHHHGIEENLYFQGTAPKSRNLFERNPNKELKPGENSPRQTPIFDPTVHWLFTTCGASGPHGPTQAQCNNAYQNSNLSVEVGSEGPLKGIQIWKVPATDTYSISGYGAAGGKGGKNTMMRSHGVSVLGIFNLEKDDMLYILVGQQGEDACPSTNQLIQKVCIGENNVIEEEIRVNRSVHEWAGGGGGGGGATYVFKMKDGVPVPLIIAAGGGGRAYGAKTDTFHPERLENNSSVLGLNGNSGAAGGGGGWNDNTSLLWAGKSLQEGATGGHSCPQAMKKWGWETRGGFGGGGGGCSSGGGGGGYIGGNAASNNDPEMDGEDGVSFISPLGILYTPALKVMEGHGEVNIKHYLNCSHCEVDECHMDPESHKVICFCDHGTVLAEDGVSCIVSPTPEPH
>ALK-ECRABR (residues 673–1025)
MKSSHHHHHHGIEENLYFQGQTPIFDPTVHWLFTTCGASGPHGPTQAQCNNAYQNSNLSVEVGSEGPLKGIQIWKVPATDTYSISGYGAAGGKGGKNTMMRSHGVSVLGIFNLEKDDMLYILVGQQGEDACPSTNQLIQKVCIGENNVIEEEIRVNRSVHEWAGGGGGGGGATYVFKMKDGVPVPLIIAAGGGGRAYGAKTDTFHPERLENNSSVLGLNGNSGAAGGGGGWNDNTSLLWAGKSLQEGATGGHSCPQAMKKWGWETRGGFGGGGGGCSSGGGGGGYIGGNAASNNDPEMDGEDGVSFISPLGILYTPALKVMEGHGEVNIKHYLNCSHCEVDECHMDPESHKVICFCDHGTVLAEDGVSCIVSP
List of ALK-ECRABR mutations used for NMR assignment: L684I; I736L; L760I; I762L; I801L; I805L; T855A; L861I; W891I; I959L; L960I; L965I; L970I.
>ALK-ECRABR-ΔEGF (residues 673–986)
MKSSHHHHHHGIEENLYFQGQTPIFDPTVHWLFTTCGASGPHGPTQAQCNNAYQNSNLSVEVGSEGPLKGIQIWKVPATDTYSISGYGAAGGKGGKNTMMRSHGVSVLGIFNLEKDDMLYILVGQQGEDACPSTNQLIQKVCIGENNVIEEEIRVNRSVHEWAGGGGGGGGATYVFKMKDGVPVPLIIAAGGGGRAYGAKTDTFHPERLENNSSVLGLNGNSGAAGGGGGWNDNTSLLWAGKSLQEGATGGHSCPQAMKKWGWETRGGFGGGGGGCSSGGGGGGYIGGNAASNNDPEMDGEDGVSFISPLGILYTPALKVMEGHGEVNIKHYLN
>Trx-ALKAL2-AD (residues 77–152)
MKSSHHHHHHGSSMSDKIIHLTDDSFDTDVLKADGAILVDFWAEWCGPCKMIAPILDEIADEYQGKLTVAKLNIDQNPGTAPKYGIRGIPTLLLFKNGEVAATKVGALSKGQLKEFLDANLAGIELEVLFQGPSPEQRVEIVPRDLRMKDKFLKHLTGPLYFSPKCSKHFHRLYHNTRDCTIPAYYKRCARLLTRLAVSPVCMEDKQ
>Trx- ALKAL2-ADΔɑ1 (residues 103–152)
MKSSHHHHHHGSSMSDKIIHLTDDSFDTDVLKADGAILVDFWAEWCGPCKMIAPILDEIADEYQGKLTVAKLNIDQNPGTAPKYGIRGIPTLLLFKNGEVAATKVGALSKGQLKEFLDANLAGIELEVLFQGPLYFSPKCSKHFHRLYHNTRDCTIPAYYKRCARLLTRLAVSPVCMEDKQ
>MBP-ALKAL1 (full-length)
MKSSHHHHHHGSSMKIEEGKLVIWINGDKGYNGLAEVGKKFEKDTGIKVTVEHPDKLEEKFPQVAATGDGPDIIFWAHDRFGGYAQSGLLAEITPDKAFQDKLYPFTWDAVRYNGKLIAYPIAVEALSLIYNKDLLPNPPKTWEEIPALDKELKAKGKSALMFNLQEPYFTWPLIAADGGYAFKYENGKYDIKDVGVDNAGAKAGLTFLVDLIKNKHMNADTDYSIAEHAFNHGETAMTINGPWAWSNIDTSAVNYGVTVLPTFKGQPSKPFVGVLSAGINAASPNKELAKEFLENYLLTDEGLEAVNKDKPLGAVALKSYEEELAKDPRIAATMENAQKGEIMXNIPQMSAFWYAVRTAVINAASGRQTVDEALKDAQTGGGGSGGGGSENLYFQGRPRGRRGARVTDKEPKPLLFLPAAGAGRTPSGSRSAEIFPRDSNLKDKFIKHFTGPVTFSPECSKHFHRLYYNTRECSTPAYYKRCARLLTRLAVSPLCSQT
>MBP-ALKAL2 (full-length)
MKSSHHHHHHGSSMKIEEGKLVIWINGDKGYNGLAEVGKKFEKDTGIKVTVEHPDKLEEKFPQVAATGDGPDIIFWAHDRFGGYAQSGLLAEITPDKAFQDKLYPFTWDAVRYNGKLIAYPIAVEALSLIYNKDLLPNPPKTWEEIPALDKELKAKGKSALMFNLQEPYFTXPLIAADGGYAFKYENGKYDIKDVGVDNAGAKAGLTFLVDLIKNKHMNADTDYSIAEHAFNHGETAMTINGPWAWSNIDTSAVNYGVTVLPTFKGQPSKPFVGVLSAGINAASPNKELAKEFLENYLLTDEGLEAVNKDKPLGAVALKSYEEELAKDPRIAATMENAQKGEIMPNIPQMSAFWYAVRTAVINAASGRQTVDEALKDAQTGGGGSGGGGSENLYFQGAEPREPADGQALLRLVVELVQELRKHHSAEHKGLQLLGRDYALGRAEAAGLGPSPEQRVEIVPRDLRMKDKFLKHLTGPLYFSPKCSKHFHRLYHNTRDCTIPAYYKRCARLLTRLAVSPVCMEDKQ
Proteins expressed in Expi293 cells using pCEP4 vector as a bicistronic together with BirA. Were used for BLI analysis:
>Fc-ALKavi
METDTLLLWVLLLWVPGSTGAGSTHTCPPCPAPELLGGPSVFLFPPKPKDTLMISRTPEVTCVVVDVSHEDPEVKFNWYVDGVEVHNAKTKPREEQYNSTYRVVSVLTVLHQDWLNGKEYKCKVSNKALPAPIEKTISKAKGQPREPQVYTLPPSRDELTKNQVSLTCLVKGFYPSDIAVEWESNGQPENNYKTTPPVLDSDGSFFLYSKLTVDKSRWQQGNVFSCSVMHEALHNHYTQKSLSLSPGKTSLYKKAERSLSPGKTSLYKKAGFENLYFQGQTPIFDPTVHWLFTTCGASGPHGPTQAQCNNAYQNSNLSVEVGSEGPLKGIQIWKVPATDTYSISGYGAAGGKGGKNTMMRSHGVSVLGIFNLEKDDMLYILVGQQGEDACPSTNQLIQKVCIGENNVIEEEIRVNRSVHEWAGGGGGGGGATYVFKMKDGVPVPLIIAAGGGGRAYGAKTDTFHPERLENNSSVLGLNGNSGAAGGGGGWNDNTSLLWAGKSLQEGATGGHSCPQAMKKWGWETRGGFGGGGGGCSSGGGGGGYIGGNAASNNDPEMDGEDGVSFISPLGILYTPALKVMEGHGEVNIKHYLNCSHCEVDECHMDPESHKVICFCDHGTVLAEDGVSCIVSPGLNDIFEAQKIEWHE
Proteins expressed in NIH 3T3 cells for cell-based phosphorylation assay:
>pBabe-ALK
MGAIGLLWLLPLLLSTAAVGSGMGTGQRAGSPAAGPPLQPREPLSYSRLQRKSLAVDFVVPSLFRVYARDLLLPPSSSELKAGRPEARGSLALDCAPLLRLLGPAPGVSWTAGSPAPAEARTLSRVLKGGSVRKLRRAKQLVLELGEEAILEGCVGPPGEAAVGLLQFNLSELFSWWIRQGEGRLRIRLMPEKKASEVGREGRLSAAIRASQPRLLFQIFGTGHSSLESPTNMPSPSPDYFTWNLTWIMKDSFPFLSHRSRYGLECSFDFPCELEYSPPLHDLRNQSWSWRRIPSEEASQMDLLDGPGAERSKEMPRGSFLLLNTSADSKHTILSPWMRSSSEHCTLAVSVHRHLQPSGRYIAQLLPHNEAAREILLMPTPGKHGWTVLQGRIGRPDNPFRVALEYISSGNRSLSAVDFFALKNCSEGTSPGSKMALQSSFTCWNGTVLQLGQACDFHQDCAQGEDESQMCRKLPVGFYCNFEDGFCGWTQGTLSPHTPQWQVRTLKDARFQDHQDHALLLSTTDVPASESATVTSATFPAPIKSSPCELRMSWLIRGVLRGNVSLVLVENKTGKEQGRMVWHVAAYEGLSLWQWMVLPLLDVSDRFWLQMVAWWGQGSRAIVAFDNISISLDCYLTISGEDKILQNTAPKSRNLFERNPNKELKPGENSPRQTPIFDPTVHWLFTTCGASGPHGPTQAQCNNAYQNSNLSVEVGSEGPLKGIQIWKVPATDTYSISGYGAAGGKGGKNTMMRSHGVSVLGIFNLEKDDMLYILVGQQGEDACPSTNQLIQKVCIGENNVIEEEIRVNRSVHEWAGGGGGGGGATYVFKMKDGVPVPLIIAAGGGGRAYGAKTDTFHPERLENNSSVLGLNGNSGAAGGGGGWNDNTSLLWAGKSLQEGATGGHSCPQAMKKWGWETRGGFGGGGGGCSSGGGGGGYIGGNAASNNDPEMDGEDGVSFISPLGILYTPALKVMEGHGEVNIKHYLNCSHCEVDECHMDPESHKVICFCDHGTVLAEDGVSCIVSPTPEPHLPLSLILSVVTSALVAALVLAFSGIMIVYRRKHQELQAMQMELQSPEYKLSKLRTSTIMTDYNPNYCFAGKTSSISDLKEVPRKNITLIRGLGHGAFGEVYEGQVSGMPNDPSPLQVAVKTLPEVCSEQDELDFLMEALIISKFNHQNIVRCIGVSLQSLPRFILLELMAGGDLKSFLRETRPRPSQPSSLAMLDLLHVARDIACGCQYLEENHFIHRDIAARNCLLTCPGPGRVAKIGDFGMARDIYRASYYRKGGCAMLPVKWMPPEAFMEGIFTSKTDTWSFGVLLWEIFSLGYMPYPSKSNQEVLEFVTSGGRMDPPKNCPGPVYRIMTQCWQHQPEDRPNFAIILERIEYCTQDPDVINTALPIEYGPLVEEEEKVPVRPKDPEGVPPLLVSQQAKREEERSPAAPPPLPTTSSGKAAKKPTAAEISVRVPRGPAVEGGHVNMAFSQSNPPSELHKVHGSRNKPTSLWNPTYGSWFTEKPTKKNNPIAKKEPHDRGNLGLEGSCTVPPNVATGRLPGASLLLEPSSLTANMKEVPLFRLRHFPCGNVNYGYQQQGLPLEAATAPGAGHYEDTILKSKNSMNQPGP
Extended Data
Extended Data Fig. 1 |. Structural features of ALK ECRABR.
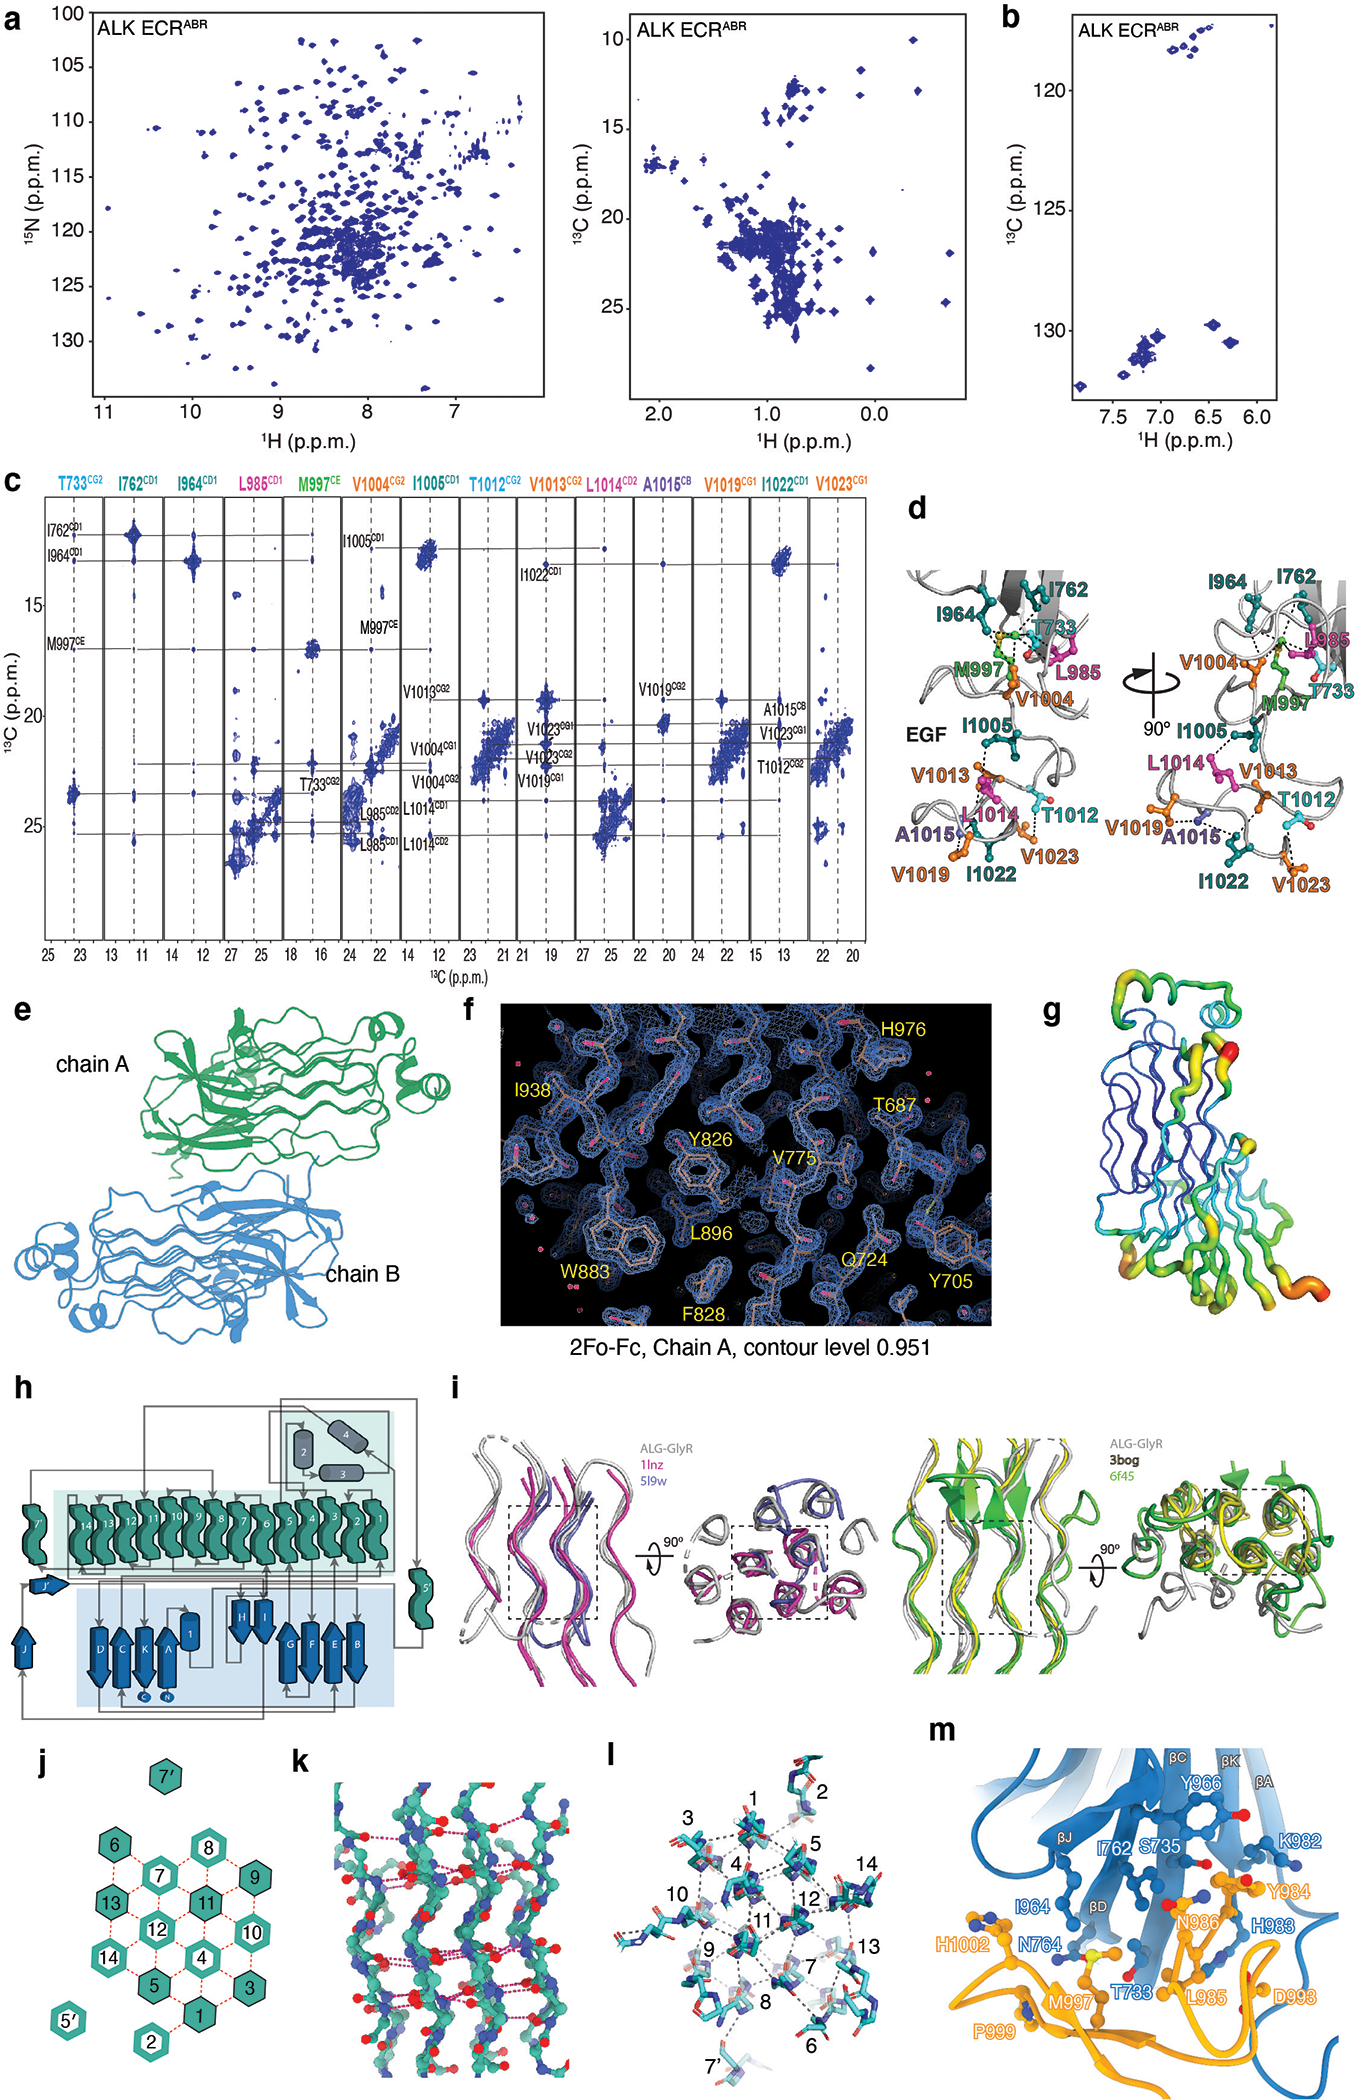
a, 1H-15N–correlated (left panel) and 1H-13C–correlated (right panel) spectra of [U-2H,15N; Ala-13CH3; Met-13CH3; Ile-δ1-13CH3; Leu,Val-13CH3/13CH3; Thr-13CH3]-labelled ALK ECRABR. b, 1H-13C–correlated spectra of [U-2H; Phe-δ−13CH; Tyr-ε−13CH]-labeled ALK ECRABR. c, Select strips from 13C-edited NOESY experiments highlighting intra-domain NOEs between TNF-like and EGF-like. d, Close-up view of the TNF-like−EGF-like interface and close-range inter-proton contacts (within ~7 Å) observed from the NOESY NMR analysis of spectra shown in (c). e, Asymmetric unit content of ALK ECRABR-ΔEGF crystals. f, 2Fo-Fc map of ALK ECRABR-ΔEGF depicted at 0.951 contour level for chain A. g, B-factors of ALK ECRABR-ΔEGF (chain A) are mapped on its structure. The tube radius is proportional to the B-factor. Low-to-high B-factors are also denoted in a blue-to-red color gradient. h, Topology diagram of ALK ECRABR-ΔEGF. PGII helices are shown in green tubes, β-strands in arrows and α helices in cylinders. i, Superposition of the following structures: ALK ECRABR GlyR (grey, this work), glycine rich domain of GTP-binding protein Obg (red, PDB ID 1LNZ), acetophenone carboxylase (blue, PDB ID 5L9W), antifreeze protein (yellow, PDB ID 3BOG), and gp38 bacteriophage adhesin tip (green, PDB ID 6F45). j, Schematic representation of the GlyR PGII array shown in a top view. Solid hexagons denote PGII helices with an N-to-C direction towards the reader whereas open hexagons denote PGII helices in the opposite direction. k, Side view of the GlyR PGII array in ball-and-stick representation. l, Top view of GlyR PGII array showing inter-chain hydrogen bond network (grey dashes). m, Close-up view of the TNF-like−EGF-like interface.
Extended Data Fig. 2 |. ALK/LTK sequence comparison and structural characterization of ALKAL2.
a, Schematic representation of domain organization for human ALK and LTK receptors (left panel). Sequence alignment of ALK and LTK ECRs (right panel). The secondary structure diagram is shown based on the ALK ECRABR structure determined in this work. Cys residues are colored red and disulfide bridges are shown with red lines. Residues participating in ALKAL2 binding are colored magenta, and residues participating in inter-protomer dimerization are underlined and colored blue (contacts with TNF-like) and gray (contacts with THB). The key residues involved in ALKAL2 binding are conserved between ALK and LTK (highlighted with magenta in LTK sequence), with the exception of F143, S260, L361, Q362, A365, T367, E374, R376, D388, Q390 and L401 (LTK numbering, underlined with black lines). The difference in ALKAL2/1 specificity might be explained by the H120/Y99 and D124/E103 substitutions (ALKAL2/1 respectively) and/or difference in the receptor-receptor dimerization interface. b, SEC-MALS (upper panel) analysis of ALKAL2-AD at eluted concentrations of ∼67 μM (red), 11 μM (blue) and 1 μM (magenta). Molecular masses in kDa determined by in-line MALS (left axis) are included. SV-AUC profile of ALKAL2-AD (lower panel). Concentrations used are: 233.53 (purple), 111.25 (blue) and 55.62 μM (cyan). c, 1H-15N–correlated (left panel) and 1H-13C–correlated (right panel) NMR spectra of ALKAL2-AD. d, NMR ensemble of the 20 lowest-energy conformers of ALKAL2-AD. e, Electrostatic surface representation of ALKAL2-AD. The electrostatic potential is measured in eV, with range as shown in the corresponding color bar (from-5.000 to +5.000 eV). f, NMR ensemble of the 20 lowest-energy conformers of ALKAL1-AD. g, SV-AUC profile and sedimentation coefficient distribution model c(s) of MBP-ALKAL2C66Y (left panel). Concentrations used are: 96.9 μM (purple), 48.5 μM (blue), 29.4 μM (cyan), 12.1 μM (green), 6.9 μM (yellow), 3.5 μM (orange) and 1.7 μM (red). Isotherm of the signal-weight-average s-values (sw) for MBP- ALKAL2C66Y obtained by integration of c(s) distributions over the s-range of 2.5 and 5 S for each loading concentration in a dilution series (right panel). The confidence intervals of the fits are presented in the lower panel. h, Superposition of NMR-solved and AlphaFold-predicted structures of ALKAL2 (left panel) and ALKAL1 (right panel). AD and VR regions are labeled. i, SV-AUC profile of ALK ECRABR-ALKAL2-AD. Concentrations used are: 177.8 (purple), 87.87 (blue), 43.93 (cyan), 20.92 (green), 10.46 (yellow), 5.44 (orange) and 2.72 μM (red). j, SV-AUC profile and sedimentation coefficient distribution model c(s) of MBP-ALKAL1. The highest (96.6 μM - purple) and lowest (4.8 μM - orange) concentrations are shown. k, SEC-MALS profile for the ALK ECRABR−MBP-ALKAL1 complex (blue, theoretical mass of 91 kDa for 1:1 complex). The profile for the ALK ECRABR−MBP-ALKAL2C66Y complex (red, theoretical mass of 189 kDa for 2:2 complex) is included for direct comparison. l, Sedimentation velocity analytical ultracentrifugation profile of ALK ECRABR:MBP-ALKAL1 (loading concentration 74 μM).
Extended Data Fig. 3 |. Characterization of the binding mode and oligomeric state of the ALK ECRABR:ALKAL2 complex.
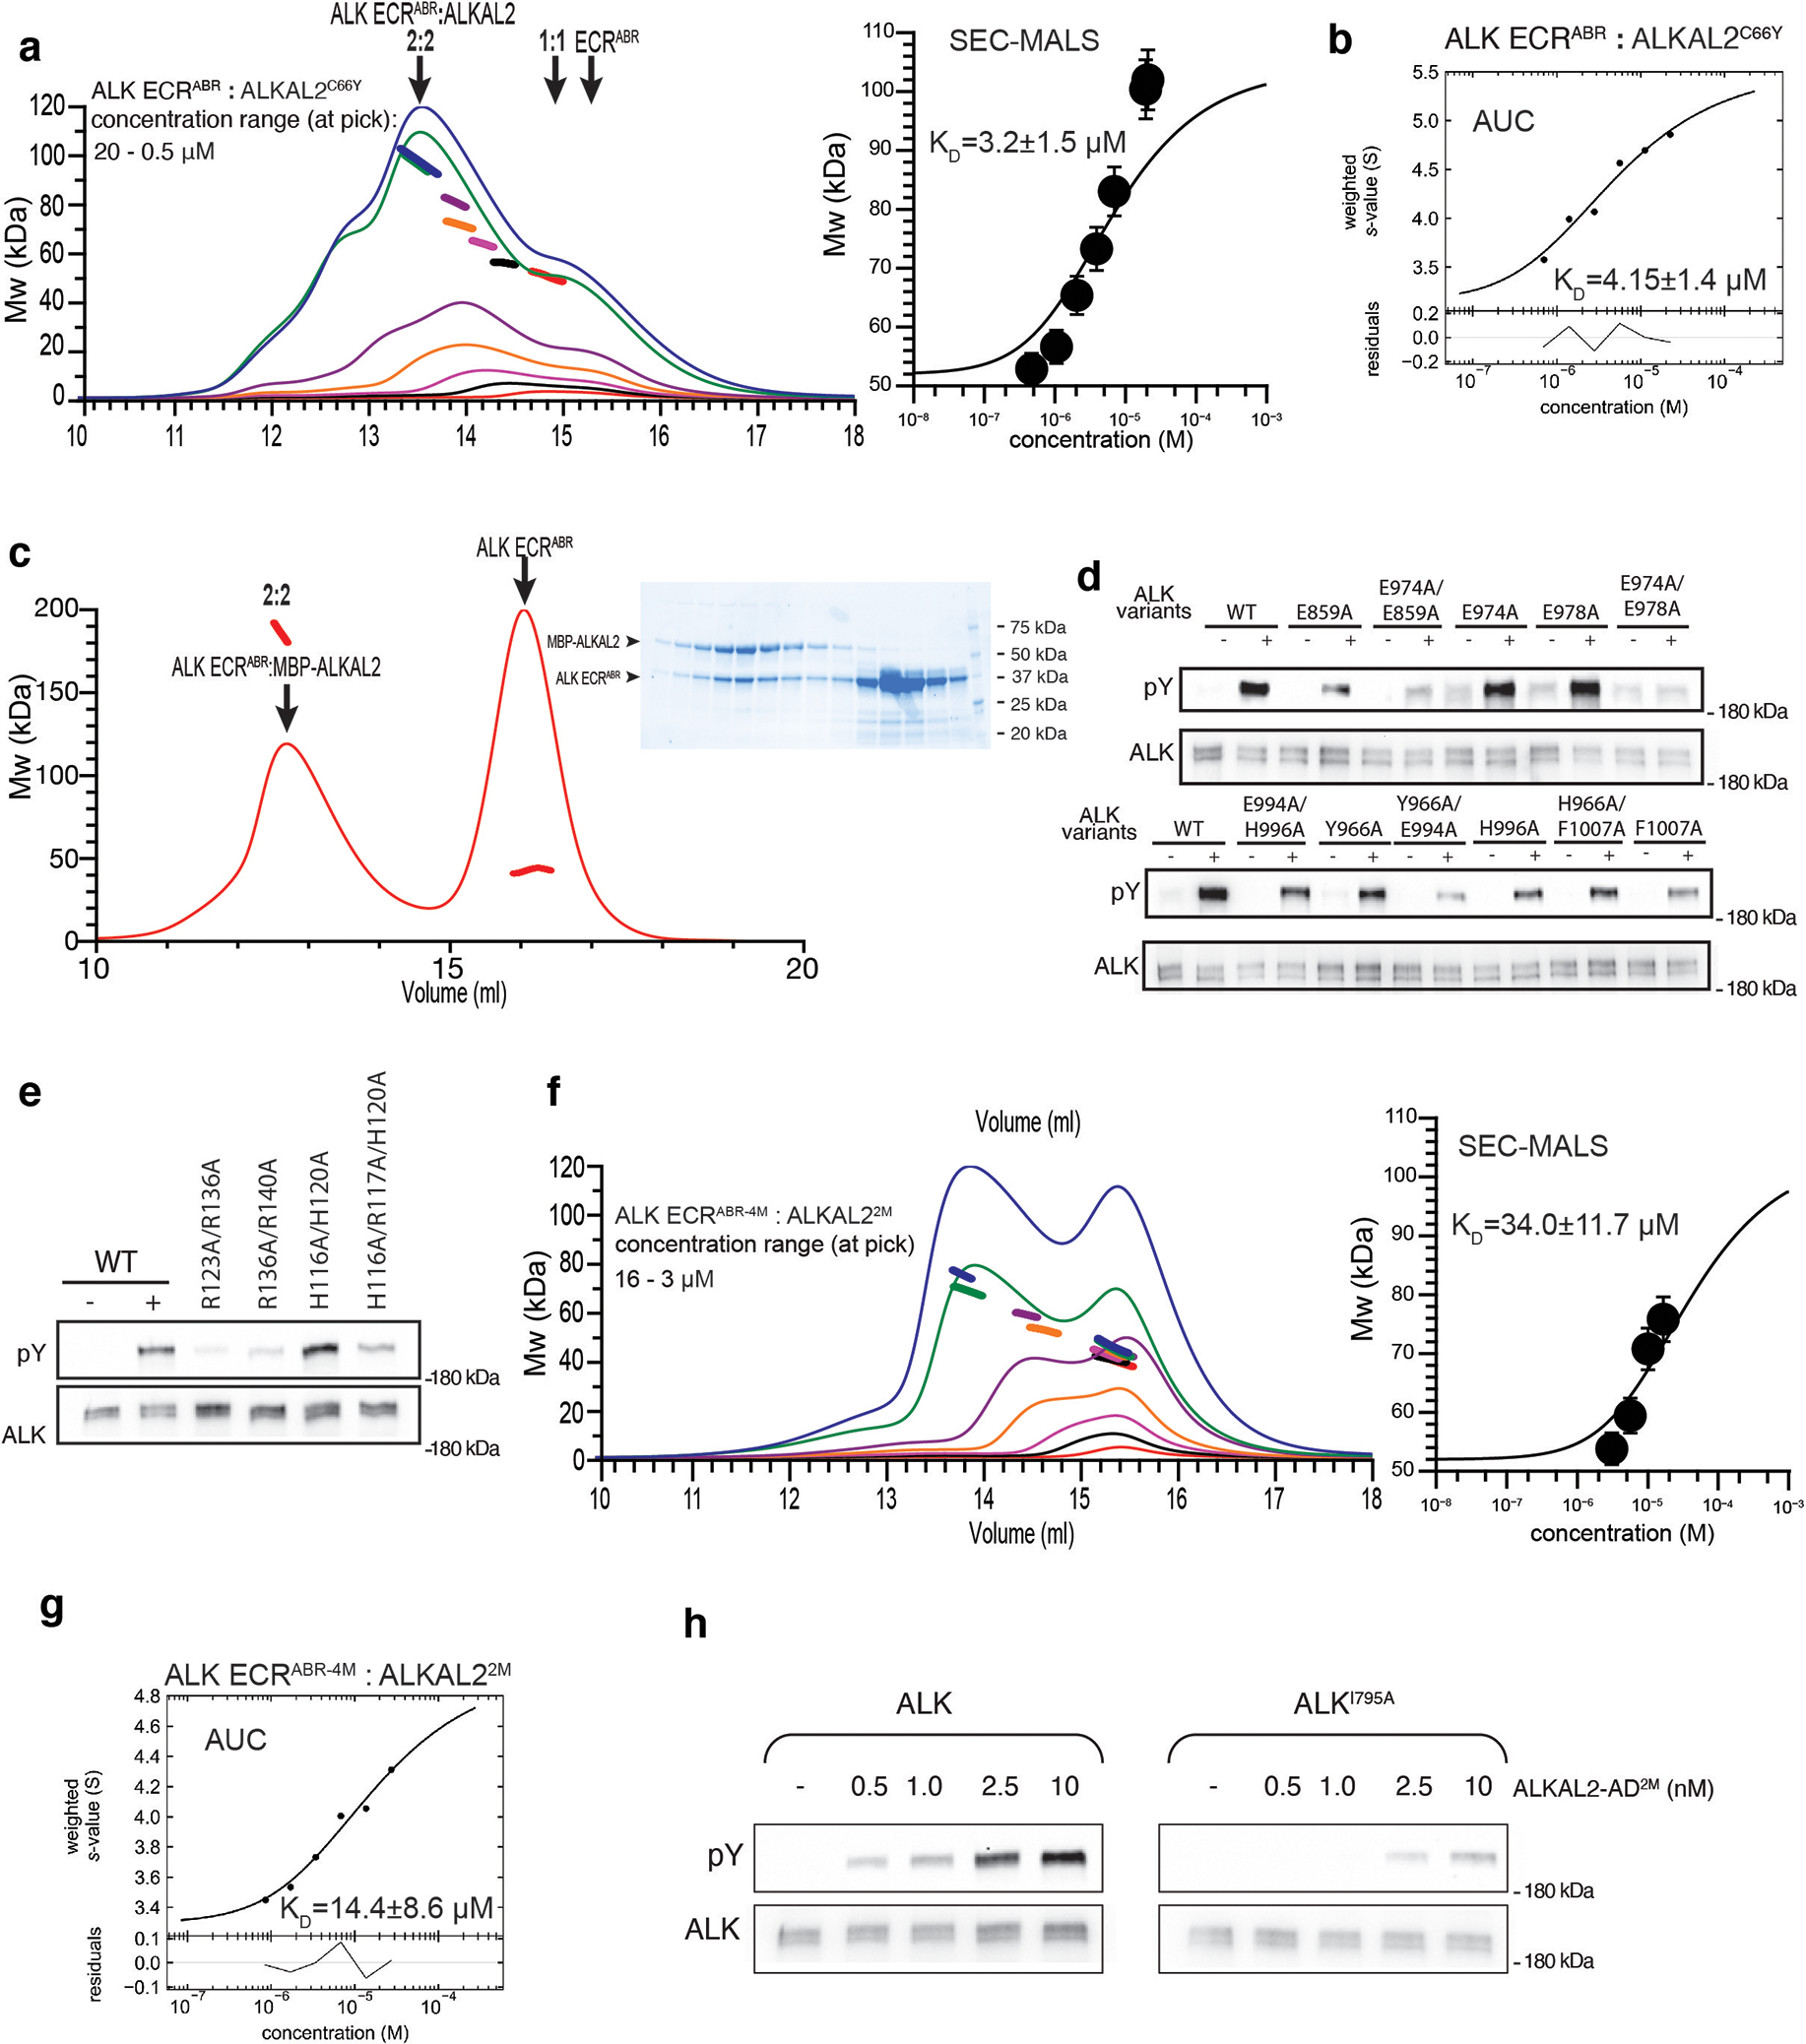
a, SEC-MALS profiles of ALK ECRABR-ALKAL2C66Y complex. The corresponding isotherm of the signal-weight-average MW as a function of concentration is shown in the right panel. Standard errors were determined according to61. b, Sedimentation velocity analytical ultracentrifugation isotherm of the signal-weight-average s-values for ALK ECRABR:ALKAL2C66Y complex. c, SEC-MALS profile (red) of ALK ECRABR:MBP-ALKAL2C66Y complex mixed at 2:1 ratio. SDS/PAGE for corresponding fractions are shown in the right panel. Bands corresponding to ALK ECRABR or MBP-ALKAL2C66Y are labeled, position of molecular weight markers are indicated. d, e, ALK auto-phosphorylation assays. d, ALK variants (as indicated in the labels) stably expressed in NIH/3T3 cells were stimulated with 10 nM of purified WT ALKAL2-AD. e, Wild type ALK stably expressed in NIH/3T3 cells was stimulated with 10 nM of purified ALKAL2-AD variants. Cell lysates were subjected to immunoprecipitation using anti-ALK antibodies followed by SDS/PAGE and immunoblotting with anti-pTyr (pY) and anti-ALK (ALK) antibodies. Relative position of the band for 180 kDa Mw marker is shown. f, SEC-MALS profiles of ALK ECRABR−4M:ALKAL22M complex. ALK ECRABR−4M stands for T686A/N787A/Q788A/I795A mutations in ALK ECRABR, and ALKAL22M for full-size ALKAL2C66Y harboring I127A/Y130A mutations. The corresponding isotherm of the signal-weight-average MW as a function of concentration is shown in the right panel. Standard errors were determined according to61. g, Sedimentation velocity analytical ultracentrifugation isotherm of the signal-weight-average s-values for ALK ECRABR−4M-ALKAL2M complex.
Extended Data Fig. 4 |.
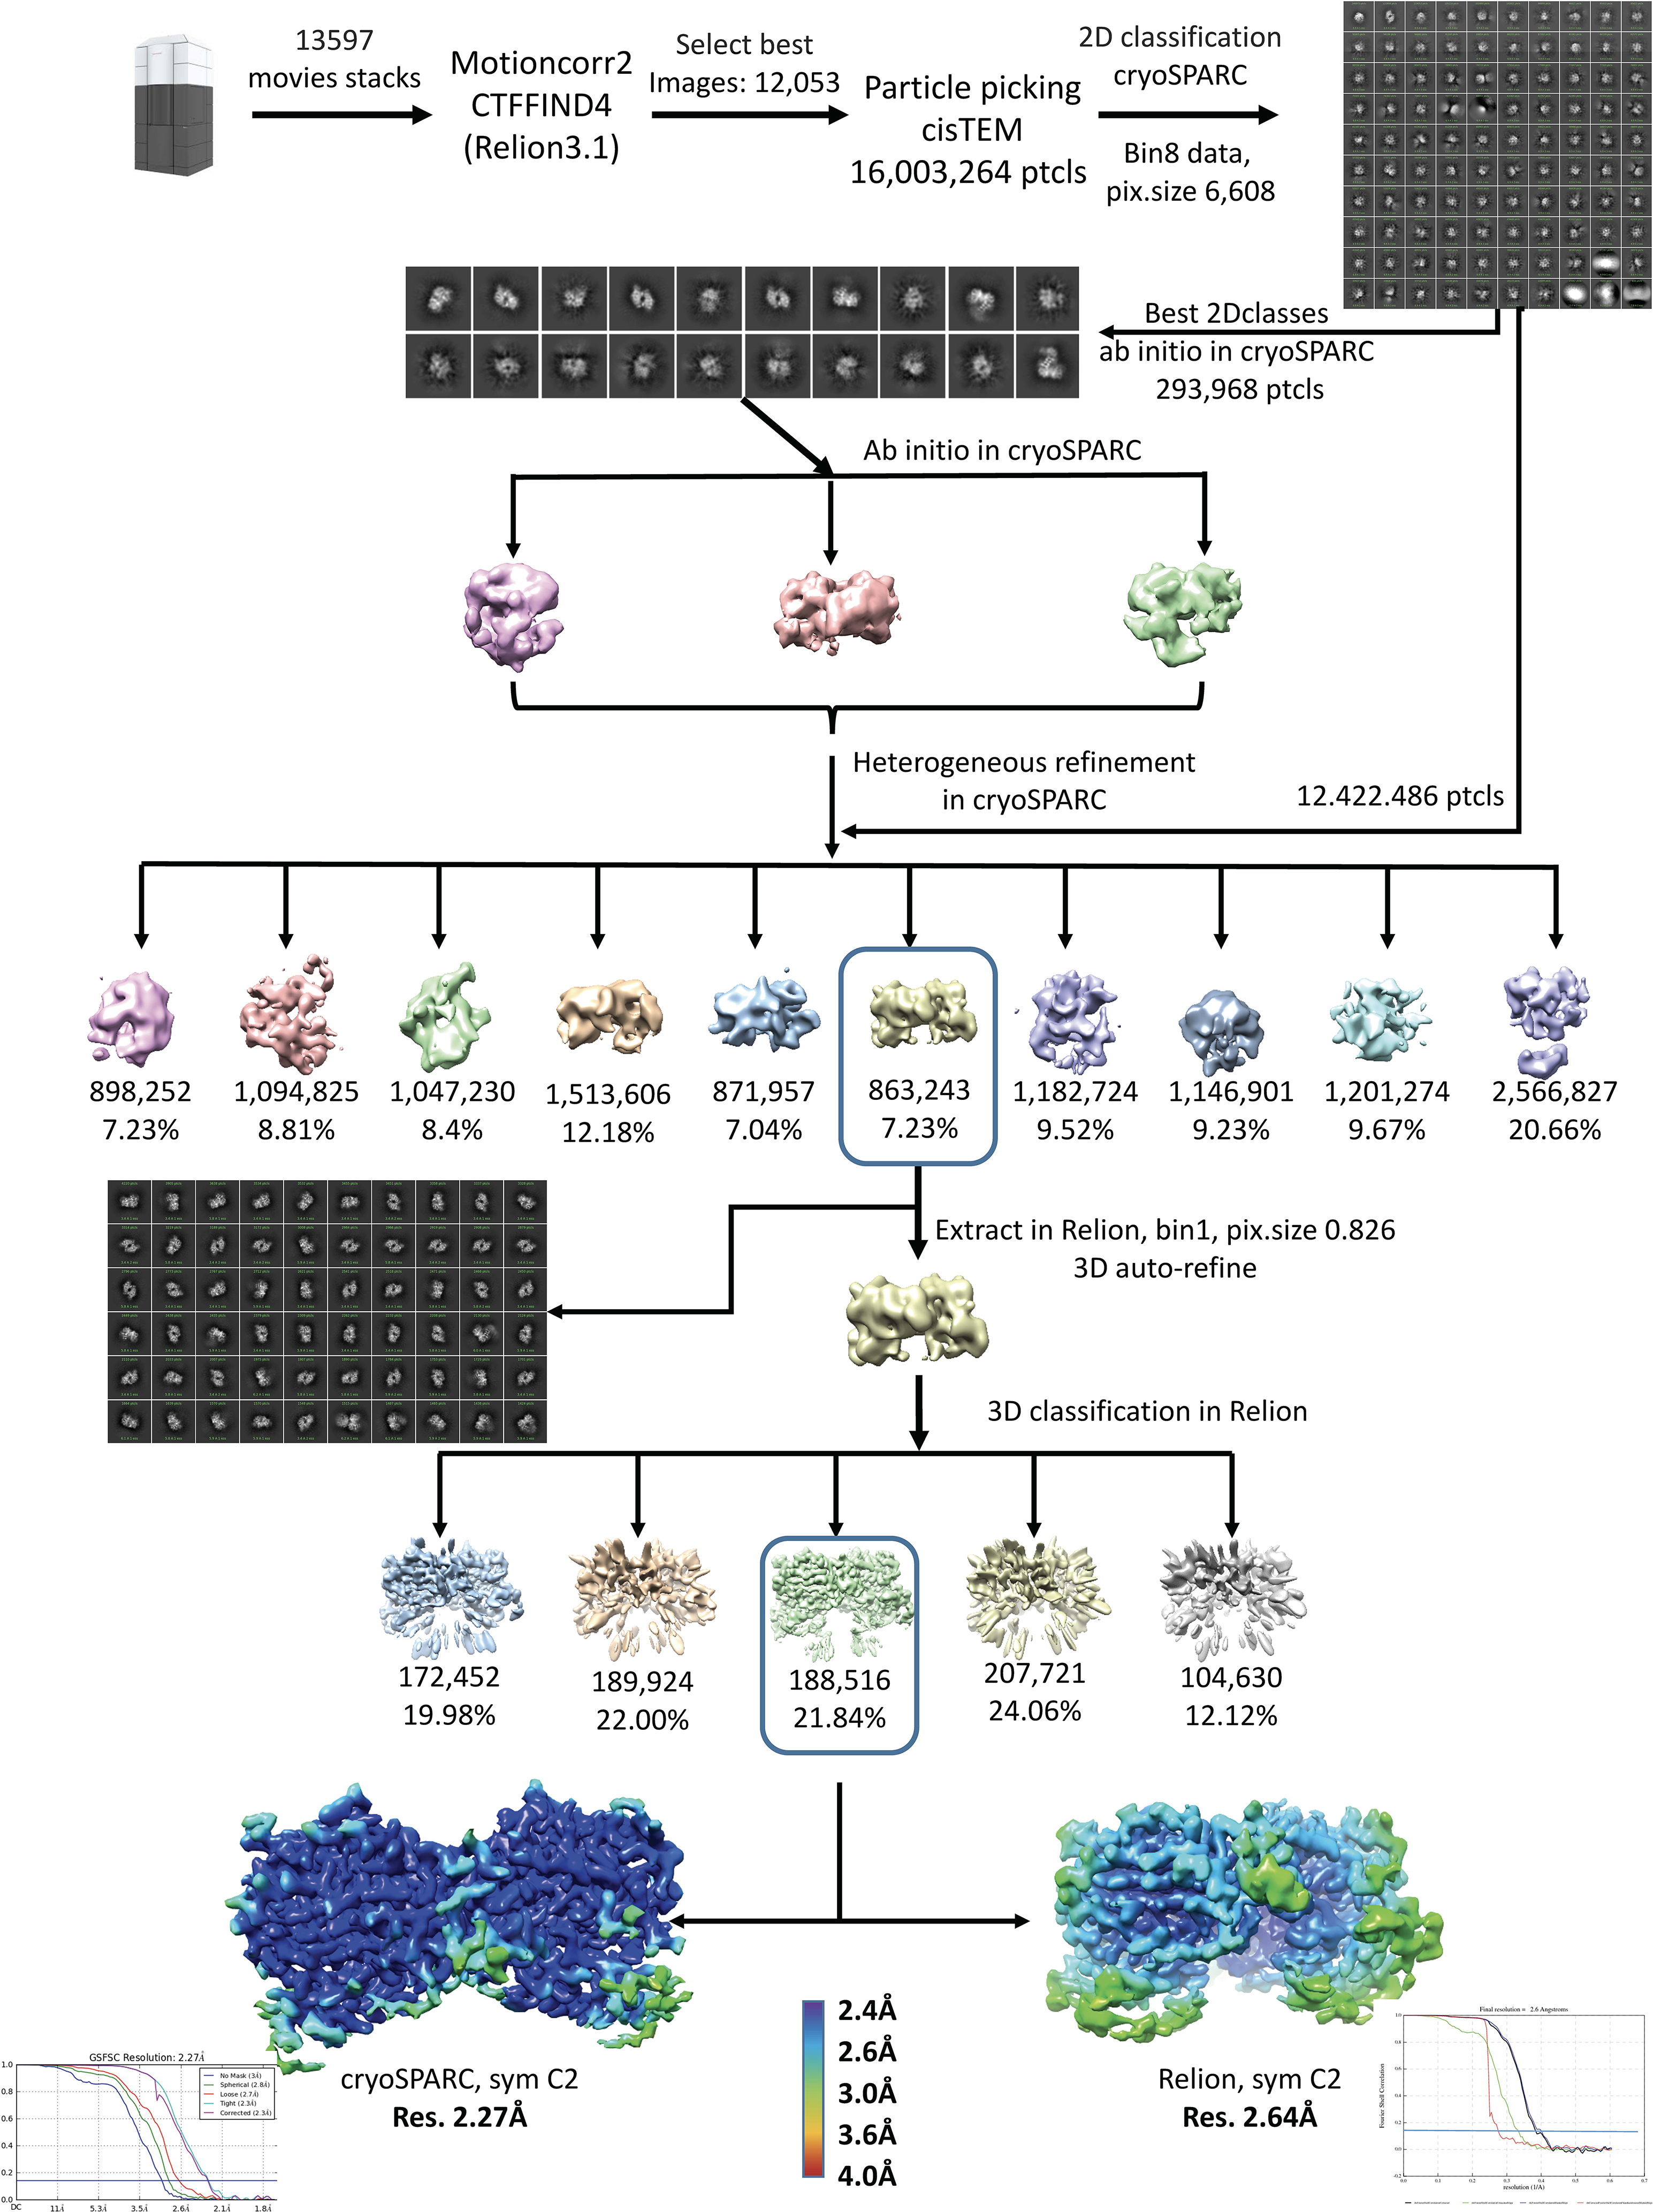
Cryo-EM data processing workflow of ALK ECRABR-ALKAL2C66Y and evaluation of the reconstruction.
Extended Data Fig. 5 |. ALK ECRABR rearrangements upon ALKAL2 binding.
a, d and e, Superposition of ALKAL2 (a), GlyR-TNF-like (d) and EGF-like (e) structures in unliganded (pink) and liganded (blue) states. b, ALKAL2-induced repositioning of ALK ECRABR. c, Cartoon representation of the hetero-tetrameric ALK ECRABR-ALKAL2 complex wherein the 13-residue-long linker tethering EGF-like to TMH has been modeled in an extended conformation. The modeling shows that if EGF-like did not change its position upon ALKAL2 binding (EGF-like unliganded position shown in dark red) TMH dimerization would not be possible because the linker is too short. The model for the linker was manually built in Coot and follows the shortest possible path to reach the TMH. f, Superposition of EGF-like structures in the unliganded (orange) and ALKAL2-bound (grey) states demonstrates the conformational changes in EGF-like between the two states. g, Residues at the interface between EGF-like in unliganded state and TNF-like (left panel) and between EGF-like in ALKAL2-bound state and ALKAL2 (right panel). i, Wild type trx-ALKAL2-AD (gray) and trx-ALKAL2-AD variants (magenta) were tested for their ability to bind wild type ALK ECRABR using BLI. Steady-state dissociation constants and standard errors were determined according to56. j, Comparison of tyrosine auto-phosphorylation of WT ALK stimulated by 10 nM of purified ALKAL2 variants as indicated. ALKAL2-ADRC stands for mutation of four charged residues - K94E/K96E/K99E/H100E; Trx-ALKAL2-AD is N-terminal fusion of ALKAL2 with thioredoxin, and ALKAL2-ADΔɑ1 is deletion of ɑ1 helix (residue boundaries 103–152). NIH3T3 cells stably expressing WT ALK were lysed after ALKAL2 stimulation and were subjected to immunoprecipitation using anti-ALK antibodies followed by SDS/PAGE and immunoblotting with anti-pTyr (pY) and anti-ALK (ALK) antibodies. Relative position of the band for 180 kDa Mw marker is shown. h, Close-up views of residues (CA atoms shown) D732, H996 and T733, M997 is shown. These residues were mutated to Cys for the cross-linking experiments.
Extended Data Fig. 6 |. NMR analysis of ALK ECRABR–ALKAL2-AD and ALK ECRABR–ALKAL1-AD complexes.
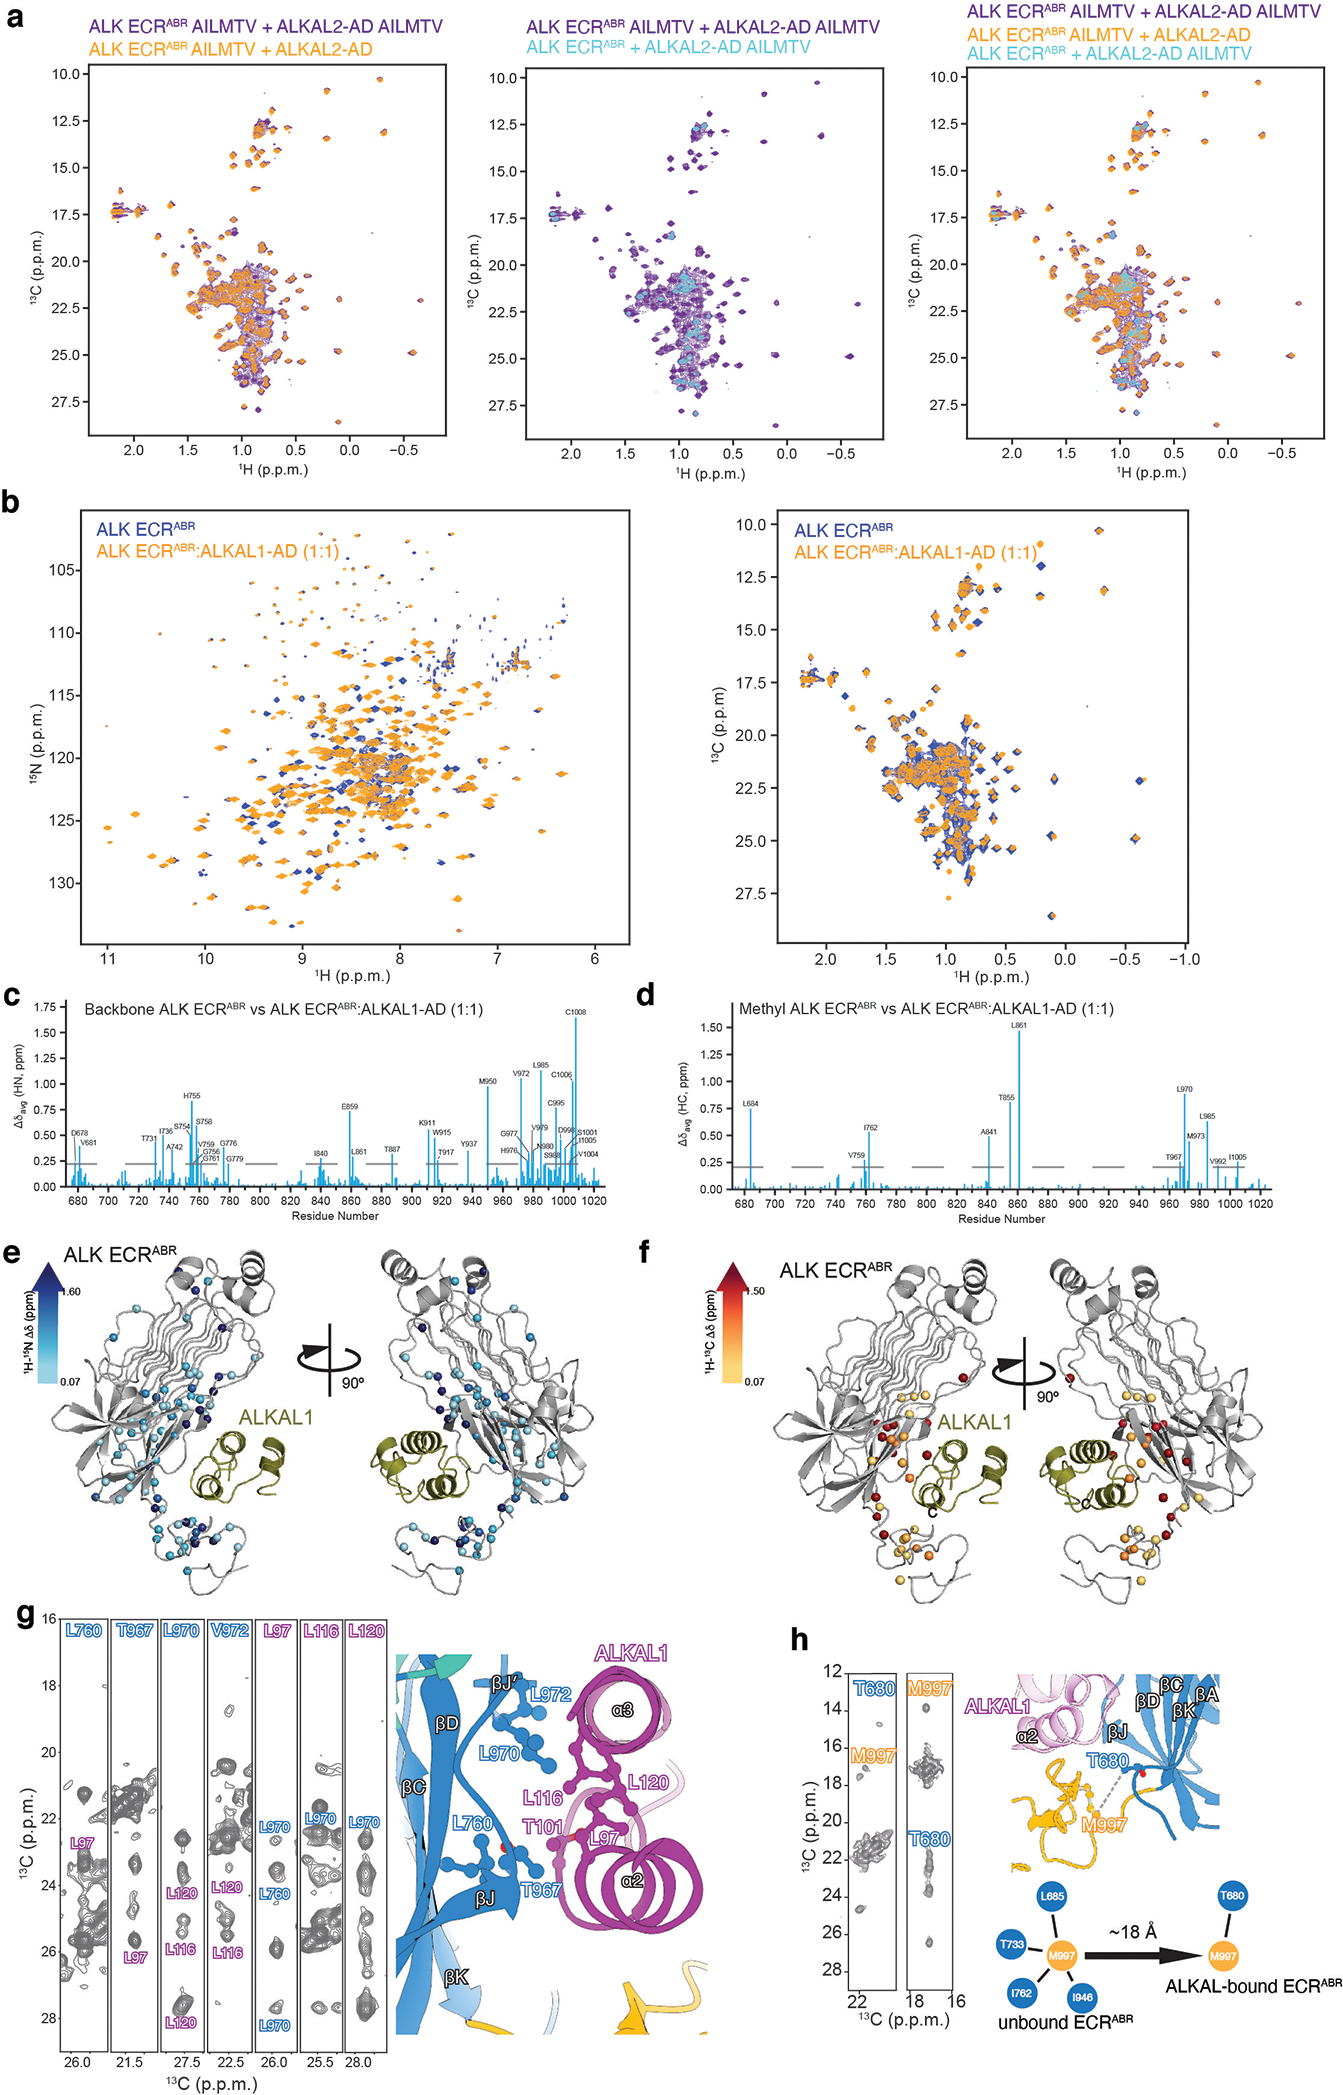
a, b, Superimposed 1H-13C–correlated spectra of ALK ECRABR-ALKAL2-AD (a) and ALK ECRABR-ALKAL1-AD (b) complexes. ALK ECRABR and ALKAL proteins are 1H-13C labeled in the indicated methyl groups. c, d, Chemical shift perturbation induced by ALKAL1-AD binding to ALK ECRABR to combined 1H and 15N amide atoms (c) and 1H and 13C methyl atoms (d). e, f, Chemical shift perturbation induced by ALKAL1-AD mapped onto the ALK ECRABR structure. g, NMR characterization of ALKAL1-AD binding to ALK ECRABR. Select strips from 13C-edited NOESY experiments showing inter-molecular NOEs between ALK ECRABR and ALKAL1-AD. Similar results were obtained when ALKAL2-AD was used, confirming that the structure observed in the frozen sample used in cryo-EM is the same in solution. h, NMR characterization of the EGF-like domain repositioning upon ALKAL1 binding to ECRABR. Select strips from 13C-edited NOESY experiments for ALK ECRABR showing inter-domain NOEs in the unbound form. Characteristic NOE patterns between Met997 of the EGF-like domain and the indicated residues of the TNF-like domain (right panel) changed dramatically upon ligand binding and demonstrate pronounced re-orientation of the EGF-like domain as shown schematically on the right panel.
Extended Data Table 1.
NMR and structure Statisticsa
| protein | ALK ECRABR | ALKAL2 | ALKAL1 |
|---|---|---|---|
| Deposition ID(PDB/BMRB) | 7MZW/30910 | 7MZX/30911 | 7MZZ/30912 |
| Completeness of resonance assignments (%) b | |||
| Backbone | 94.2 | 92.8 | 94.3 |
| Methyl groups | 100 | 100 | 100 |
| Aromatic (Phe, Tyr) | 100 | 97.4 | 92.2 |
| Total | 95.3 | 91.1 | 93.2 |
| Conformationally-restricting restraints c | |||
| NOE | 1960 | 567 | 705 |
| Short (|i - j| ≤ 1) | 543 | 129 | 348 |
| Medium range (2 < |i - j| < 5) | 299 | 283 | 169 |
| Long range (|i - j| ≥ 5) | 1115 | 153 | 186 |
| NOE restraints / residue | 5.6 | 7.7 | 10.5 |
| Hydrogen bond | 46 | 36 | 52 |
| Dihedral angle | 1075 | 95 | 99 |
| Total restraints | 3081 | 698 | 856 |
| Restraints per residue (total / long range) | 8.8/3.3 | 9.4/2.1 | 12.8/2.8 |
| Residual distance restraint violations c | |||
| Average restraint violations/ structure | |||
| 0.1 – 0.2 Å | 12.0 | 13.2 | 19.0 |
| 0.2 – 0.5 Å | 1.7 | 3.7 | 3.4 |
| > 0.5 Å | 0 | 0 | 0 |
| Average RMS violation / restraint (Å) | 0.02 | 0.03 | 0.04 |
| Maximum distance violation (Å) | 0.36 | 0.40 | 0.46 |
| Model Quality c | |||
| RMSD from average coordinates (Å) | |||
| All Backbone atoms (ordered/all) | 0.8/0.9 | 0.5/0.9 | 0.4/1.3 |
| All Heavy atoms (ordered/all) | 1.0/1.1 | 1.1/1.4 | 0.9/1.7 |
| RMSD Bond lengths (Å) | 0.017 | 0.019 | 0.019 |
| RMSD Bond angles (°) | 1.2 | 1.2 | 1.2 |
| Molprobity Ramachandran plot c,d | |||
| Most favored regions (%) | 96.4 | 92.8 | 94.9 |
| Additionally allowed regions (%) | 3.6 | 7.0 | 4.8 |
| Disallowed regions (%) | 0 | 0.2 | 0.3 |
| MolProbity clashscore (raw/Z) | 7.52/024 | 7.59/0.06 | 8.41/0.08 |
Structure statistics were computed for the ensemble of 20 deposited structures of ALK (aa 673–1025), ALKAL2 (aa 77–152), ALKALI (aa 60–129).
Observable resonances for ALK are for selective CH3 and aromatic labeling in otherwise deuterated background are included: Ala(β), Ile(δ1), Leu(δ1,2), Met(ε), Thr(γ2) and Val(γ1,2) (methyls), [1He,13Cε]-Phe and [1He,13Cε]-Tyr. For ALKAL2 and 1 13C,15N-labeled sample were used and complete sidechain is reported
Calculated for protein using PSVS 1.5 program. Average distance constraints were calculated using the sum of r−6.
Ordered residue ranges [S(ϕ) + S(ψ) > 1.8] for ALK: 679–993, 996–1006,1008–1025; ALKAL2: 78–80, 88–147; ALKAL1: 70–126.
Extended Data Table 2.
Cryo-EM data collection and refinement statistics.
| Complex | 2:2 ALK ECRABR – ALKAL2 | |
| Data collection | ||
| Microscope | FEI Titan Krios | |
| Accelerating Voltage, kV | 300 | |
| Detector/energy filter | K3/BioQuantum | |
| Spherical aberration, mm | 2.7 | |
| Magnification | 105,000 | |
| Electron exposure (e−/Å2) | 88.4 | |
| # of Frames | 70 | |
| Exposure (sec.) | 2.8 | |
| Defocus range, μm | from −0.8 to −1.8 | |
| Pixel size (Å) | 0.826 | |
| Micrographs (all micrographs/sorted based on power spectrum) | 13,597/12,053 | |
| Cryo-EM reconstruction | ||
| Particles picked | 16,003,265 | |
| Structure | ALK ECRABR-ΔEGF (CryoSparc) | ALK ECRABR (Relion) |
| Particles refined | 188,516 | 188,516 |
| Resolution achieved, Å | 2.27 | 2.64 |
| FSC threshold | 0.143 | 0.143 |
| Symmetry imposed | C2 | C2 |
| Refinement | ||
| PDB/EMDB IDs | 7N00/EMD-24095 | |
| No. of Non-Hydrogen Atoms | 5817 | |
| Chains | 4 (A/B/C/D) | |
| Protein residues | 806/ | |
| RMS(bonds) | 0.004 | |
| RMS(angles) | 0.557 | |
| Ramachandran favored (%) | 97.12 | |
| Ramachandran allowed (%) | 2.88 | |
| Ramachandran outliers (%) | 0.00 | |
| Rotamer outliers (%) | 3.44 | |
| B-factor (min/max/mean) | 17.54/142.93/48.34 | |
| MolProbity score | 1.85 | |
Extended Data Table 3.
ALK ECRABR – ALKAL2 interface contacts
| TNF-like binding site: | ||
|
| ||
| ALKAL2 residues | ALK residues | Type of interactions |
|
| ||
| His 114 | Pro 968 | vdW |
| Tyr 966 | vdW | |
|
| ||
| Arg 117 | Tyr 966 | π-π |
| Thr 967 | vdW | |
|
| ||
| Leu 118 | Thr 967 | vdW |
| Pro 968 | vdW | |
| Leu 970 | vdW | |
| Leu 760 | vdW | |
| Tyr 966 | vdW | |
|
| ||
| Asn 121 | Leu 760 | vdW |
| Tyr 966 | vdW | |
| Lys 982 | Hydrogen bond (main chain) | |
|
| ||
| Thr 122 | Tyr 739 | vdW |
| Leu 760 | vdW | |
| Tyr 966 | vdW | |
| Thr 967 | vdW | |
| Lys 982 | vdW | |
|
| ||
| Arg 123 | His 682 | vdW |
| Lue 684 | vdW | |
| Tyr 739 | vdW | |
| Glu 978 | Salt bridge | |
| Asn 980 | vdW | |
| Lys 982 | vdW | |
|
| ||
| Asp 124 | Tyr 739 | Hydrogen bond |
| Val 972 | vdW | |
| Glu 978 | vdW | |
|
| ||
| Arg 133 | Tyr739 | vdW |
| Val 972 | vdW | |
| Met 973 | vdW | |
| Glue 974 | vdW | |
| Glu978 | Salt bridge | |
|
| ||
| Arg 136 | His 755 | vdW |
| Met 752 | vdW | |
| Leu 970 | vdW | |
| Lys 971 | vdW | |
| Val 972 | Hydrogen bond | |
| Glu974 | Salt bridge | |
|
| ||
| Leu 137 | Tyr739 | vdW |
| Ser 758 | vdW | |
| Leu 970 | vdW | |
| Val972 | vdW | |
|
| ||
| Arg 140 | Phe 856 | vdW |
| His 857 | vdW | |
| Pro 858 | vdW | |
| Glu 859 | Salt bridge | |
| Leu 970 | vdW | |
| Lys 971 | vdW | |
|
| ||
| Leu 141 | Pro968 | vdW |
| Leu 970 | vdW | |
|
| ||
| Ser 144 | Pro968 | vdW |
| Leu 970 | vdW | |
|
| ||
| EGF-like binding site: | ||
|
| ||
| ALKAL2 residues | ALK residues | Type of interactions |
|
| ||
| Phe 107 | His 1010 | vdW |
|
| ||
| Ser 112 | Phe 1007 | vdW |
| Asp 1009 | vdW | |
|
| ||
| Lys 113 | Phe 1007 | vdW |
| Glue 994 | vdW | |
|
| ||
| His 116 | Phe 1007 | π-π |
| Glue 994 | Hydrogen bond | |
| His 996 | π-π | |
|
| ||
| Arg 117 | Tyr 984 | vdW |
| Glu 994 | Salt bridge | |
|
| ||
| His 120 | His 996 | π-π |
| Pro 999 | vdW | |
|
| ||
| Asn 121 | Leu 985 | vdW |
| Glue 994 | vdW | |
|
| ||
| ALK ECRABR : ALK ECRABR’ dimerization interface (these interactions are symetrical): | ||
|
| ||
| ALK protomer 1 residues | ALK protomer 2 residues | Type of interactions |
|
| ||
| Asn 707 | Leu 789 | vdW |
|
| ||
| Thr 786 | Gly 689 | vdW |
| Ser 688 | vdW | |
| Asn703 | vdW | |
| Ala 704 | vdW | |
|
| ||
| Asn 787 (ND2) | Asn 703 (O) | Hydrogen bond (main chain) |
| Asn 787 | Ala 704 | vdW |
| Asn 787 (ND2) | Gin 706 (O) | Hydrogen bond (main chain) |
|
| ||
| Gln 788 | Leu 684 | vdW |
| Gln 788 (NE2) | Thr 686 (OG1) | Hydrogen bond |
| Ala 704 | vdW | |
| Tyr 705 | vdW | |
| Ser 708 | vdW | |
|
| ||
| ALK ECRABR-ALKAL2’ dimerization interface (these interactions are symetrical): | ||
|
| ||
| ALK residues | ALKAL2’ residues | Type of interactions |
|
| ||
| Gln 791 | Tyr 130 | vdW |
|
| ||
| Ile 795 | Arg123 | vdW |
| Ile127 | vdW | |
| Ala 129 | vdW | |
| Tyr 130 | vdW | |
|
| ||
| Glu 797 | Ile 127 | vdW |
| Pro 128 | vdW | |
Extended Data Table 4.
X-ray data collection and refinement statistics for ALK ECRABR-x0394;EGF (aa 673–986)
| Data collection | Native | MAD Se-Met peak | MAD Se-Met HR |
|---|---|---|---|
| Space group | P21212 | P21212 | P21212 |
| Wavelength (⊠) | 1.0 | 0.97911 | 0.97166 |
| a, b, c (⊠) | 70.29, 133.36, 62.91 | 70.46, 133.34, 62.73 | 70.46, 133.35, 62.81 |
| α, β, Ɣ (°) | 90, 90, 90 | 90, 90, 90 | 90, 90, 90 |
| Resolution (⊠) | 50.0–1.50 (1.53–1.50) | 50.0– 2.2 (2.24–2.20) | 50.0– 2.2 (2.24–2.20) |
| Total reflections | 3329013 | 3403605 | 4027827 |
| unique reflections | 95109 | 30786 | 30477 |
| Completeness (%) | 92.3 (61.6) | 95.9 (83.0) | 96.2 (92.8) |
| Redundancy | 11.6 (7.6) | 10.4 (8.2) | 6.8 (5.1) |
| I/σI | 22.4 (2) | 19.7 (2.6) | 17.3 (2.3) |
| Rsym (%) | 11.0 (70.2) | 9.9 (48.5) | 9.6 (39.5) |
| Wilson B-factor (⊠ 2) | 11.50 | 31.42 | 29.79 |
| Phasing | |||
| Number of Se sites | 7 | ||
| Figure-of-merit | 0.27 | ||
| Refinement | |||
| PDB ID | 7NZY | ||
| Reflections used in refinement | 77003 (4080) | ||
| Reflections used for R-free | 5203 (282) | ||
| R-work | 0.1685 (0.2664) | ||
| R-free | 0.1956 (0.3056) | ||
| N of non-hydrogen atoms | 4883 | ||
| macromolecules | 4416 | ||
| ligands | 8 | ||
| solvent | 459 | ||
| Protein residues | 610 | ||
| RMS(bonds) | 0.011 | ||
| RMS(angles) | 1.11 | ||
| Ramachandran favored (%) | 98.50 | ||
| Ramachandran allowed (%) | 1.50 | ||
| Ramachandran outliers (%) | 0.00 | ||
| Rotamer outliers (%) | 0.90 | ||
| Clashscore | 3.25 | ||
| Average B-factor | 21.83 | ||
| macromolecules | 20.79 | ||
| ligands | 36.05 | ||
| solvent | 31.57 | ||
| Number of TLS groups | 14 | ||
Supplementary Material
Acknowledgments
This work was supported by ALSAC and NIH grant R35 GM122462. Cryo-EM and NMR data were acquired at the St. Jude Cryo-EM Center and Biomolecular NMR Spectroscopy Center respectively. X-ray data were collected at SERCAT ID and BM beam lines. We thank Mitra Rana and Ravi Kalathur (St. Jude Protein Technology Center) for their valuable help with protein expression and purification, Mary Clay for assisting with NMR graphics, and Inês Chen for critical reading of the manuscript, Ewa Folta-Stogniew for discussions of SEC-MALS data, and Zhaowen Luo for assisting with the preparation of figures and the animation.
Footnotes
Competing interests C.G.K. is a consultant for BridgeBio.
REFERENCES
- 1.Morris SW et al. Fusion of a kinase gene, ALK, to a nucleolar protein gene, NPM, in non-Hodgkin’s lymphoma. Science 263, 1281–1284, doi: 10.1126/science.8122112 (1994). [DOI] [PubMed] [Google Scholar]
- 2.Orthofer M et al. Identification of ALK in Thinness. Cell 181, 1246–1262 e1222, doi: 10.1016/j.cell.2020.04.034 (2020). [DOI] [PubMed] [Google Scholar]
- 3.Hallberg B & Palmer RH Mechanistic insight into ALK receptor tyrosine kinase in human cancer biology. Nat Rev Cancer 13, 685–700, doi: 10.1038/nrc3580 (2013). [DOI] [PubMed] [Google Scholar]
- 4.Chen Y et al. Oncogenic mutations of ALK kinase in neuroblastoma. Nature 455, 971–974, doi: 10.1038/nature07399 (2008). [DOI] [PubMed] [Google Scholar]
- 5.George RE et al. Activating mutations in ALK provide a therapeutic target in neuroblastoma. Nature 455, 975–978, doi: 10.1038/nature07397 (2008). [DOI] [PMC free article] [PubMed] [Google Scholar]
- 6.Janoueix-Lerosey I et al. Somatic and germline activating mutations of the ALK kinase receptor in neuroblastoma. Nature 455, 967–970, doi: 10.1038/nature07398 (2008). [DOI] [PubMed] [Google Scholar]
- 7.Mosse YP et al. Identification of ALK as a major familial neuroblastoma predisposition gene. Nature 455, 930–935, doi: 10.1038/nature07261 (2008). [DOI] [PMC free article] [PubMed] [Google Scholar]
- 8.Morris SW et al. ALK, the chromosome 2 gene locus altered by the t(2;5) in non-Hodgkin’s lymphoma, encodes a novel neural receptor tyrosine kinase that is highly related to leukocyte tyrosine kinase (LTK). Oncogene 14, 2175–2188, doi: 10.1038/sj.onc.1201062 (1997). [DOI] [PubMed] [Google Scholar]
- 9.Lemmon MA & Schlessinger J Cell signaling by receptor tyrosine kinases. Cell 141, 1117–1134, doi: 10.1016/j.cell.2010.06.011 (2010). [DOI] [PMC free article] [PubMed] [Google Scholar]
- 10.Zhang H et al. Deorphanization of the human leukocyte tyrosine kinase (LTK) receptor by a signaling screen of the extracellular proteome. Proc Natl Acad Sci U S A 111, 15741–15745, doi: 10.1073/pnas.1412009111 (2014). [DOI] [PMC free article] [PubMed] [Google Scholar]
- 11.Guan J et al. FAM150A and FAM150B are activating ligands for anaplastic lymphoma kinase. Elife 4, e09811, doi: 10.7554/eLife.09811 (2015). [DOI] [PMC free article] [PubMed] [Google Scholar]
- 12.Reshetnyak AV et al. Augmentor alpha and beta (FAM150) are ligands of the receptor tyrosine kinases ALK and LTK: Hierarchy and specificity of ligand-receptor interactions. Proc Natl Acad Sci U S A 112, 15862–15867, doi: 10.1073/pnas.1520099112 (2015). [DOI] [PMC free article] [PubMed] [Google Scholar]
- 13.Mo ES, Cheng Q, Reshetnyak AV, Schlessinger J & Nicoli S Alk and Ltk ligands are essential for iridophore development in zebrafish mediated by the receptor tyrosine kinase Ltk. Proc Natl Acad Sci U S A 114, 12027–12032, doi: 10.1073/pnas.1710254114 (2017). [DOI] [PMC free article] [PubMed] [Google Scholar]
- 14.Fadeev A et al. ALKALs are in vivo ligands for ALK family receptor tyrosine kinases in the neural crest and derived cells. Proc Natl Acad Sci U S A 115, E630–E638, doi: 10.1073/pnas.1719137115 (2018). [DOI] [PMC free article] [PubMed] [Google Scholar]
- 15.Reshetnyak AV et al. Identification of a biologically active fragment of ALK and LTK-Ligand 2 (augmentor-alpha). Proc Natl Acad Sci U S A 115, 8340–8345, doi: 10.1073/pnas.1807881115 (2018). [DOI] [PMC free article] [PubMed] [Google Scholar]
- 16.Crick FH & Rich A Structure of polyglycine II. Nature 176, 780–781, doi: 10.1038/176780a0 (1955). [DOI] [PubMed] [Google Scholar]
- 17.Warkentin E et al. A rare polyglycine type II-like helix motif in naturally occurring proteins. Proteins 85, 2017–2023, doi: 10.1002/prot.25355 (2017). [DOI] [PubMed] [Google Scholar]
- 18.Loren CE et al. A crucial role for the Anaplastic lymphoma kinase receptor tyrosine kinase in gut development in Drosophila melanogaster. EMBO Rep 4, 781–786, doi: 10.1038/sj.embor.embor897 (2003). [DOI] [PMC free article] [PubMed] [Google Scholar]
- 19.Jumper J et al. Highly accurate protein structure prediction with AlphaFold. Nature, doi: 10.1038/s41586-021-03819-2 (2021). [DOI] [PMC free article] [PubMed] [Google Scholar]
- 20.Endres NF et al. Conformational coupling across the plasma membrane in activation of the EGF receptor. Cell 152, 543–556, doi: 10.1016/j.cell.2012.12.032 (2013). [DOI] [PMC free article] [PubMed] [Google Scholar]
- 21.Myers KV, Amend SR & Pienta KJ Targeting Tyro3, Axl and MerTK (TAM receptors): implications for macrophages in the tumor microenvironment. Mol Cancer 18, 94, doi: 10.1186/s12943-019-1022-2 (2019). [DOI] [PMC free article] [PubMed] [Google Scholar]
- 22.Grasberger B, Minton AP, DeLisi C & Metzger H Interaction between proteins localized in membranes. Proc Natl Acad Sci U S A 83, 6258–6262, doi: 10.1073/pnas.83.17.6258 (1986). [DOI] [PMC free article] [PubMed] [Google Scholar]
- 23.Klein P, Mattoon D, Lemmon MA & Schlessinger J A structure-based model for ligand binding and dimerization of EGF receptors. Proc Natl Acad Sci U S A 101, 929–934, doi: 10.1073/pnas.0307285101 (2004). [DOI] [PMC free article] [PubMed] [Google Scholar]
- 24.Kuriyan J & Eisenberg D The origin of protein interactions and allostery in colocalization. Nature 450, 983–990, doi: 10.1038/nature06524 (2007). [DOI] [PubMed] [Google Scholar]
- 25.Diwanji D, Thaker T & Jura N More than the sum of the parts: Toward full-length receptor tyrosine kinase structures. IUBMB Life 71, 706–720, doi: 10.1002/iub.2060 (2019). [DOI] [PMC free article] [PubMed] [Google Scholar]
- 26.Murray PB et al. Heparin is an activating ligand of the orphan receptor tyrosine kinase ALK. Sci Signal 8, ra6, doi: 10.1126/scisignal.2005916 (2015). [DOI] [PubMed] [Google Scholar]
- 27.Li T, Stayrook SE, Tsutsui Y, Zhang J, Wang Y, Li H, Proffitt A, Krimmer S, Ahmed M, Belliveau O, Walker IX, Mudumbi KC, Suzuki Y, Lax I, Alvarado D, Lemmon MA, Schlessinger J, and Klein DE, Structural Basis for Ligand Reception by Anaplastic Lymphoma Kinase. Nature (2021). [DOI] [PMC free article] [PubMed] [Google Scholar]
- 28.Van Duyne GD, Standaert RF, Karplus PA, Schreiber SL & Clardy J Atomic structures of the human immunophilin FKBP-12 complexes with FK506 and rapamycin. J Mol Biol 229, 105–124, doi: 10.1006/jmbi.1993.1012 (1993). [DOI] [PubMed] [Google Scholar]
- 29.Monneau YR et al. Exploiting E. coli auxotrophs for leucine, valine, and threonine specific methyl labeling of large proteins for NMR applications. J Biomol NMR 65, 99–108, doi: 10.1007/s10858-016-0041-1 (2016). [DOI] [PMC free article] [PubMed] [Google Scholar]
- 30.Rossi P, Monneau YR, Xia Y, Ishida Y & Kalodimos CG Toolkit for NMR Studies of Methyl-Labeled Proteins. Methods Enzymol 614, 107–142, doi: 10.1016/bs.mie.2018.08.036 (2019). [DOI] [PubMed] [Google Scholar]
- 31.Xie T, Saleh T, Rossi P & Kalodimos CG Conformational states dynamically populated by a kinase determine its function. Science 370, eabc2754, doi: 10.1126/science.abc2754 (2020). [DOI] [PMC free article] [PubMed] [Google Scholar]
- 32.Otwinowski Z & Minor W [20] Processing of X-ray diffraction data collected in oscillation mode. Methods Enzymol 276, 307–326, doi: 10.1016/S0076-6879(97)76066-X (1997). [DOI] [PubMed] [Google Scholar]
- 33.Hendrickson WA & Ogata CM [28] Phase determination from multiwavelength anomalous diffraction measurements. Methods Enzymol 276, 494–523, doi: 10.1016/S0076-6879(97)76074-9 (1997). [DOI] [PubMed] [Google Scholar]
- 34.Terwilliger TC et al. Decision-making in structure solution using Bayesian estimates of map quality: the PHENIX AutoSol wizard. Acta Crystallogr D Biol Crystallogr 65, 582–601, doi: 10.1107/S0907444909012098 (2009). [DOI] [PMC free article] [PubMed] [Google Scholar]
- 35.Liebschner D et al. Macromolecular structure determination using X-rays, neutrons and electrons: recent developments in Phenix. Acta Crystallogr D Struct Biol 75, 861–877, doi: 10.1107/S2059798319011471 (2019). [DOI] [PMC free article] [PubMed] [Google Scholar]
- 36.Emsley P, Lohkamp B, Scott WG & Cowtan K Features and development of Coot. Acta Crystallogr D Biol Crystallogr 66, 486–501, doi: 10.1107/S0907444910007493 (2010). [DOI] [PMC free article] [PubMed] [Google Scholar]
- 37.Delaglio F et al. NMRPipe: a multidimensional spectral processing system based on UNIX pipes. J Biomol NMR 6, 277–293 (1995). [DOI] [PubMed] [Google Scholar]
- 38.Lee W, Tonelli M & Markley JL NMRFAM-SPARKY: enhanced software for biomolecular NMR spectroscopy. Bioinformatics 31, 1325–1327, doi: 10.1093/bioinformatics/btu830 (2015). [DOI] [PMC free article] [PubMed] [Google Scholar]
- 39.Lange OF et al. Determination of solution structures of proteins up to 40 kDa using CS-Rosetta with sparse NMR data from deuterated samples. Proc Natl Acad Sci U S A 109, 10873–10878, doi: 10.1073/pnas.1203013109 (2012). [DOI] [PMC free article] [PubMed] [Google Scholar]
- 40.Shen Y & Bax A Protein backbone and sidechain torsion angles predicted from NMR chemical shifts using artificial neural networks. J Biomol NMR 56, 227–241, doi: 10.1007/s10858-013-9741-y (2013). [DOI] [PMC free article] [PubMed] [Google Scholar]
- 41.Rossi P, Xia Y, Khanra N, Veglia G & Kalodimos CG 15N and 13C- SOFAST-HMQC editing enhances 3D-NOESY sensitivity in highly deuterated, selectively [1H,13C]-labeled proteins. J Biomol NMR 66, 259–271, doi: 10.1007/s10858-016-0074-5 (2016). [DOI] [PMC free article] [PubMed] [Google Scholar]
- 42.Monneau YR et al. Automatic methyl assignment in large proteins by the MAGIC algorithm. J Biomol NMR 69, 215–227, doi: 10.1007/s10858-017-0149-y (2017). [DOI] [PMC free article] [PubMed] [Google Scholar]
- 43.Guntert P Automated NMR structure calculation with CYANA. Methods Mol Biol 278, 353–378, doi: 10.1385/1-59259-809-9:353 (2004). [DOI] [PubMed] [Google Scholar]
- 44.Linge JP, Williams MA, Spronk CA, Bonvin AM & Nilges M Refinement of protein structures in explicit solvent. Proteins 50, 496–506, doi: 10.1002/prot.10299 (2003). [DOI] [PubMed] [Google Scholar]
- 45.Brunger AT Version 1.2 of the Crystallography and NMR system. Nat Protoc 2, 2728–2733, doi: 10.1038/nprot.2007.406 (2007). [DOI] [PubMed] [Google Scholar]
- 46.Bhattacharya A, Tejero R & Montelione GT Evaluating protein structures determined by structural genomics consortia. Proteins 66, 778–795, doi: 10.1002/prot.21165 (2007). [DOI] [PubMed] [Google Scholar]
- 47.Tejero R, Snyder D, Mao B, Aramini JM & Montelione GT PDBStat: a universal restraint converter and restraint analysis software package for protein NMR. J Biomol NMR 56, 337–351, doi: 10.1007/s10858-013-9753-7 (2013). [DOI] [PMC free article] [PubMed] [Google Scholar]
- 48.Mastronarde DN Automated electron microscope tomography using robust prediction of specimen movements. J Struct Biol 152, 36–51, doi: 10.1016/j.jsb.2005.07.007 (2005). [DOI] [PubMed] [Google Scholar]
- 49.Zheng SQ et al. MotionCor2: anisotropic correction of beam-induced motion for improved cryo-electron microscopy. Nat Methods 14, 331–332, doi: 10.1038/nmeth.4193 (2017). [DOI] [PMC free article] [PubMed] [Google Scholar]
- 50.Zivanov J et al. New tools for automated high-resolution cryo-EM structure determination in RELION-3. Elife 7, doi: 10.7554/eLife.42166 (2018). [DOI] [PMC free article] [PubMed] [Google Scholar]
- 51.Grant T, Rohou A & Grigorieff N cisTEM, user-friendly software for single-particle image processing. Elife 7, doi: 10.7554/eLife.35383 (2018). [DOI] [PMC free article] [PubMed] [Google Scholar]
- 52.Punjani A, Rubinstein JL, Fleet DJ & Brubaker MA cryoSPARC: algorithms for rapid unsupervised cryo-EM structure determination. Nat Methods 14, 290–296, doi: 10.1038/nmeth.4169 (2017). [DOI] [PubMed] [Google Scholar]
- 53.Pettersen EF et al. UCSF Chimera--a visualization system for exploratory research and analysis. J Comput Chem 25, 1605–1612, doi: 10.1002/jcc.20084 (2004). [DOI] [PubMed] [Google Scholar]
- 54.Afonine PV et al. Real-space refinement in PHENIX for cryo-EM and crystallography. Acta Crystallogr D Struct Biol 74, 531–544, doi: 10.1107/S2059798318006551 (2018). [DOI] [PMC free article] [PubMed] [Google Scholar]
- 55.Williams CJ et al. MolProbity: More and better reference data for improved all-atom structure validation. Protein Sci 27, 293–315, doi: 10.1002/pro.3330 (2018). [DOI] [PMC free article] [PubMed] [Google Scholar]
- 56.Kortt AA, Nice E & Gruen LC Analysis of the binding of the Fab fragment of monoclonal antibody NC10 to influenza virus N9 neuraminidase from tern and whale using the BIAcore biosensor: effect of immobilization level and flow rate on kinetic analysis. Anal Biochem 273, 133–141, doi: 10.1006/abio.1999.4183 (1999). [DOI] [PubMed] [Google Scholar]
- 57.Zhao H, Brautigam CA, Ghirlando R & Schuck P Overview of current methods in sedimentation velocity and sedimentation equilibrium analytical ultracentrifugation. Curr Protoc Protein Sci Chapter 20, Unit20 12, doi: 10.1002/0471140864.ps2012s71 (2013). [DOI] [PMC free article] [PubMed] [Google Scholar]
- 58.Schuck P Size-distribution analysis of macromolecules by sedimentation velocity ultracentrifugation and lamm equation modeling. Biophys J 78, 1606–1619, doi: 10.1016/S0006-3495(00)76713-0 (2000). [DOI] [PMC free article] [PubMed] [Google Scholar]
- 59.Zhao H et al. A multilaboratory comparison of calibration accuracy and the performance of external references in analytical ultracentrifugation. PLoS One 10, e0126420, doi: 10.1371/journal.pone.0126420 (2015). [DOI] [PMC free article] [PubMed] [Google Scholar]
- 60.Brautigam CA Calculations and Publication-Quality Illustrations for Analytical Ultracentrifugation Data. Methods Enzymol 562, 109–133, doi: 10.1016/bs.mie.2015.05.001 (2015). [DOI] [PubMed] [Google Scholar]
- 61.Folta-Stogniew E & Williams KR Determination of molecular masses of proteins in solution: Implementation of an HPLC size exclusion chromatography and laser light scattering service in a core laboratory. J Biomol Tech 10, 51–63 (1999). [PMC free article] [PubMed] [Google Scholar]
Associated Data
This section collects any data citations, data availability statements, or supplementary materials included in this article.
Supplementary Materials
Data Availability Statement
Atomic coordinates have been deposited under the Protein Data Bank (PDB) accession codes 7N00 (cryoEM structure of ALK ECRABR-ALKAL2), 7NZY (X-ray structure of ALK ECRABR-ΔEGF), 7MZW (X-ray/NMR hybrid structure of ALK ECRABR), 7MZX (NMR structure of ALKAL2), 7MZZ (NMR structure of ALKAL1). The cryo-EM density map of ALK-ECR-AUGα has been deposited in the Electron Microscopy Data Bank (EMDB) under accession code 24095. NMR resonance assignments have been deposited in the Biological Magnetic Resonance Bank under accession codes 30910 (ALK ECRABR), 30911 (ALKAL2), 30912 (ALKAL1).