Abstract
Phytochemical investigation of Diaporthe foeniculina BZM-15 led to one new γ-butyrolactone derivative, diaportone A (1), one cyclopentenone derivative, diaportone B (3), and one monoterpene derivative, diaportone C (5), along with six known compounds (2, 4, and 6–9). Their structures as well as the absolute configurations were characterized by means of NMR, HRESIMS, and ECD spectroscopy and quantum chemistry calculation, respectively. Furthermore, all compounds were evaluated for their cytotoxic activity and antibacterial activity, and compounds 7 and 8 displayed significant antiproliferative effects on three human cancer cell lines (SF-268, MCF-7, and HepG2) with IC50 values ranging from 3.6 to 15.8 μM.
Keywords: endophytic fungus, Diaporthe foeniculina, Leptospermum brachyandrum, diaportone, structure elucidation, cytotoxicity
Introduction
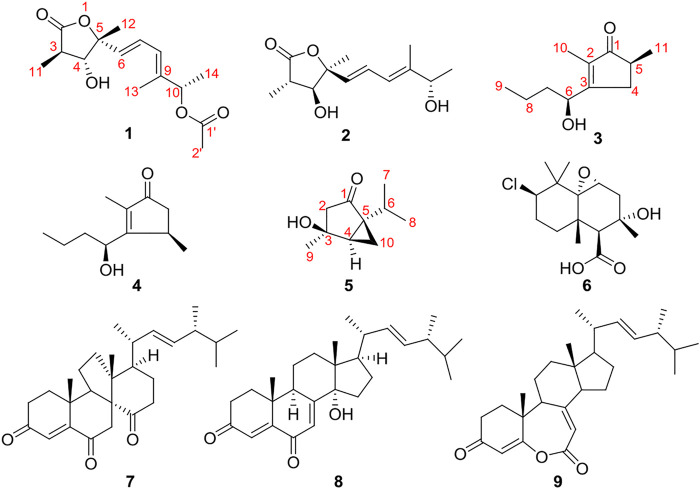
Fungi are prolific producers of bioactive secondary metabolites and have contributed to improvements in human and animal health in spectacular and indispensable ways (Bills and Gloer, 2016; El-Elimat et al., 2021). They are ubiquitous in nature and often provide nutrients or protection for the host (Wani et al., 2015). Many endophytic fungi produce compounds with a novel structure and specific bioactivity for their long period of living in host tissues, which have been potential resources for novel compounds and new drugs (Jia et al., 2016; Kaul et al., 2012). Leptospermum brachyandrum is a famous ornamental and medicinal plant that belongs to the Myrtaceae family. In our previous research, three endophytes were isolated from this plant, such as Diaporthe foeniculina, Eutypella scoparia, and Rhytidhysteron sp., and a number of novel natural products with antibacterial or cytotoxic activity have been discovered from these endophytes (Zhang et al., 2021a; Zhang et al., 2021b; Zhang et al., 2020; Zhang et al., 2021). Simultaneously, five new 2-pyrones were isolated from D. foeniculina (Yu et al., 2021). With the aim of seeking new bioactive natural products from medicinal plant endophytes, chemical investigation of strain D. foeniculina BZM-15 was further researched and afforded to find three new metabolites, including one γ-butyrolactone derivative, diaportone A (1), one cyclopentenone derivative, diaportone B (3), and one monoterpene, diaportone C (5), along with six known compounds, colletolides A (2) (Li et al., 2019), phomotenone (4) (Ahmed et al., 2011), altiloxin B (6) (Hemberger et al., 2013), dankasterone A (7) (Jiao et al., 2015), 14α-hydroxyergosta-4,7,22-triene-3,6-dione (8) (Liu et al., 2018), and fortisterol (9) (Kitchawalitet al., 2014) (Figure 1). Herein, this report describes the isolation, structural elucidation, and biological activity of compounds 1–9.
FIGURE 1.
Chemical structures of compounds 1–9.
Materials and Methods
General Experimental Procedures
Optical rotations were measured using an Anton Paar MCP-500 spectropolarimeter (Anton Paar, Graz, Austria). The NMR spectra were recorded on a Bruker Avance-500 spectrometer (Bruker Corporation, Fällanden, Switzerland) with TMS as an internal reference. Experimental ECD spectra in MeOH were acquired in a quartz cuvette of 1 mm optical path length on an Applied Photophysics Chirascan spectrometer. HRESIMS spectra were obtained in a Thermo MAT95XP high-resolution mass spectrometer (Thermo Fisher Scientific, Bremen, Germany). Preparative HPLC was performed on an Agilent 1260 Infinity system equipped with a DAD detector using a preparative YMC ODS C18 column (20 × 250 mm, 5 μm). Column chromatography was performed using silica gel (200–300 mesh, Qingdao Marine Chemical Inc., Qingdao, China) and Sephadex LH-20 gel (Pharmacia Fine Chemical Co. Ltd., Sweden). Thin-layer chromatography (TLC) was carried out on silica gel plates (Merck KGaA, Darmstadt, Germany) using various solvent systems. All solvents were purchased from Guangzhou Chemical Reagent Company, Ltd. (Guangzhou, China).
Cultivation and Culture Extraction
The fungus D. foeniculina BZM-15 was isolated from the plant Leptospermum brachyandrum, which was collected from South China Botanical Garden (SCBG), Chinese Academy of Sciences, China, in September 2016. The strain was identified as D. foeniculina according to the sequence analysis of rDNA ITS (internal transcribed spacer) region, which has been submitted to GenBank with the accession number of MN788609. The strain was deposited in the Laboratory of Natural Product Medicinal Chemistry, SCBG.
The fungus D. foeniculina BZM-15 was incubated in 200 ml of potato dextrose broth at 30°C on a rotary shaker (120 rpm) for 7 days to acquire the seed broth. Large-scale fermentation was carried out in Erlenmeyer flasks (16 × 3 L); each contained rice (200 g) and distilled water (300 ml), which were autoclaved at 121 °C for 25 min. After cooling at room temperature, seed broth was added to those Erlenmeyer flasks, which were fermented for 30 days at 28°C. After cultivation, the obtained mycelial solid medium was extracted with EtOAc (three times, 24 h for every time) at room temperature, and the extract solution was concentrated in vacuo to receive a crude extract (50 g).
Isolation of Compounds 1–9
The crude extract was fractionated by silica gel column chromatography ((CC) (PE-EtOAc v/v, 100:1-0:100)) to afford six main fractions (Fr.1–Fr.6). Fr.5 (7.22 g) was divided into ODS CC and eluted with MeOH-H2O (v/v, 40–100%) to give six subfractions (Fr.5-1 to Fr.5-6). Fr.5-2 (1.94 g) was separated by Sephadex LH-20 CC, eluting with CHCl3-MeOH (v/v, 1:1) to provide five subfractions (Fr.5-2-1 to Fr.5-2-5). Fr.5-2-2 (1.23 g) was chromatographed using CC on silica gel, eluted with CHCl3-MeOH (v/v, 100:0-0:100), and then further purified by semipreparative HPLC with CH3CN-H2O (40: 60) to give compound 5 (4.0 mg). Compound 6 (5.3 mg) was obtained from Fr.5-2-3 on a semipreparative HPLC with CH3CN-H2O (35:65). Fr.5-3 (405.0 mg) was separated by Sephadex LH-20 CC, eluting with CHCl3-MeOH (v/v, 1:1) to provide five subfractions (Fr.5-3-1 to Fr.5-3-5). Fr.5-3-1 (211.4 mg) was isolated by column chromatography on silica gel and eluted with CHCl3-MeOH (v/v, 10:1-0:1) to get three fractions (Fr.5-3-1-1 to Fr.5-3-1-3). Fr.5-3-1-2 (11.4 mg) was then subjected to semipreparative HPLC with CH3CN-H2O (v/v, 50:50) to afford compounds 1 (8.0 mg) and 2 (6.1 mg). Fr.5-3-2 (80.3 mg) was separated by semipreparative HPLC with CH3CN-H2O (v/v, 50:50) to afford compounds 3 (3.9 mg) and 4 (4.3 mg).
Fr.3 (3.2 g) was subjected to CC on silica gel eluted with a gradient system of PE-EtOAc (v/v, 20:0–0:100) to afford five fractions (Fr.3-1 to Fr.3-5). Fr.3-2 (890 mg) was separated on a Sephadex LH-20 column with MeOH and then separated by preparative HPLC using CH3CN-H2O (80:20) to provide compounds 7 (5.8 mg) and 9 (4.4 mg). Fr.3-3 (635 mg) was purified by silica gel CC and eluted with a gradient system of CH2Cl2-MeOH (v/v, 100:0–0:100) to provide compound 8 (10.3 mg).
Diaportone A (1): colorless oil; – 3.7 (c 1.0, MeOH); UV (MeOH): λ max (log ε): 238 (3.27) nm; IR ν max: 3,325 and 1,635, 667 cm−1; HRESIMS: m/z 305.1361 [M + Na] + (calcd for C15H22NaO5, 305.1359). 1H (500 MHz); and 13C (125 MHz) NMR data, see Table 1.
TABLE 1.
1H (500 MHz) and 13C (125 MHz) NMR spectral data of compound 1 in CD3OD.
| No | δ H (J in Hz) | δ C, type | No | δ H (J in Hz) | δ C, type |
|---|---|---|---|---|---|
| 2 | — | 178.5, C | 10 | 5.25, q (7.0) | 76.4, CH |
| 3 | 2.48, s | 42.6, CH | 11 | 1.22, d (7.0) | 12.4, CH3 |
| 4 | 3.80, d (10.5) | 82.5, CH | 12 | 1.51, s | 25.2, CH3 |
| 5 | — | 86.6, C | 13 | 1.76, s | 12.7, CH3 |
| 6 | 5.92, d (15.5) | 133.3, CH | 14 | 1.34, d (6.5) | 19.4, CH3 |
| 7 | 6.48, dd (15.5, 10.5) | 126.4, CH | 1′ | — | 172.2, C |
| 8 | 6.10, d (10.5) | 126.1, CH | 2′ | 2.03, s | 21.1, CH3 |
| 9 | — | 139.2, C | — | — | — |
Diaportone B (3): yellow oil; + 14.5 (c 0.8, MeOH); UV (MeOH): λ max (log ε): 236 (3.07) nm; IR ν max: 3,415, 2,960, 2,931, 2,872, 1,681, 1,639, 1,456, 1,381, 1,336, 1,172, and 1,026 cm−1; HRESIMS: m/z 205.1206 [M + Na] + (calcd for C11H18NaO2, 205.1199). 1H (500 MHz); and 13C (125 MHz) NMR data, see Table 2.
TABLE 2.
1H (500 MHz) and 13C (125 MHz) NMR spectral data of compounds 3 and 5 in acetone-d 6.
| No | 3 | 5 | ||
|---|---|---|---|---|
| δ H (J in Hz) | δ C, type | δ H (J in Hz) | δ C, type | |
| 1 | — | 212.2, C | — | 210.6, C |
| 2 | — | 134.4, C | 1.88, d (17.0) | 49.1, CH2 |
| 2.36, m | ||||
| 3 | — | 173.7, C | — | 71.7, C |
| 4 | 2.08, m | 34.8, CH2 | 1.97, dd (7.5, 4.0) | 38.4, CH |
| 2.98, m | ||||
| 5 | 2.25, m | 39.9, CH | — | 46.1, C |
| 6 | 4.75, dd (8.0, 5.5) | 69.5, CH | 1.88, m | 27.2, CH |
| 7 | 1.53, m | 38.7 CH2 | 0.95, d (7.0) | 20.0, CH3 |
| 1.69, m | ||||
| 8 | 1.35, m | 19.6, CH2 | 0.91, d (7.0) | 19.6, CH3 |
| 1.45, m | ||||
| 9 | 0.93, t (7.0) | 14.6, CH3 | 1.37, s | 29.9, CH3 |
| 10 | 1.65, s | 8.7, CH3 | 1.10, ddd (7.5, 5.0, 1.5) | 16.6, CH2 |
| 1.36, dd (5.0, 4.5) | ||||
| 11 | 1.08, d (7.5) | 17.2, CH3 | — | — |
Diaportone C (5): white solid; + 10.3 (c 0.5, MeOH); UV (MeOH): λ max (log ε): 200 (2.59) nm, 273 (1.39) nm; IR ν max: 3,431, 1962, 2,873, 1708, 1,458, 1,375, 1,259, 1,182, 1,130, 1032,999,945, 758, and 682 cm−1; HRESIMS: m/z 191.1051 [M + Na] + (calcd for C10H16NaO2, 191.1043). 1H (500 MHz); and 13C (125 MHz) NMR data, see Table 2.
ECD Calculation Methods
The ECD spectra of compounds 1, 3, and 5 were calculated by using the Gaussian09 package (Frisch et al., 2016). Each of their configuration was optimized at the B3LYP-D3(BJ)/TZVP (IEFPCM) level of theory. The theoretic ECD spectra were calculated on the mPW1PW91/6-311G* (IEFPCM) level of theory and Boltzmann average was calculated for the spectra according to Gibbs free energy. SpecDis v1.71 was used to simulate an ECD curve with a sigma/gamma value of 0.3 eV2 (Bruhn et al., 2013). The calculated ECD curves of compounds 1 and 3 were red shifted and blue shifted by 5 nm, respectively.
Antibacterial Assay
Antibacterial activity of all compounds against MRSA (JCSC 3063) and E. coli (ATCC 8739) was tested by the broth macrodilution method on 96-well plates according to the CLSI recommendation (Li et al., 2014). Vancomycin (MIC = 1.25 µg/ml) was used as a positive control.
Cytotoxicity Assay
The cytotoxicity of all compounds against three human tumor cell lines, SF-268 (CNS cancer), MCF-7 (breast cancer), and HepG2 (hepatoma cancer), and normal cell line LX-2 was tested using the MTT assay. Adriamycin was used as a positive control. All cells were seeded into 96-well plates at 5 × 10⁴ cells/ml and incubated at 37°C under a 5% CO2 atmosphere for 24 h. Then, the tested compounds were added. After 72 h, MTT solution was added into each well, which was further incubated. The cell-free supernatant was removed and formazan crystals were subsequently dissolved in DMSO. Optical density (OD) was recorded at 490 nm on a microplate reader to calculate the IC50 values.
Results and Discussion
Compound 1 was isolated as colorless oil and assigned the molecular formula C15H22O5 as inferred from its HRESIMS ion peak at m/z 305.1361 [M + Na] + (calcd 305.1359 for C15H22NaO5). The 1H NMR spectral data (Table 1), in combination with the HSQC spectrum, displayed two ester carbonyl groups [δ C 178.5 (C-2) and 172.2 (C-1′)], one conjugated diene [δ H 5.92 (H-6), 6.48 (H-7), and 6.10 (H-8); δ C 133.3 (C-6), 126.4 (C-7), 126.1 (C-8), and 139.2 (C-9)], two oxygenated methines [δ H 5.25 (H-10) and 3.80 (H-4); δ C 76.4 (C-10) and 82.5 (C-4)], one methine [δ H 2.48 (H-3); δ C 42.6 (C-3)], one oxygen quaternary carbon [δ C 86.6 (C-5)], and five methyl groups [δ H 1.22 (H-11), 1.51 (H-12), 1.76 (H-13), 1.31 (H-14), and δ H 2.03 (H-2′); δ C 12.4 (C-11), 25.2 (C-12), 12.7 (C-13), 19.4 (C-14), and 21.1 (C-2′)].
Compared to the NMR spectra of compound 2 (Table 1), they shared a typical γ-butyrolactone ring bearing two methyl groups at C-3 and C-5 and a hydroxyl group at C-4. However, the spectra of compound 1 exhibited additional signals for the acetyl group, which was connected with 10-OH to form an ester. This conclusion can be proved by the correlations of H-10 with C-1′ in the HMBC spectrum. Thus, the planar structure of compound 1 was elucidated, as shown in Figure 1.
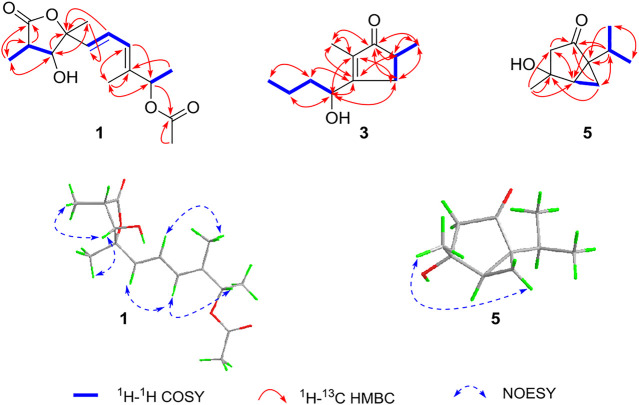
The relative configuration was determined by NOESY spectrum and coupling constants. The NOE correlations of H-11/H-4/H-12 indicated that 11-H3, 4-H, and 12-H3 were on the same side of the lactone ring. A conjugated diene moiety was determined by the large coupling constant J = 15.5 Hz between H-6 and H-7 that was trans-oriented and J = 10.5 Hz between H-7 and H-8 that was cis-oriented. In addition, the E confirmation of 8,9-diene was deduced from the NOE cross peaks of H-6/H-8/H-10 and H3-13/H-7 (Figure 2). The chiral HPLC analysis of compound 1 revealed that it should be optically pure. The calculated ECD spectrum was consistent with its experimental ECD spectrum, suggesting the absolute configuration of compound 1 as 3R,4R,5R,10S (Figure 3). Thus, the structure of compound 1 was determined as a new γ-butyrolactone derivative with 6,8-hexadien-1-ol,1-acetate side chain and was named diaportone A. Notably, diaportone A possess conjugated double bond, which might be light sensitive. Moreover, it might be an artificial compound generated from the known compound 2 through acylation, although much more evidence was needed.
FIGURE 2.
1H-1H COSY, Key HMBC, and NOESY correlations of compounds 1, 3, and 5.
FIGURE 3.
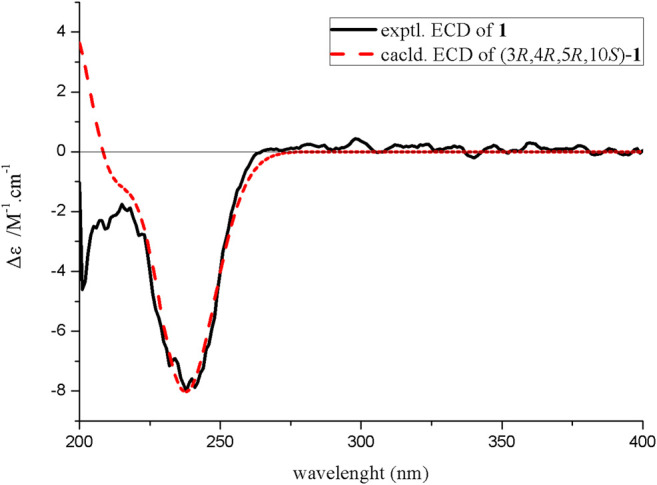
Experimental and calculated ECD spectra of compound 1.
Compound 3 was isolated as yellow oil. It was determined to have a molecular formula of C11H18O2 by a combination of its HRESIMS ion peak at m/z 183.1388 [M + H] + (calcd 182.1307 for C11H19O2). The 1H and 13C NMR spectroscopic data (Table 2) of compound 3 exhibited characteristic signals assignable to a conjugated ketone carbonyl, a tetrasubstituted olefin, two methines (one oxygenated), three methylene groups, and three methyl groups. A detailed analysis of the NMR data exhibited that compound 3 was similar to the known compound 4 (Ahmed et al., 2011) (Table 2) with the only difference in compound 3 being the substitution position of CH3-11, which was deduced based on the HMBC cross peaks of H3-11 (δ H 1.08)/C-1 (δ C 212.2), C-5 (δ C 39.9), and C-4 (δ C 34.8) (Figure 2). The absolute configuration of compound 3 was confirmed by the similarity between the calculated ECD curve of 5S,6S and its experimental ECD spectrum (Figure 4). Therefore, the structure of compound 3, diaportone B, was defined as shown.
FIGURE 4.
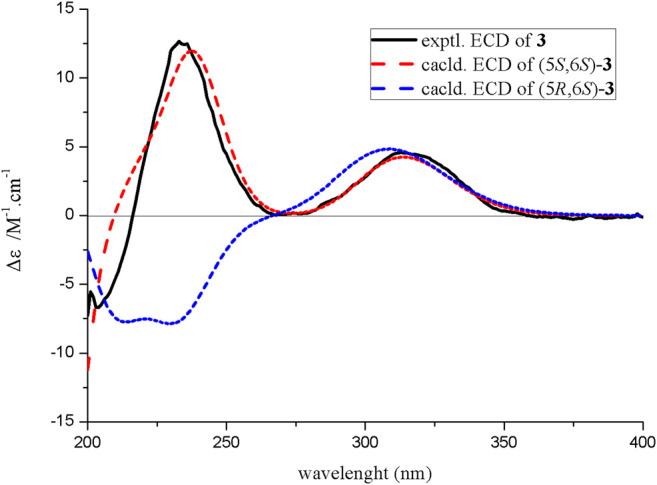
Experimental and calculated ECD spectra of compound 3.
Compound 5 was isolated as a white solid. The molecular formula C10H16O2 was determined by the HRESIMS ion peak at m/z 169.1224 [M + H] + (calcd 169.1229 for C10H17O2). The 1D NMR data (Table 2) of compound 5 exhibited three methyl groups, two methylene groups, two methines, two sp3 nonprotonated carbons (one oxygenated), and one ketone carbonyl. Comparison of NMR data with those of dihydroxysabinane (Lin et al., 2009) revealed a high degree of similarity skeleton, where the only obvious difference is in the presence of a carbonyl group at C-1 in compound 5 instead of a hydroxyl group in dihydroxysabinane. This deduction was confirmed by the HMBC correlations of C-1 with H-2 (δ H 1.88 and 2.36), H-6 (δ H 1.88), and H-10 (δ H 1.36 and 1.10) and obvious low-field chemical shift of C-1 (δ C 210.9) (Figure 2).
The relative configuration of compound 5 was determined by the analysis of ROESY spectral data (Figure 2). The methylene (CH2-10) and the hydroxyl groups at the chiral carbons (C-3) were assigned as β-oriented and the methyl groups (CH3-9) and the methine (CH-6) should be α-oriented due to the presence of the ROESY correlation of H-4 with H3-9. The above data supported the presence of two possible enantiomers (3S,4R,5R)-5 and (3R,4S,5S)-5. To determine the absolute configuration of compound 5, the ECD calculation was performed. Its experimental ECD spectrum of compound 5 was in good agreement with the calculated ECD spectrum for 3S,4R,5R (Figure 5). Therefore, the structure of compound 5 was determined and given the trivial name diaportone C.
FIGURE 5.
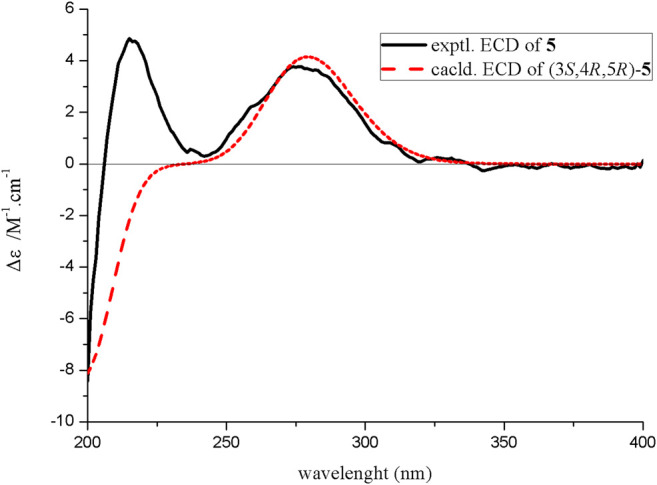
Experimental and calculated ECD spectra of compound 5.
Finally, the cytotoxic activities of all compounds inhibited three human cancer cell lines (SF-268, MCF-7, and HepG2), and antibacterial activities against MRSA and E. coli were evaluated. As show in Table 3, compounds 7 and 8 showed different potency of cytotoxicity against the three cell lines, with IC50 values ranging from 3.6 to 15.8 μM, whereas they were not active on the normal cell line LX-2. Unfortunately, none of the compounds showed any antibacterial activities against MRSA and E. coli at a concentration of 100 µg/ml.
TABLE 3.
Cytotoxicity of compounds 1–9 against three human cancer cell lines.
| Compounds | IC50 a (μM) | SI Values b | |||
|---|---|---|---|---|---|
| SF268 | MCF-7 | HepG2 | LX-2 | ||
| 1–6, 9 | >40 | >40 | >40 | >40 | NA |
| 7 | 6.7 ± 0.7 | 3.6 ± 1.1 | 4.9 ± 0.9 | >40 | >6 |
| 8 | 8.3 ± 0.5 | 11.4 ± 0.3 | 15.8 ± 1.3 | >40 | >5 |
| Adriamycin c | 1.9 ± 0.03 | 1.5 ± 0.01 | 2.2 ± 0.03 | >40 | >21 |
Results are the mean ± SD (n = 3).
Safety index (SI) value = IC50 for LX-2 cell line/IC50 for SF286 cell line.
Positive control.
NA, not active.
Conclusion
A phytochemical investigation into D. foeniculina BZM-15 resulted in the isolation and structural elucidation of three undescribed and six known compounds. Their structures including absolute configurations were determined by extensive physicochemical and spectroscopic analysis, as well as by ECD calculation. Cytotoxicity assays found that compounds 7 and 8 showed good cell inhibition against three human cancer cell lines (SF-268, MCF-7, and HepG2). This result enriched the study on the chemical constituents of D. foeniculina and validated that endophytic fungi remained a rich source of structurally/biologically new compounds.
Data Availability Statement
The original contributions presented in the study are included in the article/Supplementary Material; further inquiries can be directed to the corresponding authors.
Author Contributions
HT and ZZ conceived and designed the experiments. FK, XL, and WP were responsible for the isolation of compounds. FK and SZ elucidated the structures. DC, JT, and MK tested the pharmacological activity of the compounds. FK, SZ, and KX interpreted the data, and wrote the article. All authors read and approved the final manuscript.
Funding
This research were funded by the National Natural Science Foundation of China (No. 8217131312, 81773602), Natural Science Foundation of Guangdong Province (2019A1515011694), Natural Science Foundation of Hunan Province (No. 2021JJ30917), Guangdong Special Support Program (2017TQ04R599), Youth Innovation Promotion Association of CAS (2020342), High-tech Industry Science and Technology Innovation Project of Hunan Province (2020GK4083), Foundation of Key Laboratory of Plant Resources Conservation and Sustainable Utilization, South China Botanical Garden, Chinese Academy of Sciences, and the Open Sharing Fund for the Large-scale Instruments and Equipments of Central South University.
Conflict of Interest
The authors declare that the research was conducted in the absence of any commercial or financial relationships that could be construed as a potential conflict of interest.
Publisher’s Note
All claims expressed in this article are solely those of the authors and do not necessarily represent those of their affiliated organizations, or those of the publisher, the editors, and the reviewers. Any product that may be evaluated in this article, or claim that may be made by its manufacturer, is not guaranteed or endorsed by the publisher.
Supplementary Material
The Supplementary Material for this article can be found online at: https://www.frontiersin.org/articles/10.3389/fchem.2021.755351/full#supplementary-material
References
- Ahmed I., Hussain H., Schulz B., Draeger S., Padula D., Pescitelli G., et al. (2011). Three New Antimicrobial Metabolites from the Endophytic Fungus Phomopsis Sp. Eur. J. Org. Chem. 2011, 2867–2873. 10.1002/ejoc.201100158 [DOI] [Google Scholar]
- Bills G. F., Gloer J. B. (2016). Biologically Active Secondary Metabolites from the Fungi. Microbiol. Spectr. 4, 1–32. 10.1128/microbiolspec.FUNK-0009-2016 [DOI] [PubMed] [Google Scholar]
- Bruhn T., Schaumloffel A., Hemberger Y., Bringmann G. (2013). SpecDis: Quantifying the Comparison of Calculated and Experimental Electronic Circular Dichroism Spectra. Chirality 25, 243–249. 10.1002/chir.22138 [DOI] [PubMed] [Google Scholar]
- El-Elimat T., Raja H. A., Figueroa M., Sharie A. H. A., Bunch R. L., Oberlies N. H. (2021). Freshwater Fungi as a Source of Chemical Diversity: A Review. J. Nat. Prod. 84, 898–916. 10.1021/ACS.JNATPROD.0C01340 [DOI] [PMC free article] [PubMed] [Google Scholar]
- Frisch M. J., Trucks G. W., Schlegel H. B., Scuseria G. E., Robb M. A., Cheeseman J. R., et al. (2016). Gaussian 16, Revision B.01 . Wallingford CT: Gaussian, Inc. [Google Scholar]
- Hemberger Y., Xu J., Wray V., Proksch P., Wu J., Bringmann G. (2013). Pestalotiopens A and B: Stereochemically Challenging Flexible Sesquiterpene-Cyclopaldic Acid Hybrids from Pestalotiopsis Sp. Chem.-Eur. J. 19, 15556–15564. 10.1002/chin.20141719810.1002/chem.201302204 [DOI] [PubMed] [Google Scholar]
- Jia M., Chen L., Xin H. L., Zheng C. J., Rahman K., Han T., et al. (2016). A Friendly Relationship between Endophytic Fungi and Medicinal Plants: A Systematic Review. Front. Microbiol. 7, 906. 10.3389/fmicb.2016.00906 [DOI] [PMC free article] [PubMed] [Google Scholar]
- Jiao Y., Li G., Wang H. Y., Liu J., Li X. B., Zhang L. L., et al. (2015). New Metabolites from Endolichenic Fungus Pleosporales Sp. Chem. Biodivers. 12, 1095–1104. 10.1002/cbdv.201400279 [DOI] [PubMed] [Google Scholar]
- Kaul S., Gupta S., Ahmed M., Dhar M. K. (2012). Endophytic Fungi from Medicinal Plants: a Treasure hunt for Bioactive Metabolites. Phytochem. Rev. 11, 487–505. 10.1007/s11101-012-9260-6 [DOI] [Google Scholar]
- Kitchawalit S., Kanokmedhakul K., Kanokmedhakul S., Soytong K. (2014). A New Benzyl Ester and Ergosterol Derivatives from the Fungus Gymnoascus Reessii. Nat. Prod. Res. 28, 1045–1051. 10.1080/14786419.2014.903478 [DOI] [PubMed] [Google Scholar]
- Li C. R., Zhai Q. Q., Wang X. K., Hu X. X., Li G. Q., Zhang W. X., et al. (2014). In Vivo antibacterial Activity of MRX-I, a New Oxazolidinone. Antimicrob. Agents Chemother. 58, 2418–2421. 10.1128/AAC.01526-13 [DOI] [PMC free article] [PubMed] [Google Scholar]
- Li Y., Wei W., Wang R. L., Liu F., Wang Y. K., Li R., et al. (2019). Colletolides A and B, Two New γ-butyrolactone Derivatives from the Endophytic Fungus Colletotrichum Gloeosporioides . Phytochem. Lett. 33, 90–93. 10.1016/j.phytol.2019.08.004 [DOI] [Google Scholar]
- Lin T., Lin X., Lu C. H., Hu Z. Y., Huang W. Y., Huang Y. J., et al. (2009). Secondary Metabolites of Phomopsis Sp. XZ-26, an Endophytic Fungus from Camptothecaacuminate . Eur. J. Org. Chem. 2009, 2975–2982. 10.1002/ejoc.200801021 [DOI] [Google Scholar]
- Liu M. T., Sun W. G., Wang J. P., He Y., Zhang J. W., Li F. L., et al. (2018). Bioactive Secondary Metabolites from the marine-associated Fungus Aspergillus terreus . Bioorg. Chem. 80, 525–530. 10.1016/j.bioorg.2018.06.029 [DOI] [PubMed] [Google Scholar]
- Wani Z. A., Ashraf N., Mohiuddin T., Riyaz-Ul-Hassan S. (2015). Plant-endophyte Symbiosis, an Ecological Perspective. Appl. Microbiol. Biot. 99, 2955–2965. 10.1016/j.bioorg.2018.06.02910.1007/s00253-015-6487-3 [DOI] [PubMed] [Google Scholar]
- Yu Z. H., Lu X. X., Choi J., Deng S. L., Xiong B. H., Zhang W. G., et al. (2021). 2-Pyrones from Endophytic Fungus Diaporthe Foeniculina BZM-15. Nat. Prod. Res. Published Online. 10.1080/14786419.2021.1904400 [DOI] [PubMed] [Google Scholar]
- Zhang S., Kang F. H., Tan J. B., Chen D. K., Kuang M., Wang W. X., et al. (2021a). (±)-Rhytidhymarins A and B, Two Pairs of New Isocoumarin Derivatives from Endophytic Fungus Rhytidhysteron Sp. BZM-9. New J. Chem. 45, 12700˗12704. 10.1039/d1nj01993g [DOI] [Google Scholar]
- Zhang S., Wang W. X., Tan J. B., Kang F. H., Chen D. K., Xu K. P., et al. (2021b). Rhytidhyesters A-D, Four New Chlorinated Cyclopentene Derivatives from the Endophytic Fungus Rhytidhysteron Sp. BZM-9. Planta Med. 87, 489–497. 10.1055/a-1429-3396 [DOI] [PubMed] [Google Scholar]
- Zhang W. G., Lu X. X., Huo L. Q., Zhang S., Chen Y., Zou Z., et al. (2021). Sesquiterpenes and Steroids from an Endophytic Eutypella Scoparia . J. Nat. Prod. 84, 1715–1724. 10.1021/acs.jnatprod.0c01167 [DOI] [PubMed] [Google Scholar]
- Zhang W. G., Wang M. M., Zhang S., Xu K. P., ShanTan G., Qiu S. X., et al. (2020). Eutyscoparols A-G, Polyketide Derivatives from Endophytic Fungus Eutypella Scoparia SCBG-8. Fitoterapia 146, 104681. 10.1016/j.fitote.2020.104681 [DOI] [PubMed] [Google Scholar]
Associated Data
This section collects any data citations, data availability statements, or supplementary materials included in this article.
Supplementary Materials
Data Availability Statement
The original contributions presented in the study are included in the article/Supplementary Material; further inquiries can be directed to the corresponding authors.


