

Abstract
AAV-mediated gene therapy holds promise for the treatment of lysosomal storage diseases (LSDs), some of which are already in clinical trials. Yet, ultra-rare subtypes of LSDs, such as some glycoproteinoses, have lagged. Here, we report on a long-term safety and efficacy preclinical study conducted in the murine model of galactosialidosis, a glycoproteinosis caused by a deficiency of protective protein/cathepsin A (PPCA). One-month-old Ctsa−/− mice were injected intravenously with a high dose of a self-complementary AAV2/8 vector expressing human CTSA in the liver. Treated mice, examined up to 12 months post injection, appeared grossly indistinguishable from their wild-type littermates. Sustained expression of scAAV2/8-CTSA in the liver resulted in the release of the therapeutic precursor protein in circulation and its widespread uptake by cells in visceral organs and the brain. Increased cathepsin A activity resolved lysosomal vacuolation throughout the affected organs and sialyl-oligosacchariduria. No signs of hyperplasia or inflammation were detected in the liver up to a year of age. Clinical chemistry panels, blood cell counts, and T cell immune responses were normal in all treated animals. These results warrant a close consideration of this gene therapy approach for the treatment of galactosialidosis, an orphan disease with no cure in sight.
Keywords: lysosomal storage disease, galactosialidosis, protective protein cathepsin A, lysosomal multienzyme complex, AAV-mediated gene therapy
Graphical abstract
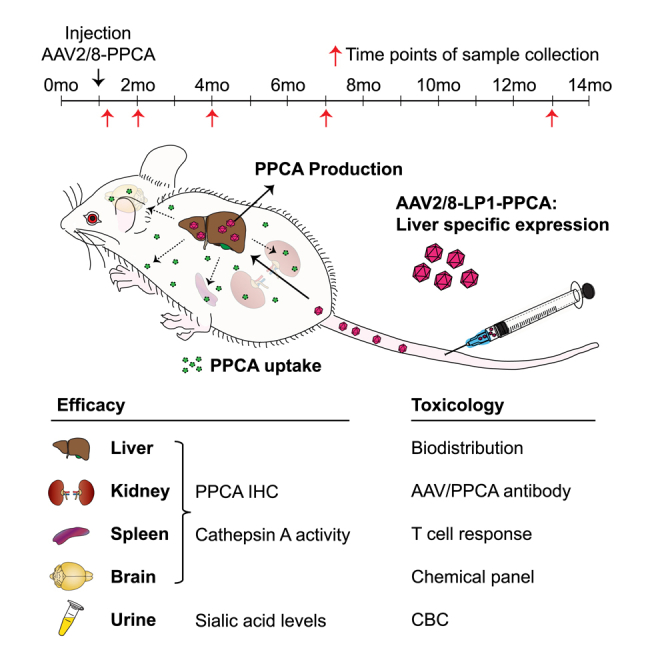
d’Azzo and colleagues describe a long-term safety and efficacy preclinical study conducted in the mouse model of galactosialidosis, using an AAV-mediated gene therapy approach. Galactosialidosis is an orphan lysosomal storage disease caused by a primary defect of the protective protein/cathepsin A and secondary deficiency of neuraminidase 1 and β-galactosidase.
Introduction
Galactosialidosis (GS) is a glycoprotein storage disease caused by mutations in the CTSA gene, encoding the lysosomal carboxypeptidase protective protein/cathepsin A (PPCA). PPCA assembles into a lysosomal multienzyme complex (LMC) with the glycosidases β-galactosidase (β-GAL) and neuraminidase 1 (NEU1), a configuration that renders these enzymes catalytically active and stable in lysosomes.1 A congenital defect of PPCA alters complex formation, leading to loss of NEU1 activity and reduced (∼15%–20%) β-GAL activity.2,3 To date, the combined deficiency of the three enzymes in the complex remains the biochemical and diagnostic hallmark of GS. The severe secondary deficiency of NEU1 accounts for the presence of sialylated glycoproteins and oligosaccharides in tissues and body fluids, a feature that GS shares with sialidosis, caused by the isolated deficiency of NEU1.4
Based on the age of onset and severity of their clinical symptoms, GS patients are classified into three subtypes: early infantile, late infantile, and juvenile/adult. The severe early infantile forms of the disease present with a systemic condition associated with fetal hydrops, skeletal dysplasia, visceromegaly, renal and cardiac failure, neurological involvement, and premature death.2 The late infantile forms comprise a distinct group of patients with mild or absent cognitive involvement. In this group, clinical manifestations appear in the first decade of life and continue into adulthood. They include coarse facies, dysostosis multiplex, growth retardation, heart and kidney problems, and hearing loss.2 About 60% of GS clinical cases belong to the juvenile/adult group, mainly of Japanese descendance.2 Although these patients can have a normal life expectancy, they develop severe clinical signs, including myoclonus, ataxia, neurological symptoms, mental retardation, and angiokeratoma without visceral involvement. The early-onset patients are genetically the most heterogeneous, while the late infantile and juvenile/adult patients may share allelic variants that segregate with these clinical phenotypes.
The only mouse model of GS (Ctsa–/–, formerly referred to as PPCA–/–) currently available was generated by disruption of the Ctsa gene, as previously described.5 Ctsa–/– mice have a reduced lifespan (∼7 months) and already display signs of the disease at birth, being visibly smaller than their wild-type (WT) or heterozygous littermates.5 The early onset and severity of their systemic and neurological phenotypes parallel the clinical manifestations described in GS patients of the early infantile group. At the mid-end stage of the disease, Ctsa–/– mice develop diffuse edema associated with inflammation of the eyelids and thickening of the paws. The occurrence of neurological symptoms, such as tremor, ataxia, and abnormal gait, coincides with progressive loss of Purkinje cells in the cerebellum.5,6 Histopathological examination of Ctsa–/– mice during the preweaning period has revealed widespread lysosomal expansion and storage in cells of the most affected organs, such as kidney, small intestine, liver, and choroid plexus. Overall, cells of the reticuloendothelial or macrophage system are also the primary target of the disease in the mouse model.5 The severe renal involvement, a prominent sign of GS in patients, is fully recapitulated in the Ctsa–/– mice and results in progressive sialyl-oligosacchariduria. Primary deficiency of cathepsin A (CA) is accompanied by the total loss of NEU1 activity, while β-Gal activity is reduced in certain cells, such as skin fibroblasts, in only the early stages of the disease, but gradually increases in most organs as the disease progresses.5
Target therapy for GS is still investigational, but several treatment options, which hold promise for the treatment of patients, have been tested in the Ctsa–/– mice, ranging from bone marrow (BM)-mediated ex vivo gene therapy to enzyme replacement therapy (ERT) and adeno-associated virus (AAV)-mediated in vivo gene therapy.5,7, 8, 9 In recent years, AAV has emerged as the preferred in vivo gene transfer system for the treatment of lysosomal storage diseases (LSDs) because of its efficacy of infection, broad tropism, and safety. Multiple AAV serotypes have been engineered with increased tropism for specific cell populations (e.g., hepatocytes and neurons) and have been tested in LSD patients and animal models.10,11 We have experimented with a self-complementary AAV2/8 vector (scAAV2/8-LP1-hCTSA, hereafter scAAV2/8-CTSA) with restricted expression of a human CTSA transgene to the liver, driven by a liver-specific enhancer-promoter combination.7 In a dose-finding, preclinical study, Ctsa–/– mice were treated at 1 month of age with three escalating doses of the recombinant vector, resulting in a clear reversal of several clinical signs, including edema, gait defects, and oligosacchariduria.
Given the positive outcome of this therapeutic approach, we have now designed a comprehensive study performed in Ctsa–/– mice treated with a high dose (2 × 10¹³ gc/kg) of scAAV2/8-CTSA, with the intent to evaluate AAV biodistribution; long-term efficacy and safety, including the potential occurrence of inflammation and neoplasia; and the presence of neutralizing antibodies. In addition to the correction of histopathological, biochemical, and clinical phenotypes, we demonstrate that the systemic administration of a high dose of the recombinant vector did not elicit any adverse effect, including liver toxicity, immune response, and hyperplasia. To our knowledge, this is one of the few studies aimed at characterizing potential toxicity associated with AAV-mediated gene therapy, which will facilitate the development of a safe and effective therapy for this orphan LSD.
Results
Biodistribution of recombinant AAV in tissues of treated Ctsa–/– mice
To test the long-term effects of administering a single high dose of recombinant vector, a cohort of Ctsa–/– mice were treated with scAAV2/8-CTSA at a concentration of 2 × 10¹³ vg/kg, two times higher than the highest vector dose used previously (1 × 10¹¹ vg/kg).7 Male and female mice were randomized and grouped into seven cohorts (Table 1) with a group size of four scAAV2/8-CTSA-injected (two males and two females) mice and an equal number of WT and Ctsa–/– vehicle-injected controls (Table 1). Ctsa–/– mice were injected intravenously at 1 month of age and analyzed at 7 days and 1, 3, 6, and 12 months post injection. All injected Ctsa–/– mice survived the treatment and outlived the knockout (KO) mice that died, on average, at ∼7 months of age. Therefore, the eldest KO mice used as controls for evaluating efficacy of this therapeutic approach were ∼7 months of age.
Table 1.
Study design for mice receiving scAAV2/8LP1-hPPCA or vehicle treatment
| Group | Test article(s) | Gendera | Genotype | Terminal collection time point |
|---|---|---|---|---|
| 1 (Control) | vehicle | M/F | WT | 7 days–12 months |
| 2 (Control) | vehicle | M/F | Ctsa–/– | 7 days–7 months |
| 3 | scAAV2/8LP1-CTSA | M/F | Ctsa–/– | 7 days |
| 4 | scAAV2/8LP1-CTSA | M/F | Ctsa–/– | 1 month |
| 5 | scAAV2/8LP1-CTSA | M/F | Ctsa–/– | 3 months |
| 6 | scAAV2/8LP1-CTSA | M/F | Ctsa–/– | 6 months |
| 7 | scAAV2/8LP1-CTSA | M/F | Ctsa–/– | 12 months |
n = 4 mice per group, 2 males and 2 females.
We first assessed the vector biodistribution by measuring the copy number of recombinant scAAV2/8-CTSA in the total genomic DNA extracted from multiple organs of treated mice at 12 months post injection. As expected, the highest viral load (average of 1.04 × 10⁶) was detected in the liver, the intended target organ, followed by lymph nodes, diaphragm, heart, ovary, and lung (Figure 1A). The other tissues had 2 log2 lower amounts of viral genome compared to the liver, with the pancreas containing the lowest copy number (average of 7.76 × 10²) (Figure 1A). Low but still detectable levels of viral genome were measured in the brain of treated mice (average of 1.03 × 10⁴). Comparing AAV levels in the liver with those in the brain, we noticed a similar pattern of a gradual decrease in measurable viral genome from 7 days (4.09 × 10⁶ in the liver and 2.79 × 10⁴ in the brain) to 1 year (1.04 × 10⁶ in the liver and 1.03 × 10⁴ in the brain) post injection (Figures 1B and 1C).
Figure 1.

Biodistribution of recombinant AAV in Ctsa–/– mice
(A) scAAV2/8-CTSA copy number in multiple organs of injected animals isolated 12 months post injection, measured per milligram of genomic DNA. (B, C) scAAV2/8-CTSA copy number shown in the (B) liver and (C) brain collected at day 7, and at 1, 3, 6, and 12 months following AAV-mediated gene transfer. Round symbols depict males, while square symbols depict females (n ≥ 2).
High CA activity in AAV-treated Ctsa–/– mice restores the function of the LMC
Ctsa–/– mice treated with scAAV2/8-CTSA showed clear improvement of their gross phenotype and were nearly indistinguishable from their WT counterparts at all time points, including at 12 months post injection; their food intake was normal, and their generalized edema and infertility were entirely resolved. No consistent gender differences were recorded between male and female mice in their response to treatment, but rather, there was variability among animals. Therefore, the data for both gender groups were combined.
The efficacy of infection was first determined by measuring the expression levels of therapeutic PPCA in key target tissues of AAV-injected mice at all time points. Predictably, maximum CA activity was measured in the liver, where enzyme levels reached values ∼250 times higher than those of WT mice at 7-day (200 times) and 1-month (300 times) time points and remained ∼85 times higher than controls at 12 months post injection (Figures 2A and S1A). The sustained and persistent expression of the therapeutic enzyme in the liver resulted in the release of the PPCA zymogen into the circulation, as demonstrated by the correction of both CA and NEU1 activities in GS patients’ fibroblasts after the addition of serum samples from AAV-treated mice to the culture medium (Figure S2). The circulating precursor was efficiently recaptured by deficient cells in visceral organs and in the brain. Spleen and kidney were chosen as representative organs because of their opposing response to therapeutic PPCA (Figures 2B, 2C, S1B, and S1C). Being a hematopoietic organ, splenocytes readily captured the therapeutic enzyme, as demonstrated by the dramatic increase in CA activity measured in this organ throughout the duration of the treatment (Figures 2B and S1B). On the opposite side, the kidney, a less accessible organ and one mainly affected by the disease, also showed sustained levels of CA activity above or equal to those of WT controls at all time points, including at 12 months post treatment (Figures 2C and S1C). Interestingly, CA activity in the brain of treated mice at 7 days and 1 month post injection was 2–1.2 times higher than in the WT controls (Figures 2D and S1D). These results suggest that prolonged, high expression of the therapeutic enzyme in the liver may sustain the spread of PPCA into the brain, although it is still unclear how the protein would cross the blood-brain barrier. The pattern of expression of the PPCA protein in the liver, kidney, and brain of treated male and female mice largely reflected the pattern of CA activity measured in the same tissues (Figures S3A–S3F).
Figure 2.

rhPPCA restores cathepsin A activity and corrects NEU1 and β-GAL activities in Ctsa–/– mice
(A–D) Cathepsin A (CA) activity measured in (A) liver, (B) spleen, (C) kidney, and (D) brain lysates from Ctsa–/– mice treated with scAAV2/8-CTSA and collected 7 days and at 1, 3, 6, and 12 months following AAV-mediated gene transfer. (E–H) NEU1 and (I–L) β-GAL activities were measured in the same sets of tissues: (E and I) liver, (F and J) spleen, (G and K) kidney, and (H and L) brain. All the graphs are presented as mean ± SD. Statistical analyses were performed using the Brown-Forsythe test; statistical differences between untreated and treated Ctsa–/– mice are indicated: ∗p < 0.05, ∗∗p < 0.01, ∗∗∗p < 0.001, ∗∗∗∗p < 0.0001. Round symbols depict males, while square symbols depict females (n ≥ 3).
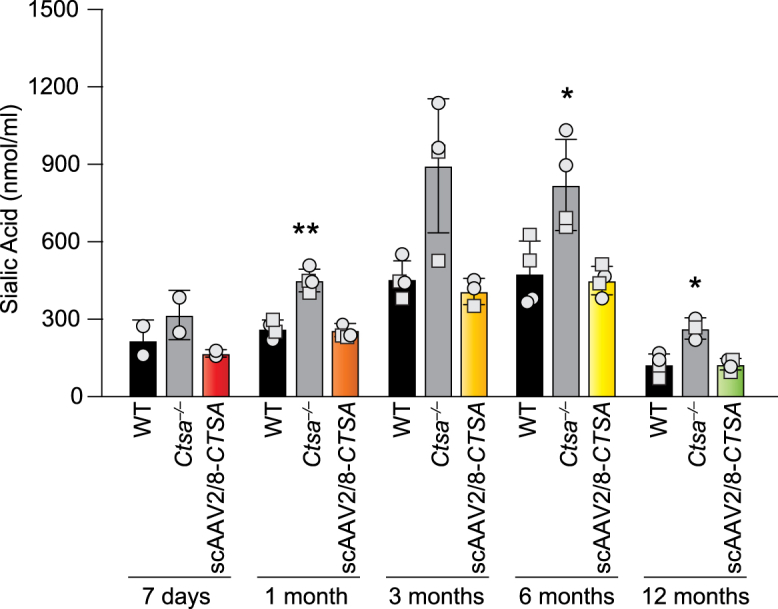
Restored CA activity in affected organs was paralleled by an increase in Neu1 activity that was equal to or greater than that measured in WT animals at all time points (Figures 2E–2H and S1E–S1H). Similarly, β-Gal activity, which tends to be at least two times higher than in WT controls in untreated Ctsa–/– mice, was normalized in all tissues of AAV-injected mice, including the brain, at each time point (Figures 2I–2L and S1I–S1L). Last, treated mice showed a complete reversal of sialyl-oligosacchariduria up to 12 months post injection (Figure 3), confirming that restored expression of PPCA promotes the formation of a functional LMC.
Figure 3.
Sialyl-oligosacchariduria reversal in scAAV2/8-CTSA-treated mice
Urinary sialic acid levels were measured 7 days and 1, 3, 6, and 12 months after AAV-mediated gene transfer. Data are presented as mean ± SD. The dots in the graphical bars represent values obtained from each mouse. Statistical analyses were performed using the Brown-Forsythe test. ∗p < 0.05, ∗∗p < 0.01. Round symbols depict males, while square symbols depict females (n ≥ 3).
Reversal of histopathology in AAV-treated Ctsa–/– mice
Comparative histopathology of the liver, kidney, and spleen (Figures 4, 5, 6, and S4 and Tables S1 and S2) from treated and untreated Ctsa–/– mice and WT controls was performed on H&E-stained sections. Montages of sequential images were stitched together to render a high-resolution composite image encompassing a large area of the individual tissues. The images of the Ctsa–/– liver, comprising several lobules (Figure 4A and inset), highlighted the severe and widespread vacuolation of the hepatocytes, the endothelial cells of the sinusoids, and the Kupffer cells (Figure 4). In contrast, mice treated with scAAV2/8-CTSA showed complete normalization of the tissue architecture at 12 months post AAV injection (Figure S4A), which appeared nearly indistinguishable from that of the WT control (Figures 4B and 4C and insets). In agreement with the reversal of tissue morphology after treatment, immunohistochemistry (IHC) with anti-human PPCA antibody revealed high levels of expression of the protein in all affected cells, particularly those surrounding the blood vessels (Figure 4D and inset). The composite image of the Ctsa–/– kidney from the cortex to the medulla (Figure 5A and inset) showed marked vacuolation of the convoluted tubular epithelium, the Bowman capsule and podocytes of the glomeruli, endothelial cells of the blood vessels in the cortex, and the ductal epithelium in the medulla. Occasional proteinaceous deposits were also visible (Figure 5A and inset). Despite being one of the most difficult organs to target by therapeutics, the kidney of treated mice also displayed extensive correction of tissue morphology, particularly evident in the cortex, whose appearance was comparable to that in the WT kidney (Figures 5B and 5C and insets; Figure S4B). Immunostaining of tissue sections demonstrated vast uptake of the PPCA precursor protein, especially in the cortex region by cells of the Bowman capsule and the proximal and distal tubular epithelium (Figure 5D and inset). The composite image of the Ctsa–/– spleen (Figure 6A and inset) showed large areas of highly vacuolated splenocytes, primarily in the red pulp, most of them of histiocytic origin. Again, the morphology of the spleen of treated mice appeared entirely normalized, compared with the WT tissue (Figures 6B and 6C and insets; Figure S4C). Correction was particularly evident in the highly vascularized red pulp that also contained the highest number of PPCA-positive splenocytes (Figure 6D and inset).
Figure 4.

Complete restoration of liver morphology in scAAV2/8-CTSA
Composite images of H&E-stained sections show extensive vacuolization in the liver of untreated Ctsa–/– mice (A and inset), but a complete clearance and restoration to WT morphology in animals treated with scAAV2/8-CTSA (B, wild type; C, scAAV2/8-CTSA; and insets). (D and inset) Representative composite of IHC images performed on the liver of scAAV2/8-CTSA-treated mice using a human PPCA-specific antibody. Brown punctate staining depicts compartmentalized/lysosomal PPCA staining.
Figure 5.

Extensive correction of kidney morphology in scAAV2/8-CTSA-treated mice
Montage of images of H&E-stained sections shows extensive disruption of kidney architecture in untreated Ctsa–/– mice (A and inset), but a nearly full improvement of tissue morphology similar to WT morphology in animals treated with scAAV2/8-CTSA (B, wild type; C, scAAV2/8-CTSA; and insets). (D and inset) Representative composite of IHC images performed on the kidney of AAV2/8-treated Ctsa–/– mice using a human PPCA-specific antibody. Brown punctate staining depicts compartmentalized/lysosomal PPCA staining.
Figure 6.

Normalization of spleen architecture in scAAV2/8-CTSA-treated mice
Montage of images of H&E-stained sections shows extensive ballooning of splenocytes in untreated Ctsa–/– mice (A and inset), but resolution of cell vacuolation and complete normal morphology similar to WT in animals treated with scAAV2/8-CTSA (B, wild type; C, scAAV2/8-CTSA; and insets). (D and inset) Representative composite of IHC images performed on the spleen of injected animals using a human PPCA-specific antibody. Brown punctate staining depicts compartmentalized/lysosomal PPCA staining.
Last, we were able to detect PPCA in the brain of treated mice at 12 months post injection (Figure 7). Scattered neurons and glia with punctate PPCA staining were detected in different brain regions, including the cortex, the cerebellum, the hippocampus, the brain stem, and the deep cerebellar nucleus (Figure 7). The protein was most efficiently internalized by the epithelial cells of the choroid plexus, which is a highly vascularized brain structure (Figure 7). These findings are potentially relevant from a therapeutic standpoint, although in order to translate them to the clinic, we would require further experiments in larger animal models.
Figure 7.

Detection of PPCA in the brain of scAAV2/8-CTSA-treated mice
Representative IHC images using a human PPCA-specific antibody in several regions of the brain of injected animals. Corresponding brain regions of untreated Ctsa–/– mice are shown for comparison. Brown punctate staining depicts compartmentalized/lysosomal PPCA staining. CP, choroid plexus; DCN, deep cerebellar nucleus.
Absence of neoplastic signs in the liver of AAV-treated Ctsa–/– mice
Given the potential risk for long-term AAV-treated mice to develop hepatocellular carcinoma,12 we also surveyed multiple areas of the livers from treated Ctsa–/– mice at 12 months post injection. An example of a large, screened area of the tissue is shown in the H&E montage of Figure 4C. We could not detect any signs of abnormal morphology or growth, pleomorphism, aberrant trabeculae, and/or local infiltration in any of the liver tissues from the cohort of treated mice. In addition, we could not identify areas of ischemia, inflammation, or necrosis (Figure 4C).
Clinical chemistry and differential blood count in AAV-treated Ctsa–/– mice
We next performed a series of laboratory tests commonly used in the human population to obtain standardized, multiparametric, diagnostic measurements of blood samples and sera collected from all seven cohorts of mice (Table 1). The levels of amylase and glucose were used to assess pancreatic functionality (Table 2); the concentration of several electrolytes (calcium, phosphorus, potassium, and sodium) and the levels of blood urea nitrogen (BUN) and creatinine were indicative of kidney function (Table 2). In addition, to evaluate overall hepatic function and potential toxicity of high-dose AAV with sustained expression of the CTSA transgene in the liver, we tested a panel of liver-specific markers in the sera of treated and untreated mice (Table 2). Measured values of albumin, globulin, total bilirubin, total protein, and the liver enzymes alanine aminotransferase (ALT) and alkaline phosphatase (ALP) remained within normal range in all cohorts throughout the length of the treatment, further reiterating the safety and absence of toxicity following this therapeutic approach. Finally, we performed a differential blood count. We found no significant differences for values of hemoglobin, platelets, and hematocrit, as well as no statistically significant differences for absolute cell counts of neutrophils, lymphocytes, monocytes, eosinophils, basophils, and red blood cells in all the groups tested and at all time points post injection (Table 3).
Table 2.
Comprehensive metabolic panel
| Rangea/unit | 7 days | 1 month | 3 months | 6 months | 12 months | ||
|---|---|---|---|---|---|---|---|
| Pancreatic function | |||||||
| Amylase | 602–2,311 | WT | 1,175 ± 88 | 1,529 ± 252 | 1,452 ± 65 | 1,844 ± 671 | 1,394 ± 352 |
| U/L | Ctsa–/– | 1,153 ± 154 | 1,405 ± 320 | 1,774 ± 575 | 1,955 ± 315 | 2,494 ± 384 | |
| scAAV2/8-CTSA | 1,778 ± 592 | 1,552 ± 186 | 1,642 ± 237 | 1,305 ± 226 | 1,772 ± 762 | ||
| Glucose | 106–278 | WT | 294 ± 36 | 267 ± 42 | 245 ± 40 | 208 ± 42 | 219 ± 49 |
| mg/dL | Ctsa–/– | 253 ± 58 | 265 ± 36 | 193 ± 31 | 219 ± 43 | 100 ± 51 | |
| scAAV2/8-CTSA | 179 ± 63 | 242 ± 43 | 177 ± 58 | 208 ± 45 | 238 ± 15 | ||
| Renal function (electrolytes) | |||||||
| Calcium | 9–12 | WT | 10.2 ± 0.16 | 10.6 ± 1.98 | 10.7 ± 0.10 | 9.4 ± 1.12 | 15.9 ± 1.54 |
| mg/dL | Ctsa–/– | 11.3 ± 0.77 | 10.5 ± 0.64 | 9.5 ± 0.38 | 9.7 ± 0.80 | 11.2 ± 2.04 | |
| scAAV2/8-CTSA | 10.6 ± 1.12 | 10.8 ± 1.02 | 8.7 ± 1.81 | 9.3 ± 1.06 | 13.1 ± 0.93 | ||
| Phosphorus | 6–13 | WT | 12.8 ± 0.30 | 10.4 ± 1.23 | 8.43 ± 0.92 | 10.5 ± 1.25 | 12.9 ± 2.97 |
| mg/dL | Ctsa–/– | 15.6 ± 1.70 | 11.0 ± 0.60 | 10.8 ± 2.85 | 10.0 ± 0.69 | 12.6 ± 2.35 | |
| scAAV2/8-CTSA | 13.5 ± 1.74 | 9.93 ± 0.86 | 8.10 ± 0.96 | 11.3 ± 0.55 | 10.8 ± 1.30 | ||
| Potassium | 5–9 | WT | 9.7 ± 0.43 | 9.2 ± 1.2 | 7.6 ± 0.57 | 9.6 ± 1.5 | 10.0 ± 2.6 |
| mmol/L | Ctsa–/– | 12 ± 1.9 | 9.3 ± 1.9 | 10 ± 0.63 | 9.6 ± 0.77 | 7.9 ± 1.5 | |
| scAAV2/8-CTSA | 11 ± 2.3 | 7.4 ± 0.0 | 7.3 ± 0.57 | 10 ± 0.41 | 11 ± 1.9 | ||
| Sodium | 147–167 | WT | 143 ± 1.2 | 151 ± 7.7 | 139 ± 1.5 | 152 ± 8.7 | 142 ± 2.2 |
| mmol/L | Ctsa–/– | 147 ± 4.2 | 144 ± 5.5 | 148 ± 2.8 | 144 ± 8.5 | 148 ± 17 | |
| scAAV2/8-CTSA | 147 ± 3.1 | 141 ± .00 | 132 ± 8.5 | 138 ± 13 | 152 ± 7.7 | ||
| Renal function | |||||||
| Blood urea nitrogen (BUN) | 19–34 | WT | 25.5 ± 4.8 | 28.1 ± 6.0 | 28.5 ± 3.5 | 24.0 ± 1.5 | 25.5 ± 6.7 |
| mg/dL | Ctsa–/– | 26.2 ± 1.5 | 24.8 ± 3.0 | 27.0 ± 2.1 | 29.5 ± 5.5 | 51.4 ± 22.6 | |
| scAAV2/8-CTSA | 27.2 ± 4.4 | 26.5 ± 4.4 | 28.7 ± 7.2 | 27.6 ± 11.4 | 28.3 ± 2.6 | ||
| Creatinine | 0.5–0.8 | WT | 0.33 ± 0.10 | 0.42 ± 0.16 | 0.35 ± 0.12 | 0.25 ± 0.10 | 0.20 ± 0.04 |
| mg/dL | Ctsa–/– | 0.18 ± 0.12 | 0.60 ± 0.01 | 0.36 ± 0.21 | 0.33 ± 0.11 | 0.38 ± 0.14 | |
| scAAV2/8-CTSA | 0.25 ± 0.08 | 0.32 ± 0.12 | 0.30 ± 0.15 | 0.24 ± 0.04 | 0.24 ± 0.09 | ||
| Hepatic function | |||||||
| Albumin | 2.6–4.6 | WT | 2.95 ± 0.10 | 3.00 ± 0.00 | 3.25 ± 0.13 | 3.05 ± 0.30 | 3.00 ± 0.43 |
| g/dL | Ctsa–/– | 3.20 ± 0.28 | 3.23 ± 0.32 | 2.80 ± 0.16 | 2.65 ± 0.34 | 2.00 ± 0.50 | |
| scAAV2/8-CTSA | 2.60 ± 0.37 | 3.13 ± 0.15 | 3.15 ± 0.41 | 2.80 ± 0.43 | 2.60 ± 0.87 | ||
| Globulin | 2.2–2.6 | WT | 2.40 ± 0.16 | 2.73 ± 1.03 | 2.78 ± 0.17 | 2.65 ± 0.38 | 2.35 ± 0.62 |
| g/dL | Ctsa–/– | 2.20 ± 0.52 | 2.30 ± 0.46 | 2.50 ± 0.58 | 2.45 ± 0.34 | 1.90 ± 0.86 | |
| scAAV2/8-CTSA | 2.60 ± 0.98 | 2.75 ± 0.21 | 3.80 ± 0.49b | 2.75 ± 0.38 | 2.65 ± 0.57 | ||
| Total bilirubin | 0.3–0.8 | WT | 1.50 ± 0.58 | 0.53 ± 0.33 | 0.62 ± 0.51 | 0.60 ± 0.26 | 1.30 ± 0.13 |
| mg/dL | Ctsa–/– | 0.92 ± 0.62 | 0.68 ± 0.14 | 0.38 ± 0.23 | 0.61 ± 0.16 | 0.63 ± 0.66 | |
| scAAV2/8-CTSA | 0.78 ± 0.64 | 0.62 ± 0.39 | 0.39 ± 0.19 | 1.10 ± 0.42 | 1.30 ± 0.18 | ||
| Total protein | 4.3–6.4 | WT | 5.5 ± 0.25 | 6.3 ± 1.30 | 6.0 ± 0.15 | 5.7 ± 0.62 | 5.4 ± 0.97 |
| g/dL | Ctsa–/– | 5.4 ± 0.78 | 5.6 ± 0.29 | 5.3 ± 0.38 | 5.1 ± 0.66 | 4.5 ± 1.80 | |
| scAAV2/8-CTSA | 5.3 ± 0.60 | 5.9 ± 0.21 | 6.9 ± 0.89 | 5.6 ± 0.81 | 6.1 ± 0.93 | ||
| Alanine | 26–120 | WT | 43.5 ± 15 | 136 ± 79 | 116.0 ± 30 | 45.5 ± 18 | 45.0 ± 21 |
| Aminotransferase (ALT) | U/L | Ctsa–/– | 22.5 ± 19 | 95.7 ± 27 | 101.0 ± 78 | 37.5 ± 6.8 | 61.5 ± 46 |
| scAAV2/8-CTSA | 104.0 ± 69 | 140.0 ± 39 | 88.7 ± 9.5 | 52.0 ± 9.2 | 33.0 ± 20 | ||
| Alkaline phosphatase (ALP) | 44–118 | WT | 186 ± 17 | 187 ± 99 | 144 ± 23 | 58 ± 15 | 90 ± 20 |
| U/L | Ctsa–/– | 251 ± 30 | 173 ± 35 | 124 ± 50 | 71 ± 7 | 80 ± 49 | |
| scAAV2/8-CTSA | 299 ± 33b | 223 ± 26 | 124 ± 12 | 90 ± 23 | 82 ± 26 | ||
The range is based on data from mice ages 6–8 weeks provided by St Jude Children's Research Hospitals Veterinary Pathology Core.
Values in treated animals that show statistical difference from the WT group, p < 0.05.
Table 3.
Complete blood count
| Units | Rangea | 7 days | 1 month | 3 months | 6 months | 12 months | ||
|---|---|---|---|---|---|---|---|---|
| Hemoglobin | g/dL | 10.9–13.0 | WT | 13.0 ± 0.5 | 13.8 ± 0.6 | 12.0 ± 0.5 | 12.5 ± 0.5 | 13.9 ± 0.6 |
| Ctsa–/– | 13.2 ± 0.9 | 13.2 ± 0.9 | 12.1 ± 0.5 | 11.3 ± 0.3 | 9.9 ± 2.3 | |||
| scAAV2/8-CTSA | 13.3 ± 0.4 | 12.7 ± 0.5 | 13.1 ± 0.4 | 11.6 ± 1.0 | 12.7 ± 0.8 | |||
| Platelets | ×103/μL | 706.5–988.2 | WT | 725 ± 43 | 567 ± 69 | 701 ± 90 | 634 ± 24 | 736 ± 56 |
| Ctsa–/– | 689 ± 104 | 546 ± 181 | 469 ± 91 | 672 ± 15 | 616 ± 103 | |||
| scAAV2/8-CTSA | 771 ± 137 | 533 ± 26 | 657 ± 54 | 485 ± 53 | 641 ± 25 | |||
| Hematocrit | % | 36.3–44.5 | WT | 42 ± 1.1 | 47 ± 2.4 | 43 ± 2.1 | 46 ± 1.6 | 49 ± 3.0 |
| Ctsa–/– | 50 ± 1.5 | 47 ± 2.0 | 44 ± 2.5 | 44 ± 1.1 | 33 ± 6.3 | |||
| scAAV2/8-CTSA | 50 ± 1.5 | 45 ± 2.0 | 47 ± 1.3 | 38 ± 2.7 | 44 ± 2.1 | |||
| White blood cells | ×103/μL | 2.0–6.5 | WT | 5.1 ± 0.92 | 7.2 ± 3.3 | 3.5 ± 0.45 | 4.6 ± 0.7 | 4.6 ± 0.85 |
| Ctsa–/– | 6.8 ± 1.7 | 11.0 ± 3.2 | 9.5 ± 2.9 | 4.3 ± 0.79 | 2.3 ± 0.89 | |||
| scAAV2/8-CTSA | 7.5 ± 2.2 | 9.5 ± 1.7 | 5.3 ± 1.0 | 6.0 ± 1.7 | 4.4 ± 0.82 | |||
| Neutrophils | % | 16.7–24.6 | WT | 33.4 ± 2.2 | 21.3 ± 3.8 | 19.1 ± 4.3 | 29.5 ± 3.7 | 40.5 ± 10.9 |
| Ctsa–/– | 31.2 ± 2.8 | 20.5 ± 4.2 | 22.9 ± 5.2 | 38.2 ± 8.7 | 44.9 ± 7.3 | |||
| scAAV2/8-CTSA | 24.4 ± 5.6 | 21.4 ± 7.0 | 26.6 ± 4.6 | 25.6 ± 1.9 | 31.1 ± 4.0 | |||
| Lymphocytes | % | 62.1–73.9 | WT | 55.5 ± 2.7 | 67.1 ± 10.8 | 78.1 ± 5.5 | 59.3 ± 5.7 | 53.2 ± 7.2 |
| Ctsa–/– | 54.6 ± 2.1 | 72.2 ± 6.4 | 67.8 ± 9.0 | 52.8 ± 7.2 | 51.0 ± 7.0 | |||
| scAAV2/8-CTSA | 62.1 ± 10.3 | 68.6 ± 6.3 | 65.6 ± 4.6 | 60.2 ± 1.7 | 60.1 ± 5.7 | |||
| Monocytes | % | 6.2–14.5 | WT | 9.92 ± 1.3 | 7.57 ± 0.5 | 3.34 ± 1.91 | 9.41 ± 1.4 | 5.63 ± 4.1 |
| Ctsa–/– | 10.8 ± 2.2 | 6.24 ± 1.0 | 8.07 ± 2.9 | 8.23 ± 1.7 | 2.98 ± 1.7 | |||
| scAAV2/8-CTSA | 9.04 ± 2.2 | 9.28 ± 0.7 | 7.59 ± 0.2 | 10.5 ± 1.6 | 7.37 ± 1.6 | |||
| Eosinophils | % | 0.03–0.4 | WT | 0.89 ± 0.6 | 0.36 ± 0.4 | 0.05 ± 0.05 | 1.42 ± 1.2 | 0.48 ± 0.3 |
| Ctsa–/– | 2.26 ± 0.7 | 0.59 ± 0.9 | 0.79 ± 1.3 | 0.38 ± 0.3 | 0.77 ± 1.2 | |||
| scAAV2/8-CTSA | 1.43 ± 1.1 | 0.73 ± 0.6 | 0.23 ± 0.3 | 2.4 ± 1.8 | 1.21 ± 1.3 | |||
| Basophils | % | 0.05–0.4 | WT | 0.26 ± 0.2 | 0.13 ± 0.1 | 0.02 ± 0.03 | 0.45 ± 0.6 | 0.23 ± 0.3 |
| Ctsa–/– | 1.20 ± 0.2 | 0.45 ± 0.5 | 0.38 ± 0.4 | 0.40 ± 0.4 | 0.33 ± 0.6 | |||
| scAAV2/8-CTSA | 0.52 ± 0.5 | 0.09 ± 0.08 | 0.03 ± 0.1 | 0.70 ± 0.7 | 0.20 ± 0.3 | |||
| Red blood cells | ×106/μL | 7.5–9.1 | WT | 7.9 ± 0.2 | 8.6 ± 0.6 | 8.9 ± 0.4 | 8.6 ± 0.3 | 9.3 ± 0.2 |
| Ctsa–/– | 8.1 ± 0.3 | 8.8 ± 0.4 | 8.3 ± 0.4 | 8.3 ± 0.2 | 7.0 ± 1.4 | |||
| scAAV2/8-CTSA | 8.2 ± 0.6 | 8.2 ± 0.5 | 8.7 ± 0.4 | 7.8 ± 0.4 | 8.4 ± 0.5 |
The range is based on data from mice ages 6–8 weeks provided by St Jude Children's Research Hospitals Veterinary Pathology Core.
Testing of antibody production against AAV2/8 capsid and human PPCA
One of the most encountered hurdles in AAV-mediated therapy is the risk that the recipient individual would mount an immune response toward the vector and/or the transgene product. This usually manifests with a weak innate immune response and a stronger adaptive immune response.13,14 The adaptive immune response involves the activation of both B cells that produce antibodies and cytotoxic T cells that ultimately kill infected cells. B cells can produce antibodies against the product of the transgene, but more often produce neutralizing antibodies against the viral capsid, which may prevent infection and therapeutic gene expression.14,15 Sera collected at 7 days and 1, 3, 6, and 12 months post injection were tested for the presence of antibodies against the viral capsid (AAV2/8) or against the human PPCA protein. These analyses showed the presence of antibodies against the virus at all time points (Figure 8A). Most importantly, no antibody response was detected against the human PPCA protein in any of the treated groups (Figure 8B). The presence of antibodies against the viral capsid may be due to the high titer of the vector employed in this study and/or the use of a self-complementary double-stranded AAV vector rather than a single-stranded vector.16 However, considering the widespread presence of the PPCA protein in all organs tested, the sustained CA activity throughout the duration of treatment, and the normalization of all the pathological parameters at 12 months post injection, these antibodies did not seem to hamper the efficacy of the therapy.
Figure 8.

Antibody production and T cell response following treatment with scAAV2/8-CTSA
Levels of neutralizing antibodies against the AAV-2/8 capsid (A) and PPCA transgene product (B) were assessed by ELISA. Anti-PPCA antibody was used as positive control. (C) IFN-γ-specific spot-forming cells were measured via ELISpot for IFN-γ following stimulation of splenocyte samples with scAAV2/8 and scAAV2/8-CTSA. Media from unstimulated splenocytes (medium only) were used as a negative control; PMA-stimulated splenocytes were used as positive control for the assay. Percentage of (D) CD4pos T and (E) CD8pos T cells measured via flow cytometry of cultured splenocyte samples from treated mice following in vitro re-exposure to scAAV2/8 capsid and scAAV2/8-CTSA. Data are presented as mean ± SD. Statistical analyses were performed using the Brown-Forsythe test. ns, not significant; ∗∗p < 0.01, ∗∗∗p < 0.001. Round symbols depict males, while square symbols depict females (n ≥ 3).
Absence of T cell response to scAAV2/8-CTSA
To determine the immune-mediated toxicity that could occur during AAV-based therapy, we also measured interferon γ (IFN-γ) production and the relative percentage of CD4pos and CD8pos T cells in cultured splenocytes harvested from AAV-treated mice and re-exposed in vitro to the AAV virus. The IFN-γ ELISpot method, in conjunction with measurement of antibody production, is the most widely used technique to assess T cell immunity against multiple AAV serotypes.17 Splenocytes collected from WT and treated Ctsa–/– mice (13 months) as well as untreated Ctsa–/– mice (7 months) were cultured and re-infected with either scAAV2/8-CTSA or an empty scAAV2/8 vector. No significantly high levels of IFN-γ were measured in different splenocyte cultures, unless they were treated with the IFN-γ inducer phorbol 12-myristate 13-acetate (PMA)/ionomycin, used as positive control (Figure 8C). In addition, splenocyte cultures were used to assess the percentage of CD4pos or CD8pos T cells via flow cytometry (Figures S5A–S5D). No significant difference in the percentage of these T cells was detected among the different splenocyte cultures (Figures 8D and 8E), indicating that AAV treatment did not elicit a T-cell-mediated immune response.
Discussion
In recent years, AAV-mediated gene therapy has become the preferred therapeutic method for LSD patients, and, as a result, several clinical trials have been approved by the Food and Drug Administration (FDA) and the European Medicines Agency (EMA). This effort has been spearheaded by the development of numerous AAV serotypes, isolated from humans, nonhuman primates, and other species.18 AAV2 was the first serotype to be vectorized and has been pseudo-typed using the capsids of other AAVs.19 This has expanded the cell types that can be infected by AAV, and, in turn, increased the efficacy of AAV-mediated gene therapy. An example of such engineering is the AAV we have used in this study, a pseudo-type of the AAV2 vector genome with the AAV8 capsid (designated AAV2/8), with enhanced tropism for hepatocytes.20 Furthermore, efficient transduction depends on the binding of different AAV vectors to specific receptors and co-receptors present on target cells, which is again influenced by the specific AAV capsid.21
LSDs are particularly amenable to AAV-mediated gene therapy compared with other genetic diseases, because of the unique properties of many lysosomal enzymes to be secreted into the circulation as inactive or partially active precursors and, then, recaptured by neighboring or distant cells via receptor-mediated endocytosis.22 Thus, AAV-infected deficient cells can become producers of the therapeutic enzyme that, when secreted, cross-corrects other deficient cells and, in turn, reverts the pathologic manifestations inherent to the disease. AAV-mediated, in vivo gene therapy has been implemented in several LSD models and patients for the treatment of GM1 gangliosidosis, mucopolysaccharidosis type I (MPSI) and MPSIIIB, Sandhoff disease, metachromatic leukodystrophy, and Krabbe disease.23 However, only a few reports are present in the literature that have addressed the potential side effects of long-term overexpression of a therapeutic enzyme and/or high vector dose.24, 25, 26 Here, we have exploited the therapeutic potential of PPCA for the treatment of GS by investigating the effect of a high-dose scAAV2/8-CTSA vector in Ctsa–/– mice, expressing the transgene from a liver-specific promoter. The intent of the study was to evaluate not only the efficacy of the treatment in correcting several disease-specific phenotypes, but also the potential toxicity associated with a high dose of the AAV vector and/or overexpression of the CTSA transgene, including the mounting of an immune response.
Overcoming the host immune response is indispensable for the successful treatment of LSDs in patients, since it can seriously hamper the safety and efficacy of this gene therapy approach. The host may elicit both humoral and cellular immune responses by activating antigen-specific CD4pos helper and/or CD8pos cytotoxic T cells, and by producing antibodies against the viral capsid and/or the transgene product. Capsid-neutralizing antibodies have been detected following AAV-mediated gene therapy with detrimental effects on treatment outcome, as was reported in preclinical studies carried out in animal models of Pompe disease and hemophilia B.27, 28, 29 Surprisingly, in our current study, we have detected antibodies only against the viral capsid, not the PPCA transgene product, despite the fact that our mouse model is a total knockout. This indicates that the human PPCA protein is not particularly immunogenic in this experimental setting, as was observed previously using other therapeutic approaches in the same mouse model.5,7, 8, 9 In addition, the lack of neutralizing antibodies against PPCA explains the sustained expression of the transgene at 12 months post injection. These results should also take into account the intrinsic characteristics of the PPCA protein, which is secreted as a zymogen, is readily internalized by deficient cells, and is stable in tissues. In contrast, in a human clinical trial for hemophilia B, which employed the identical AAV backbone used in this study, intravenous injection of a scAAV2/8.LP1.hcoFIX vector resulted in a long-lasting (>5 years) increase in plasma FIX (from <1% to 1%–8%), but the patients developed antibodies against AAV capsid epitopes.30 In addition, and again contrary to our observations, elevated transaminases were measured at 7–10 weeks post AAV injection, and the patients needed to be treated with corticosteroids to normalize their levels.31 Most likely, the combination of persistent liver insult and the strong immune response against the AAV capsid contributed to the clearance of 50%–70% in plasma FIX.31 Although we cannot compare our mouse study with the aforementioned human clinical trial, we can postulate that the persistent expression of the PPCA transgene for up to 12 months post injection is indeed attributable to the nonimmunogenic and nontoxic nature of the protein. This also explains why there is no activation of antigen-specific CD4pos helper and/or CD8pos cytotoxic cells and no detectable liver inflammation.
The results of these studies are also relevant in light of recent reports that link high doses of AAV particles to acute liver failure and shock in nonhuman primates as well as proprioceptive ataxia in pigs.32,33 Although AAV gene therapy seems to be the elected therapeutic choice for LSDs, a few studies have raised concerns about the use of recombinant AAV as a gene transfer vector because of evidence of AAV integration in the host cells.34, 35, 36, 37 This could occur within or in the proximity of oncogenes, potentially promoting malignant transformation. Several reports have described integration of AAV into the RNA imprinted and accumulated in nucleus (Rian) locus or near growth-regulatory genes, following long-term gene therapy.38 These integration events have been linked to the development of hepatocellular carcinoma (HCC). For example, in a preclinical gene therapy study performed in a canine model of factor VIII deficiency, nine dogs were followed for 10 years. Analysis of integration sites in liver samples from six treated dogs identified more than 1,700 AAV integration events in the genomic DNA, with a considerable percentage of these in the vicinity of regulatory genes, resulting in hyperplasia of liver cells in five dogs.39 Adding to these concerns is the high incidence of HCC observed in a murine model of Krabbe disease after CNS-directed therapy.40 Although worrisome, the occurrence of HCC seems to depend on several contributing factors, i.e., the very high dose of AAV vector, the use of strong promoter/enhancer elements, the starting of treatment during the neonatal period, and, most importantly, liver damage/inflammation.12 These “predisposing factors” have been implicated in increased occurrence of HCC41 in mice with nonalcoholic fatty liver disease or liver injury that have been treated with AAV-based therapy, targeting the Rian locus. This is also in line with an occurrence of HCC in a hemophilic patient treated with AAV5-FIX,42 which has halted a clinical trial for hemophilia managed by the company uniQure. As in the case of the murine study, the patient had multiple risk factors associated with HCC, including a history of hepatitis C and hepatitis B and evidence of nonalcoholic fatty liver disease.
It is, however, reassuring that a very recent prospective study in mouse and cat models of MPSVI treated at young adult age and at postnatal day 50, respectively, with a high-dose, single-stranded AAV2/8 vector expressing human arylsulfatase B in the liver found low incidence of HCC.25 In line with this study, we found no evidence of liver injury or inflammation, as well as no detectable HCC for up to 12 months after scAAV2/8-CTSA-mediated therapy.
In conclusion, the high-efficacy and low-toxicity results of this preclinical study provide a strong rationale for implementing AAV-mediated in vivo gene therapy in the treatment of patients with GS.
Materials and methods
Study design
The Ctsa–/– model has been extensively used in several preclinical studies to test various therapeutic approaches, and no clear gender bias to treatment has been observed. In addition, because the males are infertile and the crossing of heterozygotes produces small litters with often a limited number of Ctsa–/– mice, we were allowed by an FDA pre-IND panel to reduce the number of animals in compliance with the 3R guiding principles for animal experimentation.43 A total of 28 mice were used in this study. They were divided into seven groups, composed of four mice each, two males and two females. Four Ctsa–/– mice in each group received a dose of scAAV2/8-LP1-hCTSA (scAAV2/8-CTSA) at 2 × 10¹³ vg/kg administered via tail vein at 1 month of age and were sacrificed 7 days and 1, 3, 6, and 12 months post injection. Two male and two female WT and Ctsa–/– mice were used as controls in each group. Liver, lung, spleen, heart, kidney, pancreas, testis, epididymis or uterus and ovary, diaphragm, jejunum, inguinal lymph nodes, and brain were collected for enzymatic activities and immunohistochemistry and biodistribution analyses and were either snap-frozen in liquid nitrogen or fixed in 10% neutralized formalin and paraffin embedded. Blood and urine were collected at all time points. Sera were used for the clinical chemistry and complete blood count (CBC) panels and antibody response; urine was used for sialic acid content analyses.
Animals
Animals were housed in a fully Association for Assessment and Accreditation of Laboratory Animal Care (AAALAC)-accredited animal facility with controlled temperature (22°C), humidity, and lighting (alternating 12-h light/dark cycles). Food and water were provided ad libitum. All procedures in mice were performed according to animal protocols approved by the St Jude Children's Research Hospital Institutional Animal Care and Use Committee and National Institutes of Health guidelines. All experiments were performed in Ctsa–/– mice and WT littermate controls in the FVB background.
scAAV2/8-CTSA vector production and titration
The production and titration of the scAAV2/8-CTSA construct have been previously described.7 The scAAV vector particles were made using a good manufacturing practice (GMP) process, comparable to the transient-transfection procedure in the Children's GMP, LLC, facility on the St Jude campus, as previously described for the hemophilia B vector.44
Biodistribution
Genomic DNA was extracted from liver, lung, heart, kidney, pancreas, testis, epididymis or uterus and ovary, diaphragm, jejunum, inguinal lymph nodes, and brain by using the DNeasy Blood and Tissue Kit (Qiagen, Germantown, MD, USA), following the manufacturer's guidelines. qRT-PCR was performed using a primer set spanning the LP1 promotor and the PPCA gene insert. A standard curve with known copy number was used to determine the concentration in all tissues tested. Results were plotted as copy number/μg DNA.
Cathepsin A, Neu1, and β-GAL activity assays
Snap-frozen liver, spleen, kidney, and brain samples isolated from WT, untreated, and treated Ctsa–/– mice from each group were homogenized on ice in three volumes of water (w/v) using the Qiagen TissueLyser II (Qiagen, Germantown, MD, USA). CA activity was measured against the dipeptide Z-Phe-Ala (Sigma, St. Louis, MO, USA), Neu1 catalytic activity was measured against synthetic 4-methylumbelliferyl-α-D-N-acetylneuraminic acid (Sigma, St. Louis, MO, USA), and β-GAL was measured against 4-methylumbelliferryl-β-D-galactopyranoside (Sigma, St. Louis, MO, USA). All reactions were performed at 37°C for 1 h and stopped with carbonate stop buffer (0.5 M Na2CO3 with the pH set to 10.7 by adding 0.5 M NaHCO3) for Neu1 and β-GAL activities, while the CA activity was stopped at 100°C for 5 min, and 10 μL reaction mixture was read in 250 μL 50 mM sodium-carbonate stop buffer (pH 9.5), containing 500 μL o-phthaldialdehyde (10 mg/mL) and 500 μL 2-mercaptoethanol (5 μL/mL) per 30 mL. Fluorescence was measured at λex 355/λem 460 and interpolated to a standard curve adjusted for dilution and normalized to protein concentration.
Uptake of PPCA zymogen in patients' fibroblasts
A total of 1.5 × 10⁵ GS and control fibroblasts were seeded into six-well plates in duplicate and cultured until 90% confluency. Fibroblasts were grown at 37°C in Dulbecco's modified Eagle's medium (DMEM) supplemented with 10% fetal bovine serum (FBS) (BioWest), 2 mM GlutaMAX, penicillin (100 U/mL), and streptomycin (100 μg/mL) (Gibco) in a humidified 5% CO2 atmosphere. Fifty microliters of sera collected from three treated Ctsa–/– mice (S1, S2, and S3) and 100 μL collected from a WT mouse were added in 1 mL fresh medium to the wells containing GS fibroblasts. After 60 h, the cells were rinsed extensively with PBS, collected, and lysed in H2O containing 0.5% Tween 20 (3×) and incubated on ice for 30 min, with mixing every 10 min by vortex. Both untreated WT and GS fibroblasts were used as controls. The CA and NEU1 activity assays were performed as described above. The fluorescence was measured (λex 355/λem 460), and the specific enzyme activities were calculated. NEU1 activities were calculated as nanomoles of substrate converted per milligram of protein per hour (nmol/mg/h), whereas the CA activities were calculated as picomoles of substrate converted per milligram of protein per minute (pmol/mg/min).
Sialic acid content assay
The total sialyl-oligosaccharide content in mouse urine was determined by the release of bound sialic acid using an EnzyChrom Sialic Acid Assay Kit (ESLA-100, Bioassay Systems, Hayward, CA, USA). Total sialic acid was measured following acid hydrolysis for 1 h at 80°C. After the addition of neutralization buffer, samples were set to cool at room temperature (RT) and incubated with an enzymatic master mix to utilize an enzyme-coupled reaction to oxidize any liberated sialic acid. A standard curve was generated from a 10 mM sialic acid stock solution that was serially diluted in ultra-pure water. The fluorescence was read at λex 535 nm and λem 595 nm. Results were interpolated to a standard curve and presented as micromolar (nmol/mL) sialic acid.
Immunohistochemical analyses
Six-micrometer-thick paraffin-embedded tissue sections were subjected to deparaffinization and antigen retrieval using pressure cooker methods, according to the manufacturer's instructions (Prestige Medical, Los Angeles, CA, USA). After being blocked with 0.1% bovine serum albumin and 0.5% Tween 20 in PBS, the sections were incubated overnight at RT with anti-hPPCA antibody (generated in-house). Sections were rinsed in PBS and subsequently incubated with biotinylated secondary goat anti-rabbit antibody (Jackson ImmunoResearch Laboratory, West Grove, PA, USA) for 1 h. Endogenous peroxidase was quenched by incubating the sections with 3% hydrogen peroxidase for 15 min. Antibody detection was performed using the ABC Kit (Vector Laboratories, Burlingame, CA, USA) and diaminobenzidine substrate (Invitrogen). Sections were counterstained with hematoxylin, according to the standard method. For histopathological examination, 6-μm-thick sections were stained with a standard H&E method and analyzed blindly. To measure the extent of vacuolation in sections from liver, spleen, and kidney, a macro was developed in ImageJ to analyze the total area occupied by vacuoles. A threshold for detection was set for each tissue and batched to all images using the same parameters. The total vacuolation area was normalized to that measured in WT samples.
Clinical chemistry and complete blood count panels
Whole blood samples (∼250 μL) were collected at different time points from WT, untreated, and treated Ctsa–/– mice in tubes containing 15 μL EDTA. Clinical chemistry and CBC panels were performed by the Veterinary Pathology Core of St Jude Children's Research Hospital.
Detection of antibodies against AAV2/8 capsid and human PPCA transgene product
Antibody levels were tested in the sera of WT, untreated, and treated Ctsa–/– mice via an enzyme-linked immunosorbent assay (ELISA). Serum was used for the ELISA. Briefly, either disrupted scAAV2/8-CTSA virus or purified PPCA protein was diluted to 1 μg/mL in DPBS at 50 μL per well in a Nunc MaxiSorp ELISA plate. When purified virus was used, virus concentration was estimated using bicinchoninic acid (BCA) assay prior to disruption. The virus stock was incubated in disruption buffer containing 5 mM Tris (pH 7.8), 60 mM KCl, and 0.05% Triton X-100 for 15 min at RT. Virus was then diluted in DPBS to 1 μg/mL. A human-specific PPCA antibody was used as positive control for the ELISA against PPCA. Plates were incubated at 4°C overnight to allow the protein/virus to bind. Following incubation, the plates were washed twice with DPBS/0.05% Tween 20 (washing buffer) and blocked with 10% FBS in DPBS (blocking buffer) for 30 min at RT. Plates were washed twice with washing buffer, and diluted samples in triplicate were placed in the wells for 2 h. Plates were then washed twice with washing buffer, and goat anti-mouse immunoglobulin G-horseradish peroxidase (IgG-HRP) (Southern Biotechnology, Birmingham, AL, USA) was used as a secondary antibody diluted 1:5,000 in blocking buffer. Plates were incubated for 1 h at RT and washed three times with washing buffer, and TMB 2-Component Microwell Peroxidase Substrate (SeraCare Life Sciences, Gaithersburg, MD, USA) was added to each well. Plates were allowed to develop for 15 min, and the reaction was stopped by adding an equal volume of 1 M phosphoric acid. Plates were then read in a Molecular Devices Spectramax M5 at an OD of 450. Triplicates were averaged and plotted.
Interferon-γ ELISpot
The ELISpot 96-well plate was washed four times with sterile PBS (200 μL/well). The plate was then conditioned with culture medium (DMEM supplemented with 10% FBS, 1× Pen-Strep, and 1× GlutaMAX) (200 μL/well) and incubated at RT for 30 min. Splenocytes were then resuspended into 1-mL aliquots, each containing 1.5 × 10⁶ cells. These aliquots were spun down in a microcentrifuge at 1,500 rpm for 5 min followed by resuspension in 600 μL of medium containing: (1) 100 MOI of scAAV2/8-CTSA with a titer of 4.0 × 10¹² gc/mL, (2) 100 MOI of empty AAV capsid with a titer of 2.5 × 10¹³ gc/mL, or (3) 40.5 nM PMA plus 670 nM ionomycin or (4) medium only. Conditioning medium was removed from the plate and replaced with 200 μL/well of stimulus medium, containing 500,000 cells. Each sample was plated in triplicate, and the plate was incubated at 37°C with 5% CO2 for 48 h. Following incubation, cells were collected for downstream flow cytometry analyses, and the plate was washed five times with PBS (200 μL/well). The detection antibody was diluted to 1 μg/mL in PBS, containing 0.5% fetal calf serum (PBS-0.5% FCS) and added at 100 μL/well to the plate. The plate was then incubated for 2 h at RT. After washing, the plate was incubated for 1 h at RT with streptavidin-ALP diluted 1:1,000 in PBS-0.5% FCS. Ready-to-use substrate solution (BCIP/NBT-plus) - was added to each well. The plate was developed until distinct spots emerged (about 10 min). Spots were counted using the Molecular Devices Spectramax M5 plate reader.
Flow cytometry analyses
Splenocytes collected at the end of incubation for the ELISpot analyses were transferred to a new 96-well plate. Cells were spun at 1,500 rpm for 5 min at RT, re-suspended, and washed in florescence-activated cell sorting (FACS) buffer (10% FBS and 2 mM EDTA in PBS). Cells were then blocked in 100 μL FACS buffer containing anti-CD16/CD32 antibodies, which are directed against Fc receptors, for 10 min at RT. After incubation, 100 μL FACS buffer was added to each well, and the cells were spun at 1,500 rpm for 5 min at RT. Cells were then washed twice in 200 μL FACS buffer and spun at 1,500 rpm for 5 min at RT after each wash. Following the washing steps, cells were incubated in 100 μL FACS buffer containing anti-CD3e-PE, anti-CD4-FITC, anti-CD8-BV605, and anti-CD19-APC for 20 min at RT, in the dark. Following antibody staining, 100 μL FACS buffer was added to each well, and the cells were spun at 1,500 rpm for 5 min at RT. After the last wash, cells were resuspended in FACS buffer containing DAPI and run on a flow cytometer. Data collected by flow cytometry were imported into FlowJo software and analyzed for the total percentage of CD4pos and CD8pos T cells.
Statistics
The data are presented as mean ±SD. Statistical p values of <0.05 were considered significant. Statistical analyses were performed using the Brown-Forsythe test (Figures 2, 3, 8, and S1) with GraphPad Prism, considering that the number of animals was n < 6 and that there was an unequal variance among the groups.
Statistics shown in Figure S4 were calculated by the Biostatistics Department at St Jude Children's Research Hospital using pairwise comparisons.
Groups were compared as follows:
Figure 2: To assess the efficacy of the treatment, statistical analyses were performed comparing the treatment groups with the untreated Ctsa–/–.
Figure 3: Statistical analyses were performed comparing WT with Ctsa–/–, WT with scAAV2/8-CTSA, and Ctsa–/– with scAAV2/8-CTSA groups at each time point.
Figure 8A and 8B: Statistical analyses were performed comparing WT with Ctsa–/–, WT with scAAV2/8-CTSA, and Ctsa–/– with scAAV2/8-CTSA groups at each time point.
Figures 8C–8E: Statistical analyses were performed comparing WT with Ctsa–/–, WT with scAAV2/8-CTSA, and Ctsa–/– with scAAV2/8-CTSA groups after re-exposure of the splenocyte cultures to the different agents (medium only, PMA, AAV-empty, and scAAV2/8-CTSA).
Figure S1: To assess the extent of enzyme correction, statistical analyses were performed comparing the treatment groups with WT controls.
Figure S4: The difference in mean vacuolization between WT, Ctsa–/–, and scAAV2/8-CTSA groups was examined using linear mixed effects to handle the correlation derived from the repeated measurements (n = 10 per mouse) on the same individual mice with a random effect for the mice. Considering there was an overall difference in mean vacuolization, and there was a significant association between vacuolization and the tested groups, we conducted pairwise comparisons among the groups. The results are summarized in two tables shown in the figure.
Acknowledgments
We thank Richard Ashmun and the staff of the Flow Cytometry and Cell Sorting Shared Resource for their help with FACS analyses and the staff of the Veterinary Pathology Core at St Jude Children's Research Hospital for performing the clinical chemistry and differential blood count analyses, respectively. We are grateful to Aaron Taylor of the Light Microscopy Division of the Cell and Tissue Imaging Center for his help with the quantification of the correction of tissue morphology and to Mia Panlilio and Khaled Khairy of the Center for Bioinformatics for their support in generating the quantification pipeline. We are indebted to Huiyun Wu and Kumar Srivastava of the Department of Biostatistics for performing statistical tests and biostatistics support. A.d.A. holds the Jewelers for Children Endowed Chair in Genetics and Gene Therapy. This work was funded by NIH grants GM104981 and DK095169, Ultragenyx Pharmaceuticals, the Assisi Foundation of Memphis, and the American Lebanese Syrian Associated Charities (ALSAC).
Author contributions
A.d.A. conceived and designed the study. H.H. coordinated the study and performed immunohistochemistry analyses and the sialic acid content analyses. R.M. performed uptake experiments and enzymatic activities assays. E.G. performed AAV injections and maintained the animal colony. D.v.d.V. assembled the figures and graphical abstract and performed statistical analyses. Y.C. performed the biodistribution analyses. L.E.F. examined the humoral and cellular immune responses. S.A.B. performed the ELISAs against the virus and the transgene. J.A.W. helped with the acquisition and assembly of the immunohistochemistry panels and quantification of tissue morphology. X.Q. purified the anti-PPCA antibody. H.H., I.A., and A.d.A. wrote the manuscript, with input from all the authors. I.A. and A.d.A. reviewed and edited the manuscript. All authors have read and agreed to the published version of the manuscript.
Declaration of interests
The authors declare no competing interests.
Footnotes
Supplemental information can be found online at https://doi.org/10.1016/j.omtm.2021.10.007.
Contributor Information
Ida Annunziata, Email: ida.annunziata@stjude.org.
Alessandra d’Azzo, Email: sandra.dazzo@stjude.org.
Supplemental information
References
- 1.Bonten E.J., Annunziata I., d'Azzo A. Lysosomal multienzyme complex: pros and cons of working together. Cell Mol. Life Sci. 2014;71:2017–2032. doi: 10.1007/s00018-013-1538-3. [DOI] [PMC free article] [PubMed] [Google Scholar]
- 2.d'Azzo A., Andria G., Bonten E., Annunziata I. In: The Metabolic and Molecular Bases of Inherited Disease. Scriver C., Beaudet A., Sly W., Valle D., editors. McGraw-Hill Publishing Co.; 2013. Galactosialidosis, 8th edition; pp. 3811–3826. [Google Scholar]
- 3.Annunziata I., d'Azzo A. Galactosialidosis: historic aspects and overview of investigated and emerging treatment options. Expert Opin. Orphan Drugs. 2017;5:131–141. doi: 10.1080/21678707.2016.1266933. [DOI] [PMC free article] [PubMed] [Google Scholar]
- 4.d'Azzo A., Machado E., Annunziata I. Pathogenesis, emerging therapeutic targets and treatment in sialidosis. Expert Opin. Orphan Drugs. 2015;3:491–504. doi: 10.1517/21678707.2015.1025746. [DOI] [PMC free article] [PubMed] [Google Scholar]
- 5.Zhou X.Y., Morreau H., Rottier R., Davis D., Bonten E., Gillemans N., Wenger D., Grosveld F.G., Doherty P., Suzuki K., et al. Mouse model for the lysosomal disorder galactosialidosis and correction of the phenotype with over-expressing erythroid precursor cells. Genes Dev. 1995;9:2623–2634. doi: 10.1101/gad.9.21.2623. [DOI] [PubMed] [Google Scholar]
- 6.de Geest N., Bonten E., Mann L., de Sousa-Hitzler J., Hahn C., d'Azzo A. Systemic and neurologic abnormalities distinguish the lysosomal disorders sialidosis and galactosialidosis in mice. Hum. Mol. Genet. 2002;11:1455–1464. doi: 10.1093/hmg/11.12.1455. [DOI] [PubMed] [Google Scholar]
- 7.Hu H., Gomero E., Bonten E., Gray J.T., Allay J., Wu Y., Wu J., Calabrese C., Nienhuis A., d'Azzo A. Preclinical dose-finding study with a liver-tropic, recombinant AAV-2/8 vector in the mouse model of galactosialidosis. Mol. Ther. 2012;20:267–274. doi: 10.1038/mt.2011.227. [DOI] [PMC free article] [PubMed] [Google Scholar]
- 8.Leimig T., Mann L., Martin Mdel P., Bonten E., Persons D., Knowles J., Allay J.A., Cunningham J., Nienhuis A.W., Smeyne R., et al. Functional amelioration of murine galactosialidosis by genetically modified bone marrow hematopoietic progenitor cells. Blood. 2002;99:3169–3178. doi: 10.1182/blood.v99.9.3169. [DOI] [PubMed] [Google Scholar]
- 9.Hahn C.N., del Pilar Martin M., Zhou X.Y., Mann L.W., d'Azzo A. Correction of murine galactosialidosis by bone marrow-derived macrophages overexpressing human protective protein/cathepsin A under control of the colony-stimulating factor-1 receptor promoter. Proc. Natl. Acad. Sci. U S A. 1998;95:14880–14885. doi: 10.1073/pnas.95.25.14880. [DOI] [PMC free article] [PubMed] [Google Scholar]
- 10.Penati R., Fumagalli F., Calbi V., Bernardo M.E., Aiuti A. Gene therapy for lysosomal storage disorders: recent advances for metachromatic leukodystrophy and mucopolysaccaridosis I. J. Inherit. Metab. Dis. 2017;40:543–554. doi: 10.1007/s10545-017-0052-4. [DOI] [PMC free article] [PubMed] [Google Scholar]
- 11.Rastall D.P., Amalfitano A. Recent advances in gene therapy for lysosomal storage disorders. Appl. Clin. Genet. 2015;8:157–169. doi: 10.2147/TACG.S57682. [DOI] [PMC free article] [PubMed] [Google Scholar]
- 12.de Jong Y.P., Herzog R.W. Liver gene therapy and hepatocellular carcinoma: a complex web. Mol. Ther. 2021;29:1353–1354. doi: 10.1016/j.ymthe.2021.03.009. [DOI] [PMC free article] [PubMed] [Google Scholar]
- 13.Shirley J.L., de Jong Y.P., Terhorst C., Herzog R.W. Immune responses to viral gene therapy vectors. Mol. Ther. 2020;28:709–722. doi: 10.1016/j.ymthe.2020.01.001. [DOI] [PMC free article] [PubMed] [Google Scholar]
- 14.Mingozzi F., High K.A. Immune responses to AAV vectors: overcoming barriers to successful gene therapy. Blood. 2013;122:23–36. doi: 10.1182/blood-2013-01-306647. [DOI] [PMC free article] [PubMed] [Google Scholar]
- 15.Martino A.T., Markusic D.M. Immune response mechanisms against AAV vectors in animal models. Mol. Ther. Methods Clin. Dev. 2020;17:198–208. doi: 10.1016/j.omtm.2019.12.008. [DOI] [PMC free article] [PubMed] [Google Scholar]
- 16.Wu T., Topfer K., Lin S.W., Li H., Bian A., Zhou X.Y., High K.A., Ertl H.C. Self-complementary AAVs induce more potent transgene product-specific immune responses compared to a single-stranded genome. Mol. Ther. 2012;20:572–579. doi: 10.1038/mt.2011.280. [DOI] [PMC free article] [PubMed] [Google Scholar]
- 17.Yang F., Patton K., Kasprzyk T., Long B., Gupta S., Zoog S.J., Tracy K., Vettermann C. Validation of an IFN-gamma ELISpot assay to measure cellular immune responses against viral antigens in non-human primates. Gene Ther. 2021 doi: 10.1038/s41434-020-00214-w. [DOI] [PMC free article] [PubMed] [Google Scholar]
- 18.Colon-Thillet R., Jerome K.R., Stone D. Optimization of AAV vectors to target persistent viral reservoirs. Virol. J. 2021;18:85. doi: 10.1186/s12985-021-01555-7. [DOI] [PMC free article] [PubMed] [Google Scholar]
- 19.Rabinowitz J.E., Rolling F., Li C., Conrath H., Xiao W., Xiao X., Samulski R.J. Cross-packaging of a single adeno-associated virus (AAV) type 2 vector genome into multiple AAV serotypes enables transduction with broad specificity. J. Virol. 2002;76:791–801. doi: 10.1128/jvi.76.2.791-801.2002. [DOI] [PMC free article] [PubMed] [Google Scholar]
- 20.Kattenhorn L.M., Tipper C.H., Stoica L., Geraghty D.S., Wright T.L., Clark K.R., Wadsworth S.C. Adeno-associated virus gene therapy for liver disease. Hum. Gene Ther. 2016;27:947–961. doi: 10.1089/hum.2016.160. [DOI] [PMC free article] [PubMed] [Google Scholar]
- 21.Naso M.F., Tomkowicz B., Perry W.L., 3rd, Strohl W.R. Adeno-associated virus (AAV) as a vector for gene therapy. BioDrugs. 2017;31:317–334. doi: 10.1007/s40259-017-0234-5. [DOI] [PMC free article] [PubMed] [Google Scholar]
- 22.Platt F.M., d'Azzo A., Davidson B.L., Neufeld E.F., Tifft C.J. Lysosomal storage diseases. Nat. Rev. Dis. Primers. 2018;4:27. doi: 10.1038/s41572-018-0025-4. [DOI] [PubMed] [Google Scholar]
- 23.Nagree M.S., Scalia S., McKillop W.M., Medin J.A. An update on gene therapy for lysosomal storage disorders. Expert Opin. Biol. Ther. 2019;19:655–670. doi: 10.1080/14712598.2019.1607837. [DOI] [PubMed] [Google Scholar]
- 24.Riviere C., Danos O., Douar A.M. Long-term expression and repeated administration of AAV type 1, 2 and 5 vectors in skeletal muscle of immunocompetent adult mice. Gene Ther. 2006;13:1300–1308. doi: 10.1038/sj.gt.3302766. [DOI] [PubMed] [Google Scholar]
- 25.Ferla R., Alliegro M., Dell'Anno M., Nusco E., Cullen J.M., Smith S.N., Wolfsberg T.G., O'Donnell P., Wang P., Nguyen A.D., et al. Low incidence of hepatocellular carcinoma in mice and cats treated with systemic adeno-associated viral vectors. Mol. Ther. Methods Clin. Dev. 2021;20:247–257. doi: 10.1016/j.omtm.2020.11.015. [DOI] [PMC free article] [PubMed] [Google Scholar]
- 26.Takahashi H., Hirai Y., Migita M., Seino Y., Fukuda Y., Sakuraba H., Kase R., Kobayashi T., Hashimoto Y., Shimada T. Long-term systemic therapy of Fabry disease in a knockout mouse by adeno-associated virus-mediated muscle-directed gene transfer. Proc. Natl. Acad. Sci. U S A. 2002;99:13777–13782. doi: 10.1073/pnas.222221899. [DOI] [PMC free article] [PubMed] [Google Scholar]
- 27.Franco L.M., Sun B., Yang X., Bird A., Zhang H., Schneider A., Brown T., Young S.P., Clay T.M., Amalfitano A., et al. Evasion of immune responses to introduced human acid alpha-glucosidase by liver-restricted expression in glycogen storage disease type II. Mol. Ther. 2005;12:876–884. doi: 10.1016/j.ymthe.2005.04.024. [DOI] [PubMed] [Google Scholar]
- 28.Murphy S.L., Li H., Zhou S., Schlachterman A., High K.A. Prolonged susceptibility to antibody-mediated neutralization for adeno-associated vectors targeted to the liver. Mol. Ther. 2008;16:138–145. doi: 10.1038/sj.mt.6300334. [DOI] [PubMed] [Google Scholar]
- 29.Cresawn K.O., Fraites T.J., Wasserfall C., Atkinson M., Lewis M., Porvasnik S., Liu C., Mah C., Byrne B.J. Impact of humoral immune response on distribution and efficacy of recombinant adeno-associated virus-derived acid alpha-glucosidase in a model of glycogen storage disease type II. Hum. Gene Ther. 2005;16:68–80. doi: 10.1089/hum.2005.16.68. [DOI] [PubMed] [Google Scholar]
- 30.Nienhuis A.W., Nathwani A.C., Davidoff A.M. Gene therapy for hemophilia. Hum. Gene Ther. 2016;27:305–308. doi: 10.1089/hum.2016.018. [DOI] [PubMed] [Google Scholar]
- 31.Nathwani A.C., Reiss U.M., Tuddenham E.G., Rosales C., Chowdary P., McIntosh J., Della Peruta M., Lheriteau E., Patel N., Raj D., et al. Long-term safety and efficacy of factor IX gene therapy in hemophilia B. N. Engl. J. Med. 2014;371:1994–2004. doi: 10.1056/NEJMoa1407309. [DOI] [PMC free article] [PubMed] [Google Scholar]
- 32.Hinderer C., Katz N., Buza E.L., Dyer C., Goode T., Bell P., Richman L.K., Wilson J.M. Severe toxicity in nonhuman primates and piglets following high-dose intravenous administration of an adeno-associated virus vector expressing human SMN. Hum. Gene Ther. 2018;29:285–298. doi: 10.1089/hum.2018.015. [DOI] [PMC free article] [PubMed] [Google Scholar]
- 33.Flotte T.R., Buning H. Severe toxicity in nonhuman primates and piglets with systemic high-dose administration of adeno-associated virus serotype 9-like vectors: Putting patients first. Hum. Gene Ther. 2018;29:283–284. doi: 10.1089/hum.2018.021. [DOI] [PubMed] [Google Scholar]
- 34.Han Z., Zhong L., Maina N., Hu Z., Li X., Chouthai N.S., Bischof D., Weigel-Van Aken K.A., Slayton W.B., Yoder M.C., et al. Stable integration of recombinant adeno-associated virus vector genomes after transduction of murine hematopoietic stem cells. Hum. Gene Ther. 2008;19:267–278. doi: 10.1089/hum.2007.161. [DOI] [PubMed] [Google Scholar]
- 35.Inagaki K., Piao C., Kotchey N.M., Wu X., Nakai H. Frequency and spectrum of genomic integration of recombinant adeno-associated virus serotype 8 vector in neonatal mouse liver. J. Virol. 2008;82:9513–9524. doi: 10.1128/JVI.01001-08. [DOI] [PMC free article] [PubMed] [Google Scholar]
- 36.Smith R.H. Adeno-associated virus integration: virus versus vector. Gene Ther. 2008;15:817–822. doi: 10.1038/gt.2008.55. [DOI] [PubMed] [Google Scholar]
- 37.Deyle D.R., Russell D.W. Adeno-associated virus vector integration. Curr. Opin. Mol. Ther. 2009;11:442–447. [PMC free article] [PubMed] [Google Scholar]
- 38.Colella P., Ronzitti G., Mingozzi F. Emerging issues in AAV-mediated in vivo gene therapy. Mol. Ther. Methods Clin. Dev. 2018;8:87–104. doi: 10.1016/j.omtm.2017.11.007. [DOI] [PMC free article] [PubMed] [Google Scholar]
- 39.Nguyen G.N., Everett J.K., Kafle S., Roche A.M., Raymond H.E., Leiby J., Wood C., Assenmacher C.A., Merricks E.P., Long C.T., et al. A long-term study of AAV gene therapy in dogs with hemophilia A identifies clonal expansions of transduced liver cells. Nat. Biotechnol. 2021;39:47–55. doi: 10.1038/s41587-020-0741-7. [DOI] [PMC free article] [PubMed] [Google Scholar]
- 40.Li Y., Miller C.A., Shea L.K., Jiang X., Guzman M.A., Chandler R.J., Ramakrishnan S.M., Smith S.N., Venditti C.P., Vogler C.A., et al. Enhanced efficacy and increased long-term toxicity of CNS-directed, AAV-based combination therapy for Krabbe disease. Mol. Ther. 2021;29:691–701. doi: 10.1016/j.ymthe.2020.12.031. [DOI] [PMC free article] [PubMed] [Google Scholar]
- 41.Dalwadi D.A., Torrens L., Abril-Fornaguera J., Pinyol R., Willoughby C., Posey J., Llovet J.M., Lanciault C., Russell D.W., Grompe M., et al. Liver injury increases the incidence of HCC following AAV gene therapy in mice. Mol. Ther. 2021;29:680–690. doi: 10.1016/j.ymthe.2020.10.018. [DOI] [PMC free article] [PubMed] [Google Scholar]
- 42.Arruda V.R., Doshi B.S. Gene therapy for hemophilia: Facts and Quandaries in the 21st century. Mediterr. J. Hematol. Infect Dis. 2020;12:e2020069. doi: 10.4084/MJHID.2020.069. [DOI] [PMC free article] [PubMed] [Google Scholar]
- 43.Russell W.M.S., Burch R.L. 1959. The Principles of Humane Experimental Technique. [Google Scholar]
- 44.Allay J.A., Sleep S., Long S., Tillman D.M., Clark R., Carney G., Fagone P., McIntosh J.H., Nienhuis A.W., Davidoff A.M., et al. Good manufacturing practice production of self-complementary serotype 8 adeno-associated viral vector for a hemophilia B clinical trial. Hum. Gene Ther. 2011;22:595–604. doi: 10.1089/hum.2010.202. [DOI] [PMC free article] [PubMed] [Google Scholar]
Associated Data
This section collects any data citations, data availability statements, or supplementary materials included in this article.