Abstract
Background:
Background parenchymal uptake (BPU) on molecular breast imaging (MBI) was identified as a breast cancer risk factor beyond mammographic density in a case-control study, but has not been confirmed in a cohort study.
Objective:
To examine association of BPU with breast cancer, and to estimate absolute risk and discriminatory accuracy of BPU using a cohort study.
Methods:
A retrospective cohort of women having MBI from 2004–2015, without prior breast cancer, was established. Radiologists, blinded to future breast cancer diagnoses, assessed BPU at baseline MBI as low (photopenic or minimal) or elevated (mild, moderate, or marked). Associations of BPU with breast cancer were estimated with multivariable Cox proportional hazards models of time to diagnosis. Five-year absolute risk was calculated for study subgroups. Discriminatory accuracy of BPU was assessed.
Results:
Among 2992 women with mean age 56.3 years (sd 10.6) at MBI, breast cancer events occurred in 144 over 7.3 years median follow-up. Median time to diagnosis was 4.2 years (range 0.5–11.6 years) after MBI. Elevated BPU was associated with greater breast cancer risk (HR=2.39 [1.68, 3.41]; p=<0.001). This association remained in postmenopausal women (HR=3.50 [2.31, 5.31; p<0.001]) but was not significant in premenopausal women (HR=1.29 [0.72, 2.32]; p=0.39). Women with elevated BPU had five-year absolute risk of 4.3% (2.9, 5.7) vs. 2.5% (1.8, 3.1) for those with low BPU. Postmenopausal women with dense breasts and elevated BPU had five-year absolute risk of 8.1% (4.3, 11.8) vs. 2.8% (1.8, 3.8) for those with low BPU. Among postmenopausal women, discriminatory accuracy for invasive cancer was improved with addition of BPU over Gail risk score alone (C-statistic 65.1 vs. 59.1; p=0.04) and over BCSC risk score alone (66.4 vs. 60.4; p=0.04).
Conclusion:
BPU on MBI is an independent breast cancer risk factor, with the strongest association observed among postmenopausal women with dense breasts. In postmenopausal women, BPU provides incremental discrimination in breast cancer risk prediction when combined with the Gail model or BCSC model.
Clinical Impact:
Elevated BPU on MBI may identify a subset of women with dense breasts who would benefit most from supplemental screening or preventive options.
Introduction
Breast density inform legislation in 38 U.S. states and pending federally-mandated language to be included in breast density notification letters nationwide have fueled discussions about density’s clinical implications, namely masking of breast cancer from mammographic detection and also higher risk of breast cancer [1]. But, dense breasts are common, with over 40% of U.S. women presenting for screening having heterogeneously or extremely dense breasts [2], and incorporation of density assessment in risk models only modestly improves discriminatory accuracy [3]. Additional tools are needed to identify which women with dense breasts are at greatest risk and most likely to benefit from tailored screening or risk-reducing prevention options.
Functional imaging techniques of breast MRI and molecular breast imaging (MBI) have both been shown to improve cancer detection in dense breasts over mammographic screening [4–6] and may also provide risk information. On MRI, the level of gadolinium contrast enhancement within fibroglandular tissue, termed background parenchymal enhancement (BPE), has been associated with both prevalent and incident breast cancer, and was independent of the amount of breast fibroglandular tissue [7–10]. In a similar fashion, background parenchymal uptake (BPU) on MBI describes the level of Tc-99m sestamibi uptake in fibroglandular tissue. A prior case-control study showed women with higher levels of BPU (defined as moderate or marked) had 3 to 5 times the odds of incident breast cancer compared to those with lower BPU [11, 12]. This association was independent of mammographic density and other risk factors such as exogenous hormone use.
Although a cohort study of BPE on MRI was recently performed [10], none have been conducted for BPU on MBI to date. Absolute risk of breast cancer by BPU category, which is important to enable translation of results to practice, has yet to be assessed. Further, BPU’s potential impact on discriminatory accuracy has not yet been evaluated. Thus, we established a retrospective cohort of women who have had MBI exams, including assessment of BPU and mammographic density, collection of risk factor information, and extended follow-up for breast cancer events. We hypothesized that absolute risk of breast cancer would differ by level of BPU and that the addition of BPU to breast cancer risk models would improve discriminatory accuracy. Here, our objectives were to examine association of BPU with breast cancer, and to estimate absolute risk and discriminatory accuracy of BPU using a cohort study.
Subjects and Methods
Study Cohort
This retrospective cohort study was HIPAA-compliant and approved by our institutional review board, which issued a waiver of consent. We identified all women in our clinical MBI registry with an exam between February 2004 and July 2015 (n=4595), allowing the opportunity for at least five years of follow-up. The baseline (earliest) MBI exam was used for analysis. We excluded women who declined general consent to use medical records for research (n=192), had missing images (n=28), or had <180 days of follow-up (n=304). Women with breast implants (n=114) were excluded as these complicate BPU interpretation. To study women at risk of future breast cancer, those diagnosed within 180 days after MBI (n=944) were excluded. Women taking preventive antiestrogen medications at the time of MBI (n=21) were also excluded. The final cohort comprised 2992 women, which included 241 women previously part of a case-control analysis of BPU [11, 12].
Breast cancer risk factor information, including family history, breast biopsy history, parity, hormonal exposure, and BRCA mutation status was obtained through questionnaires and medical records at the time of MBI. Menopause status was defined as follows: Women who self-reported natural menopause or surgical removal of both ovaries prior to MBI were classified as postmenopausal. Women reporting a menstrual period within 12 months before MBI were classified as premenopausal. Those who did not meet either of these criteria were classified as premenopausal if ≤55 years and postmenopausal if >55 years, as done in prior studies [13]. These risk factors were used to calculate five-year risk of invasive breast cancer with both the Gail model (which includes age, age at menarche, age at first live birth, breast biopsy history, first-degree family history of breast cancer and race/ethnicity), and the Breast Cancer Surveillance Consortium (BCSC) model (which includes age, breast biopsy history, first-degree family history of breast cancer, race/ethnicity, and BI-RADS breast density) [14, 15]. The BCSC risk model has previously been shown to offer the highest discriminatory accuracy of several common risk models (including Gail and Tyrer-Cuzick) for women in a screening setting with available breast density information [23].
Follow up for breast cancer was primarily performed through linkage to our institutional tumor registry. Secondly medical record review was performed to verify breast cancer cases or establish no breast cancer diagnosis and date of most recent mammogram or other breast imaging (e.g. MBI or MRI). Women who had not returned to our institution for breast imaging as of December 2017 (N=745) were mailed a survey to ascertain breast cancer status and date of most recent mammogram; 479 of 745 (64%) women responded to this survey and 5 breast cancers were identified and verified with medical records. For breast cancer cases, follow-up time was calculated as time from baseline MBI to earliest pathology-proven diagnosis of invasive cancer or ductal carcinoma in situ. For women with no breast cancer diagnosis, follow-up time was time from baseline MBI to the most recent breast imaging examination.
BPU and Density Interpretation
MBI examinations were performed with intravenous injection of Tc-99m sestamibi followed by immediate imaging with a dedicated dual-head cadmium zinc telluride MBI system (NM Discovery 750b, GE Healthcare or LumaGem, CMR Naviscan) as has been previously described [16]. MBI was routinely performed with 20 mCi Tc-99m sestamibi until modifications in July 2009 to improve system count sensitivity and allow a proportional reduction in administered activity to 4 to 8 mCi [17]. Bilateral craniocaudal and mediolateral oblique views were obtained.
MBI examinations were performed in both research volunteers and as part of our routine clinical practice, with common indications of supplemental screening of women with dense breasts, screening and diagnostic imaging of women in whom breast MRI is recommended but cannot be performed, and diagnostic problem solving of known lesions or clinical symptoms. The MBI protocol was identical for screening and diagnostic indications in both research and clinical subjects. For the purposes of this study, MBI indication was categorized as “screening” for women who were asymptomatic with no known breast lesions under evaluation; otherwise the indication was “diagnostic”.
BPU describes the relative intensity of radiotracer uptake in fibroglandular tissue to that in subcutaneous fat and has previously included four categories (photopenic, minimal-mild, moderate, marked) in an established lexicon [18]. For our registry, minimal and mild were interpreted separately in order to evaluate potential differences in risk between these categories. BPU categories were visually estimated according to the following definitions (Fig. 1): 1) photopenic, fibroglandular uptake is less intense than fat uptake; 2) minimal, fibroglandular and fat uptake are equal intensity; 3) mild, fibroglandular uptake is just noticeably more intense than fat uptake; 4) moderate, fibroglandular uptake is more intense than mild but less than twice as intense as fat; 5) marked, fibroglandular uptake is at least twice as intense as fat.
Fig. 1 –
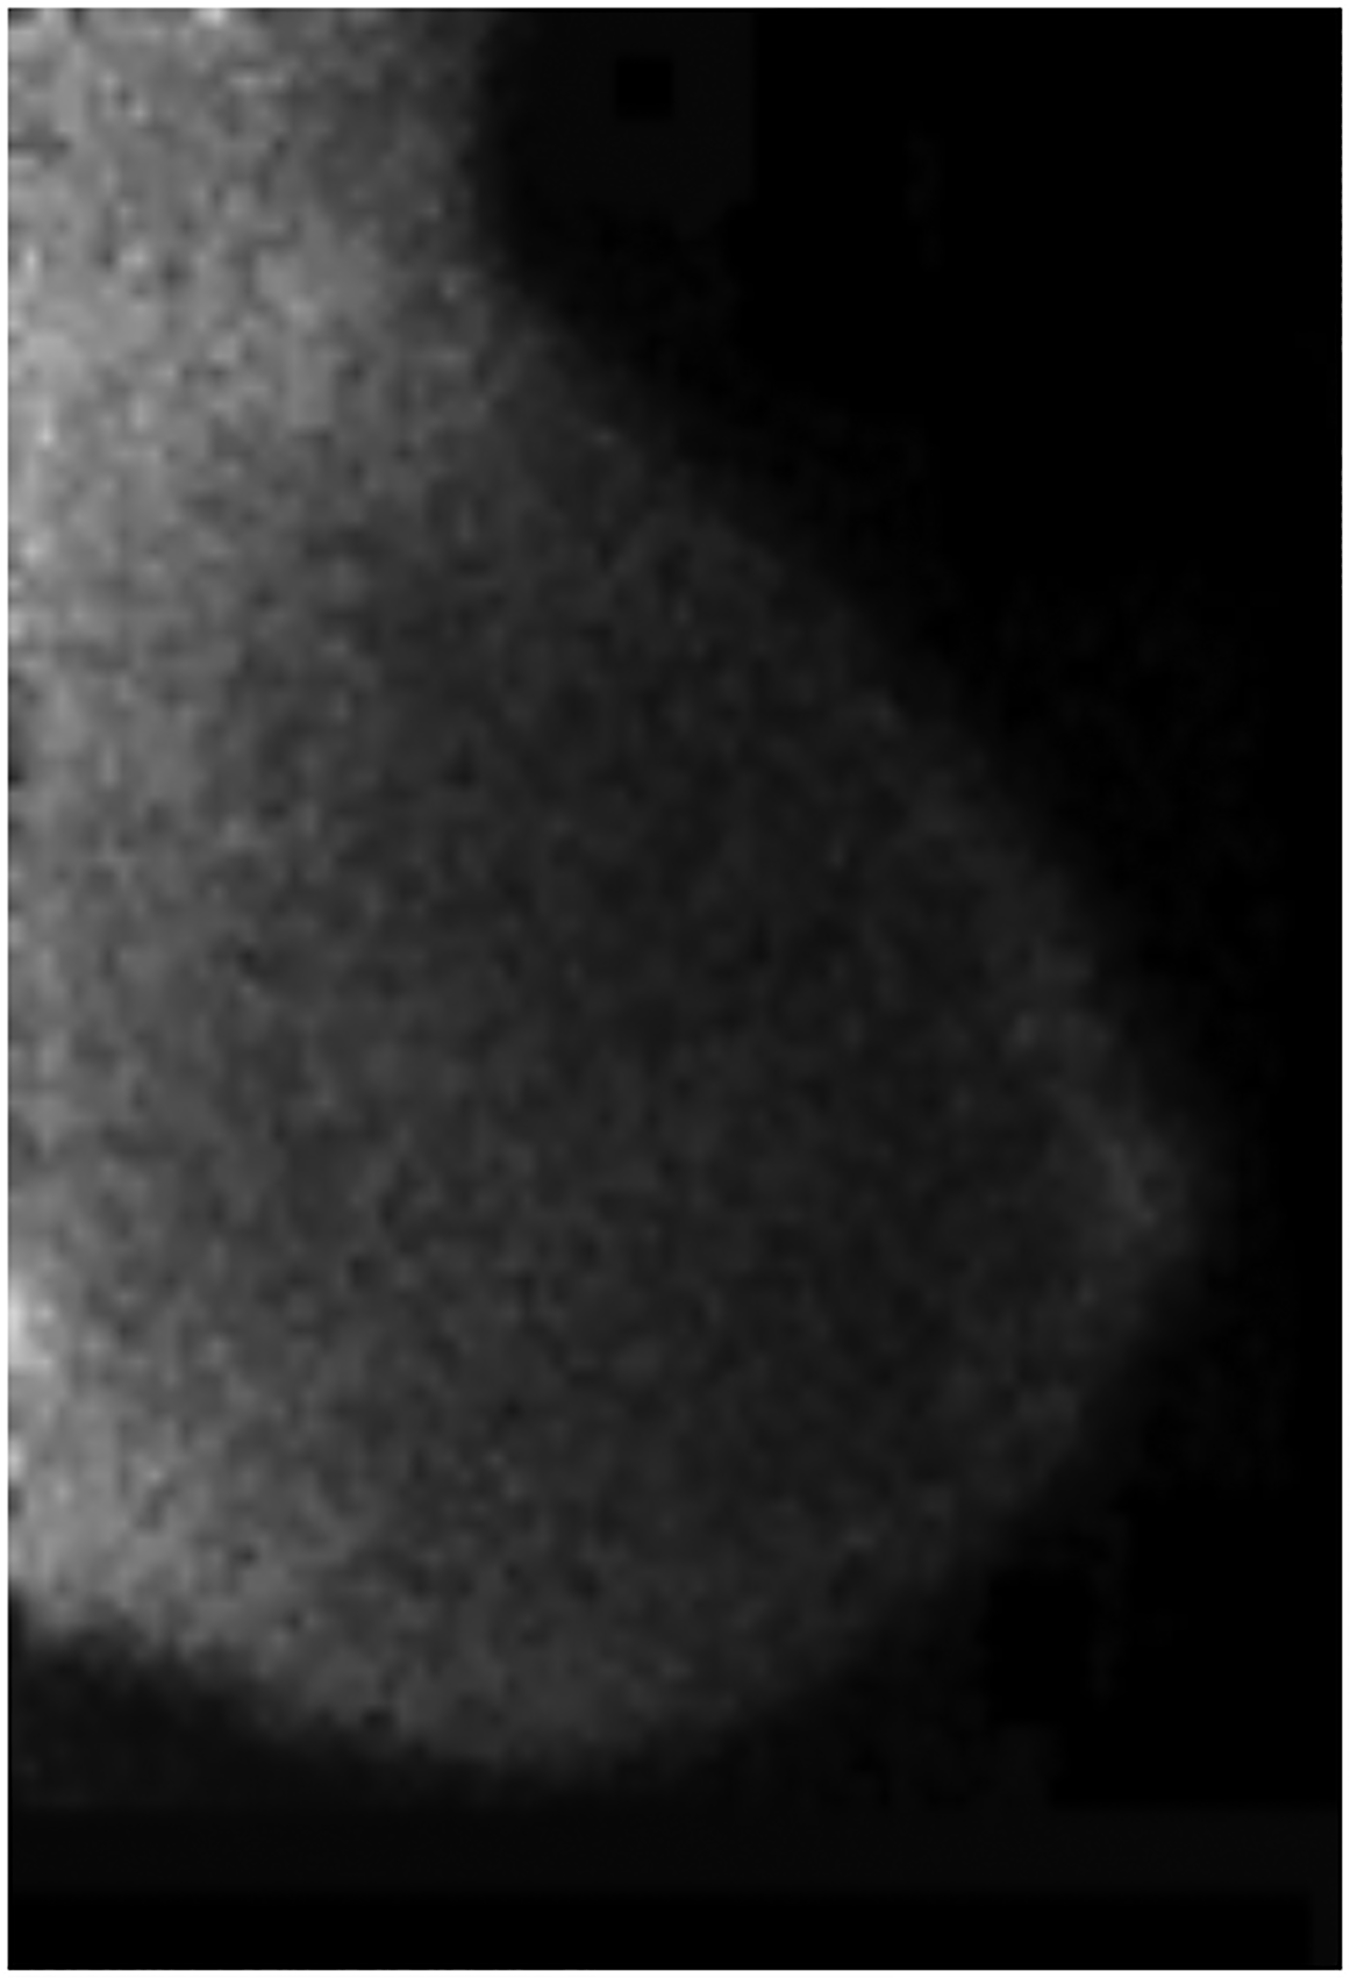
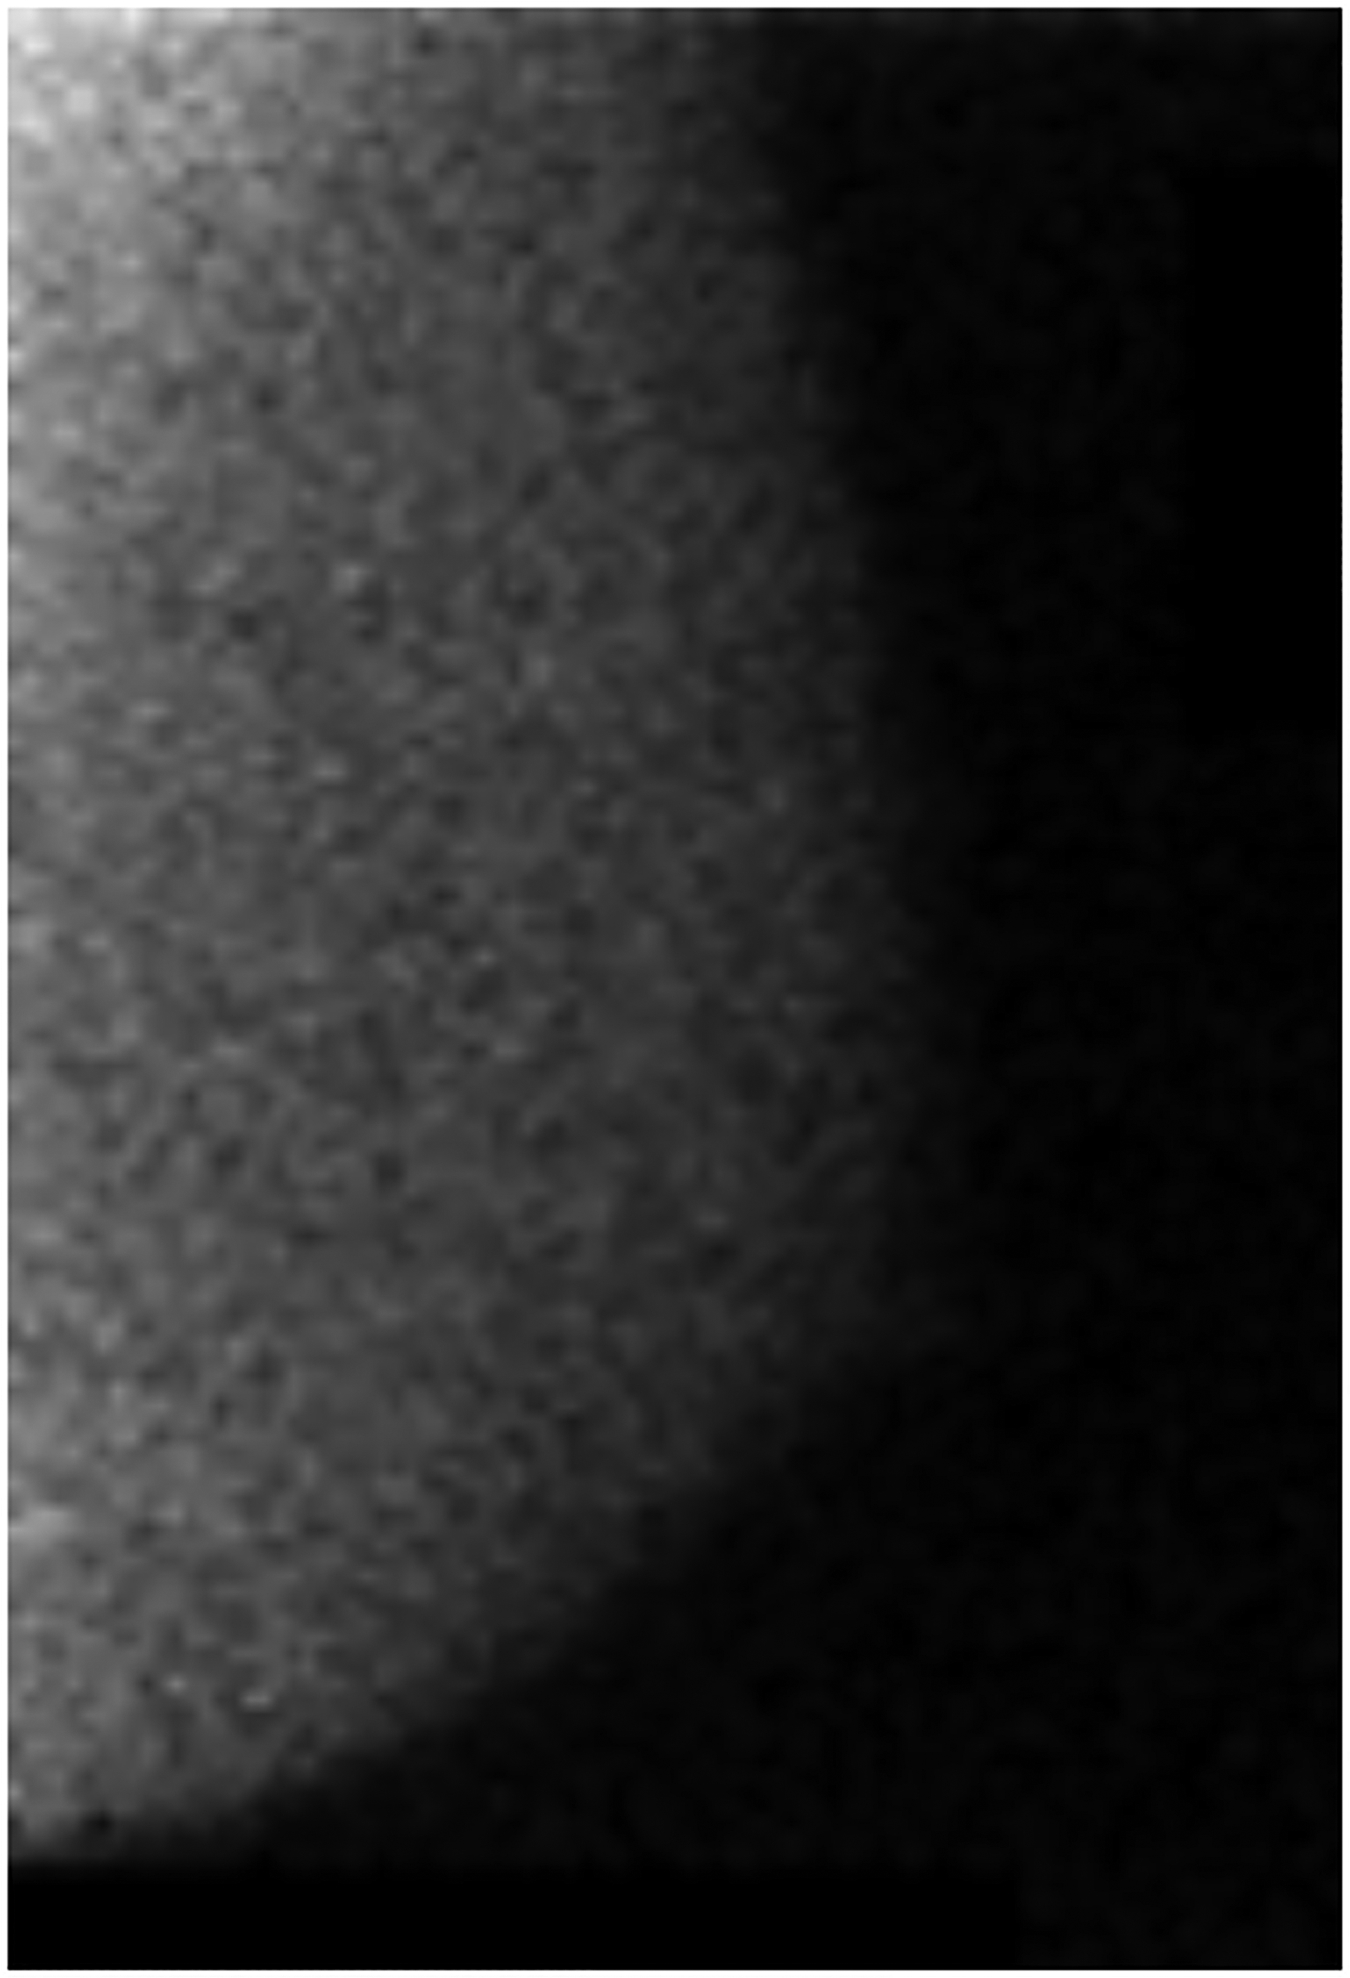
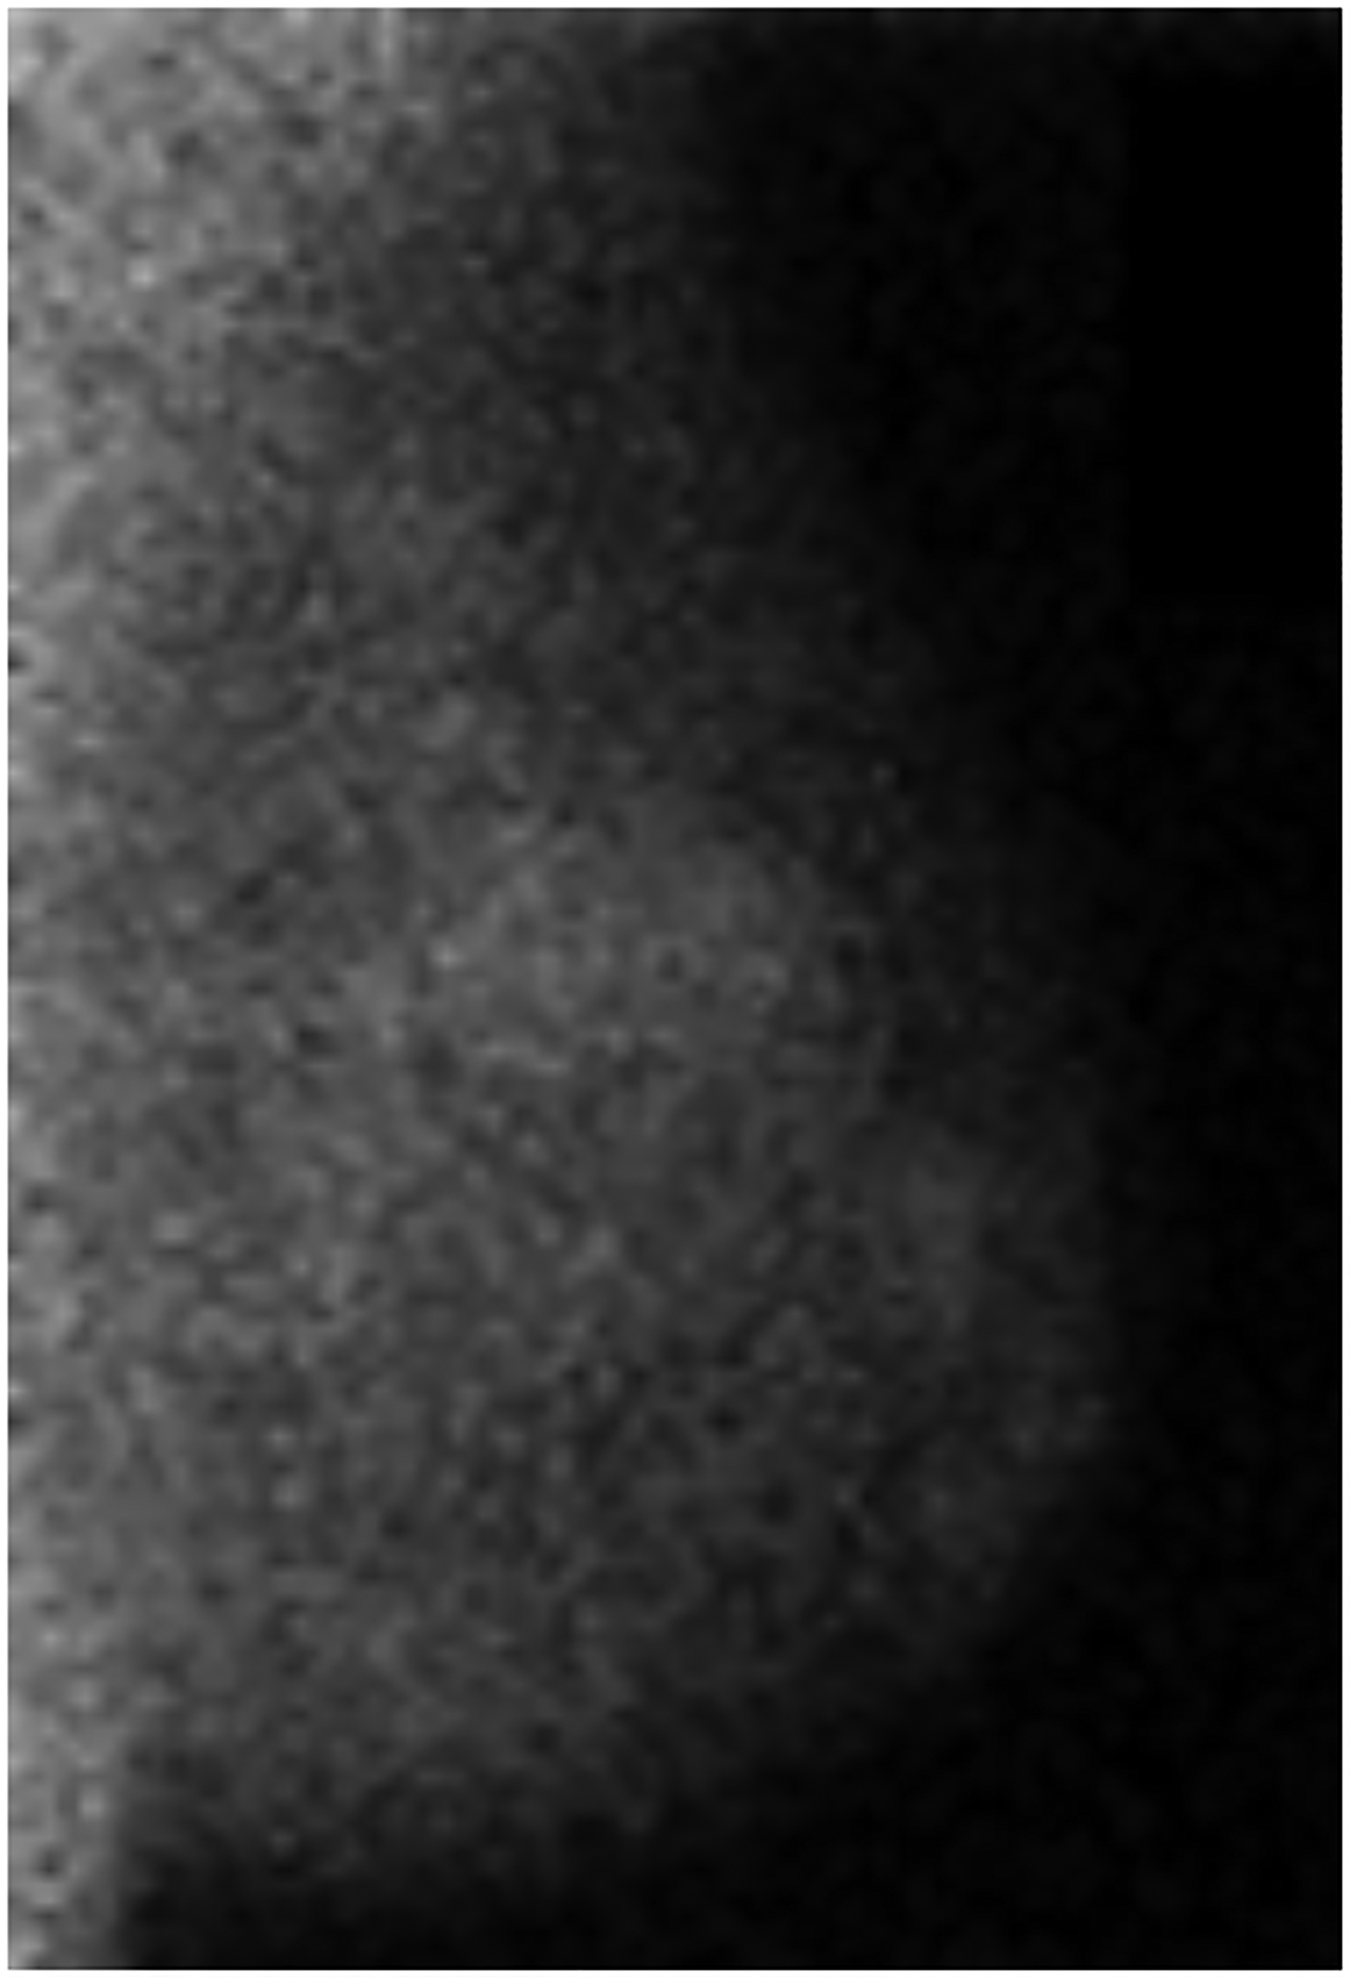
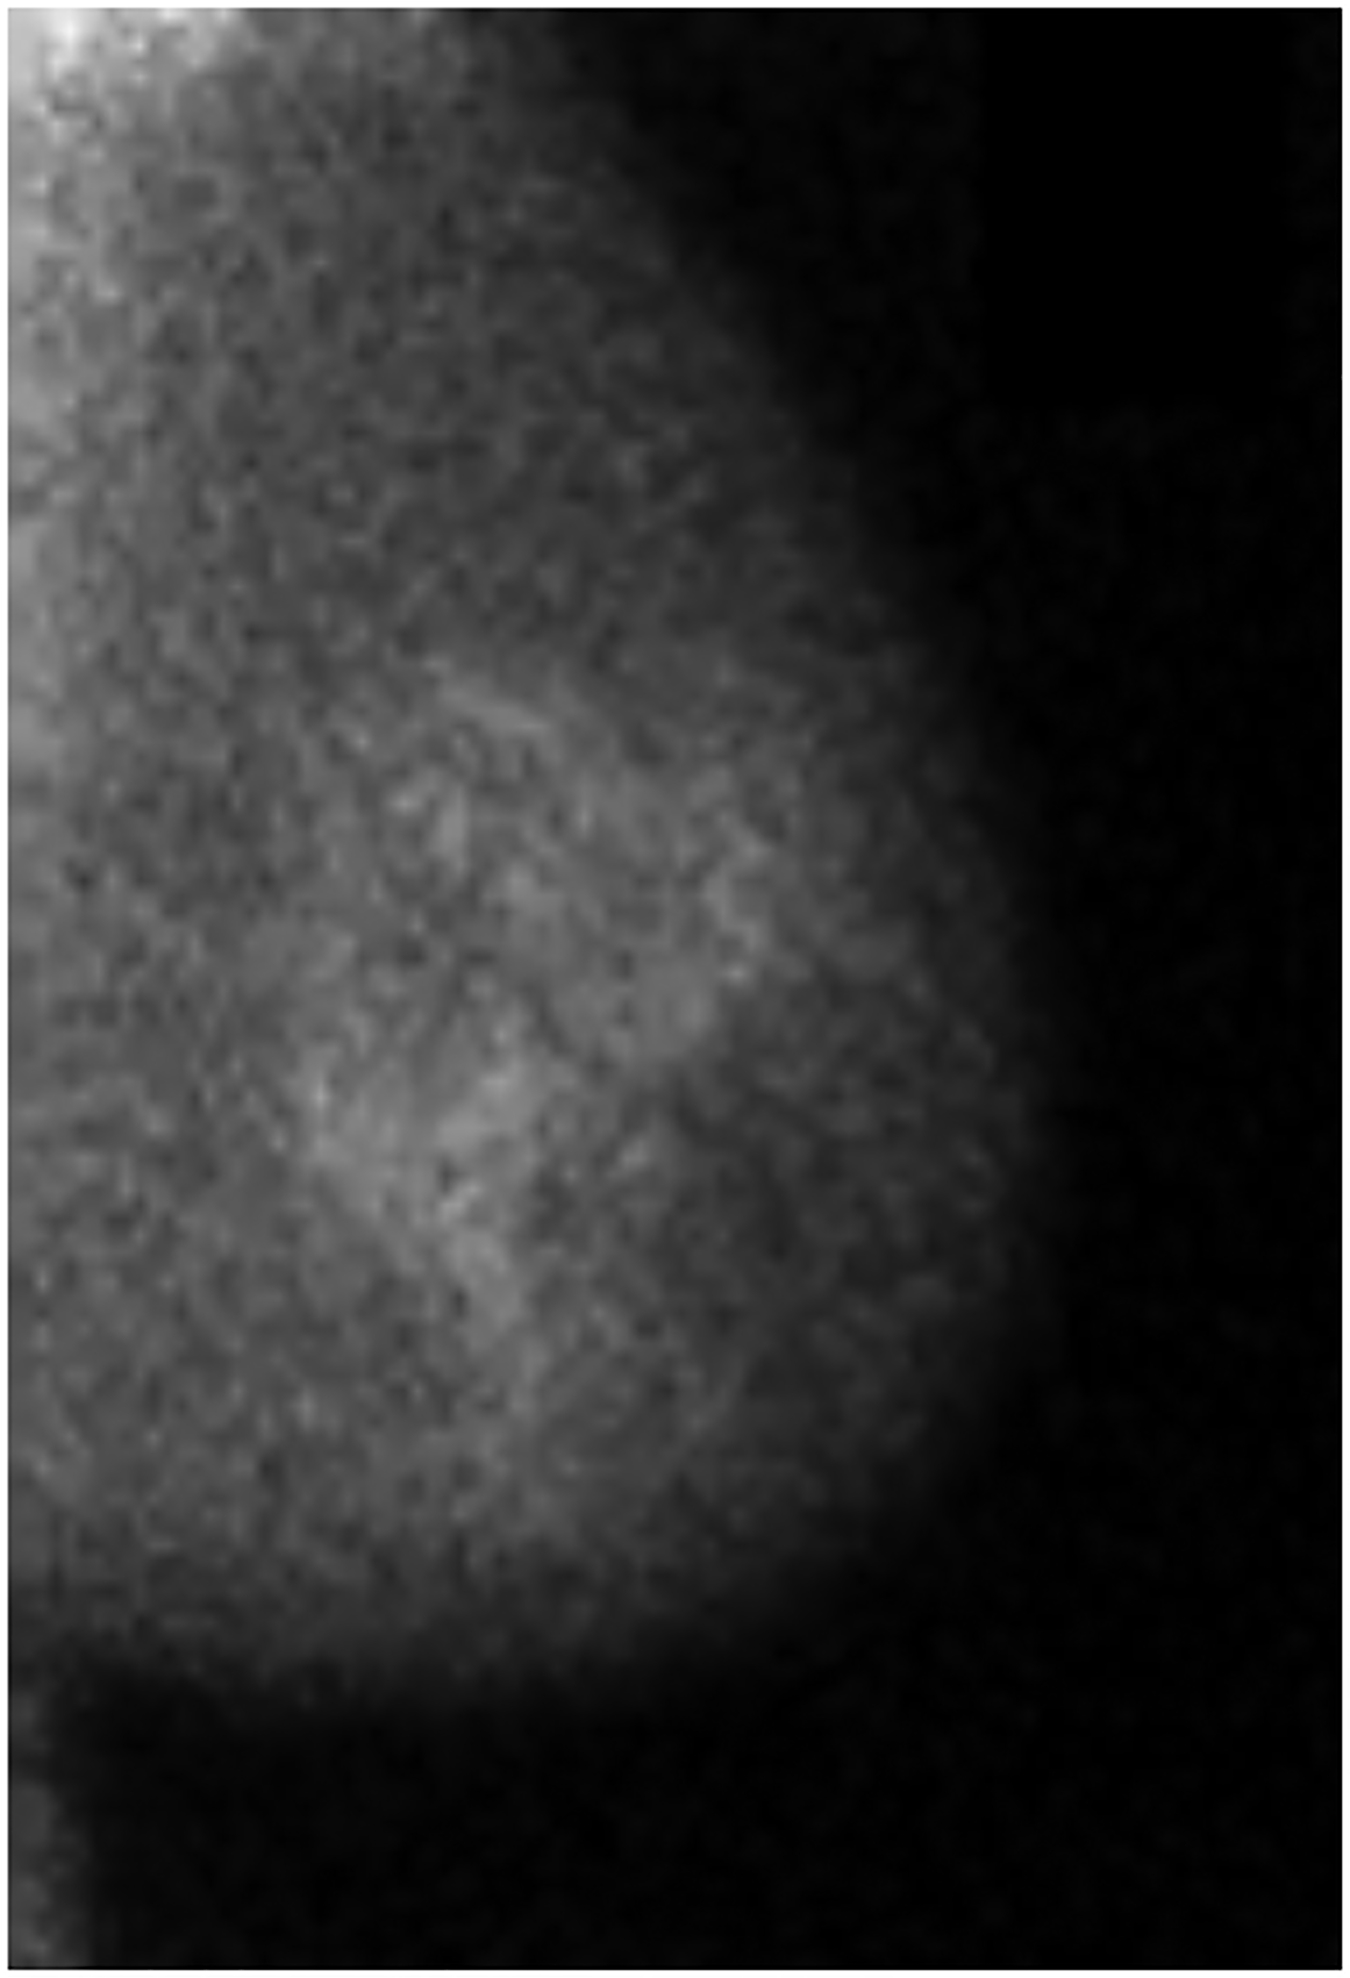
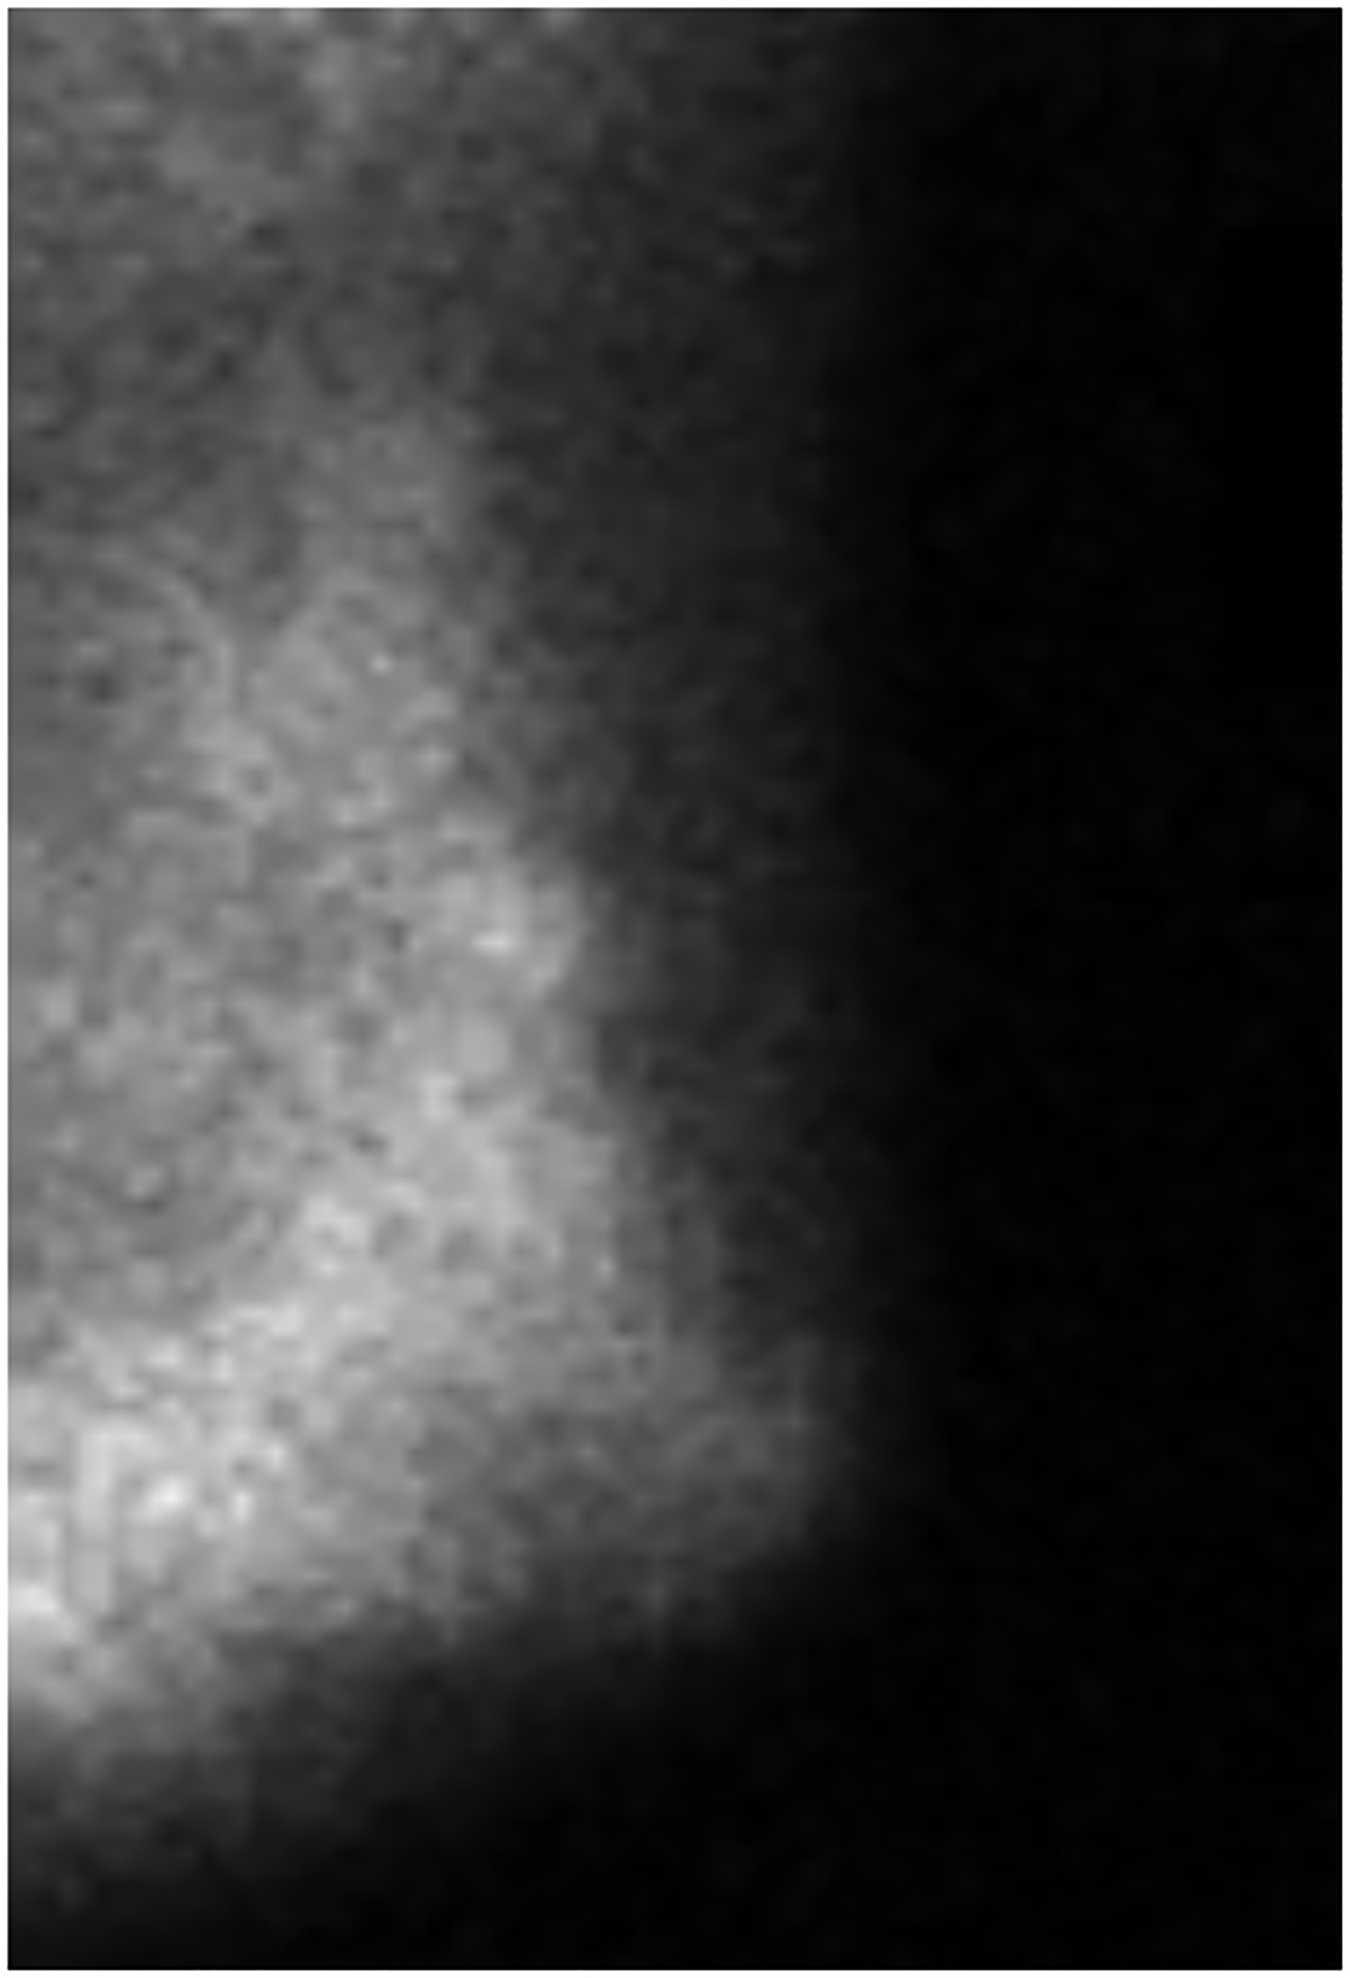
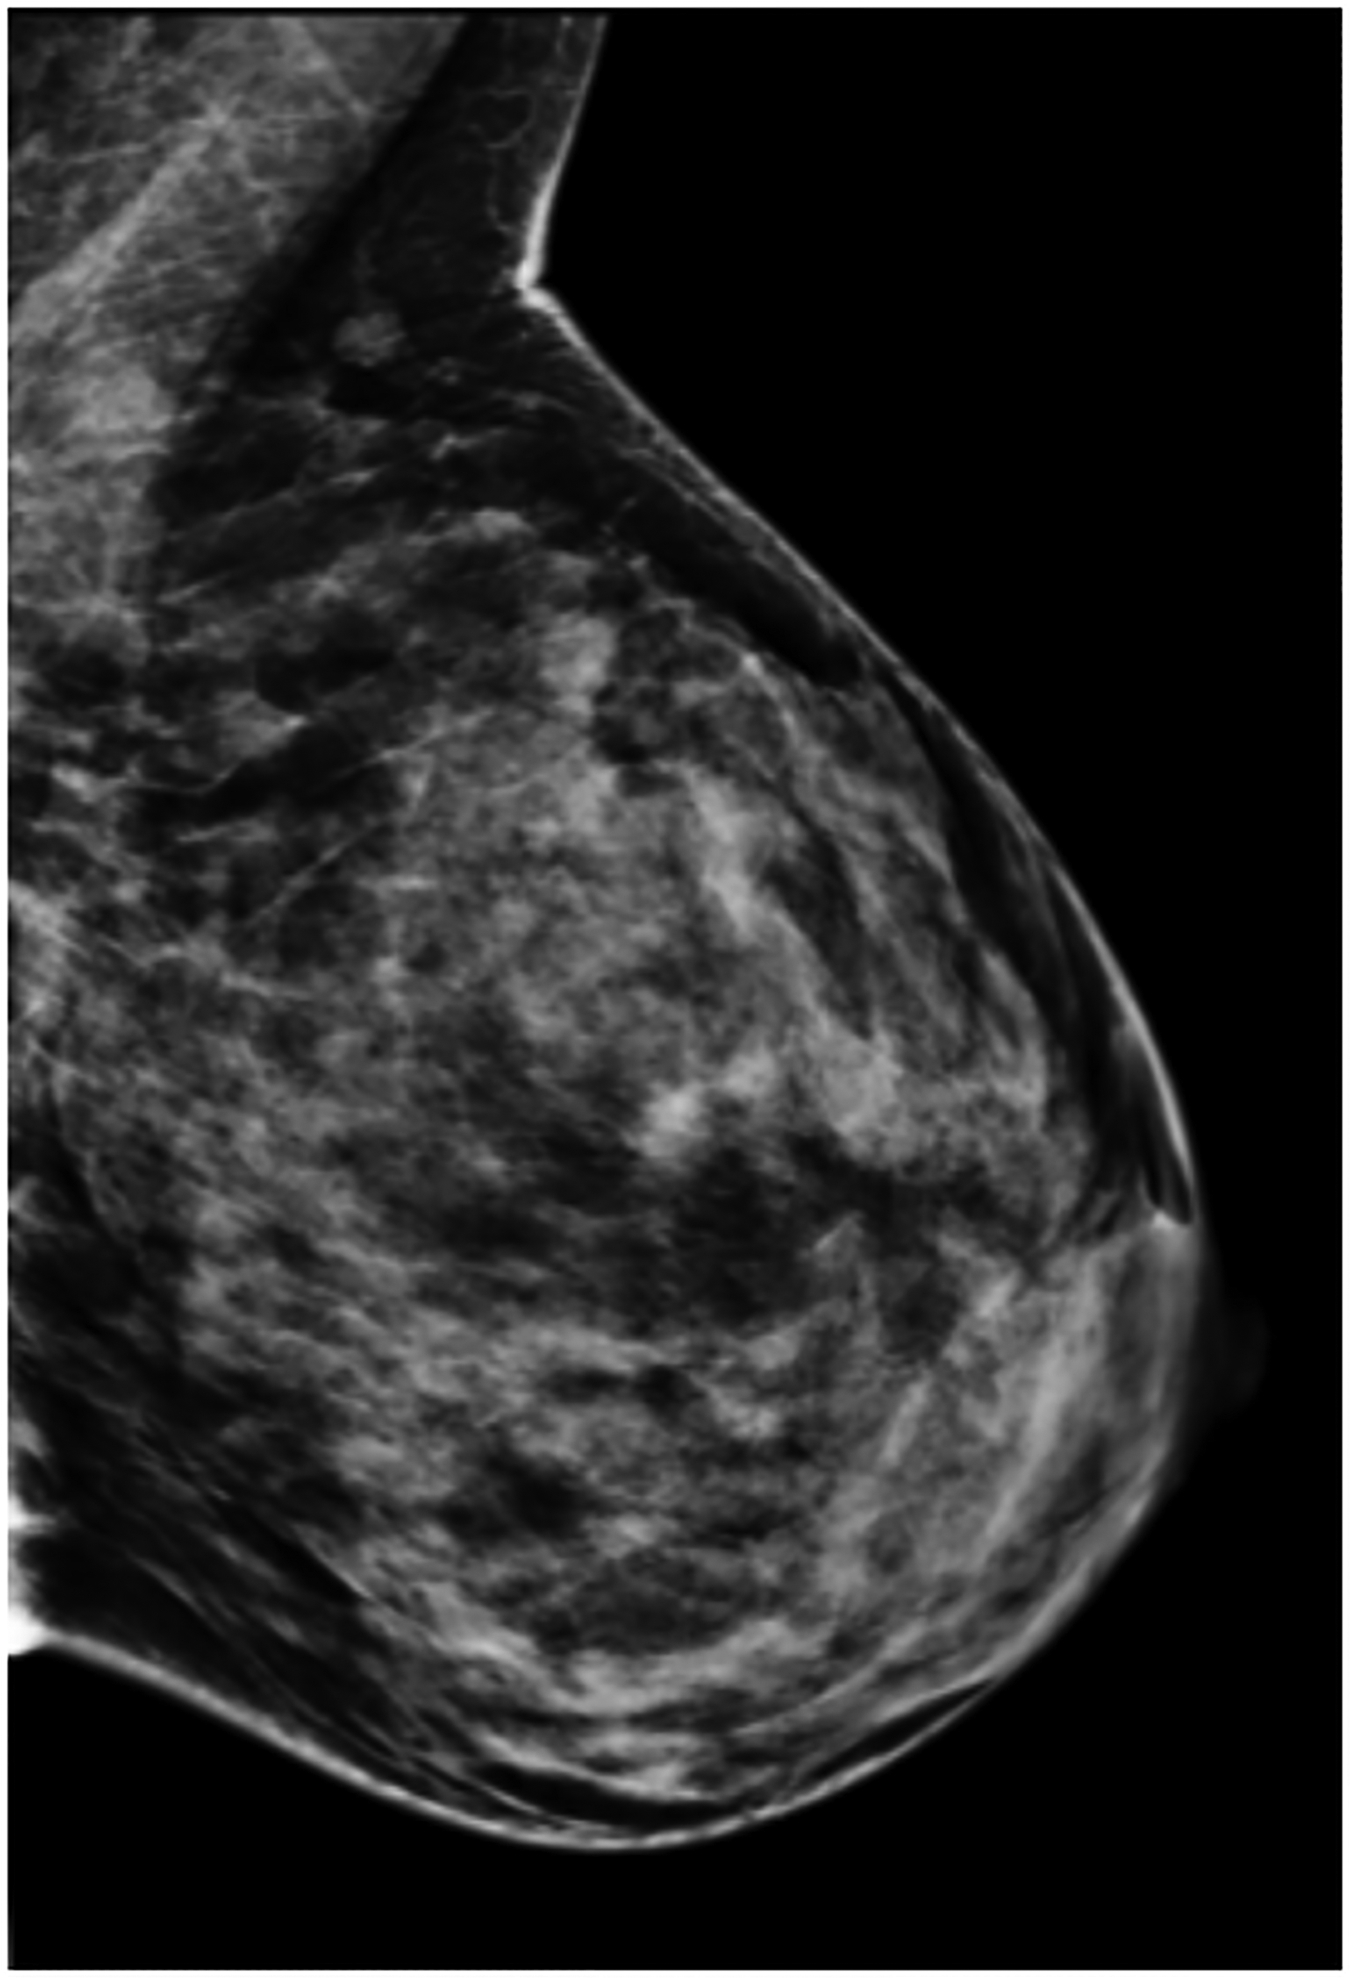
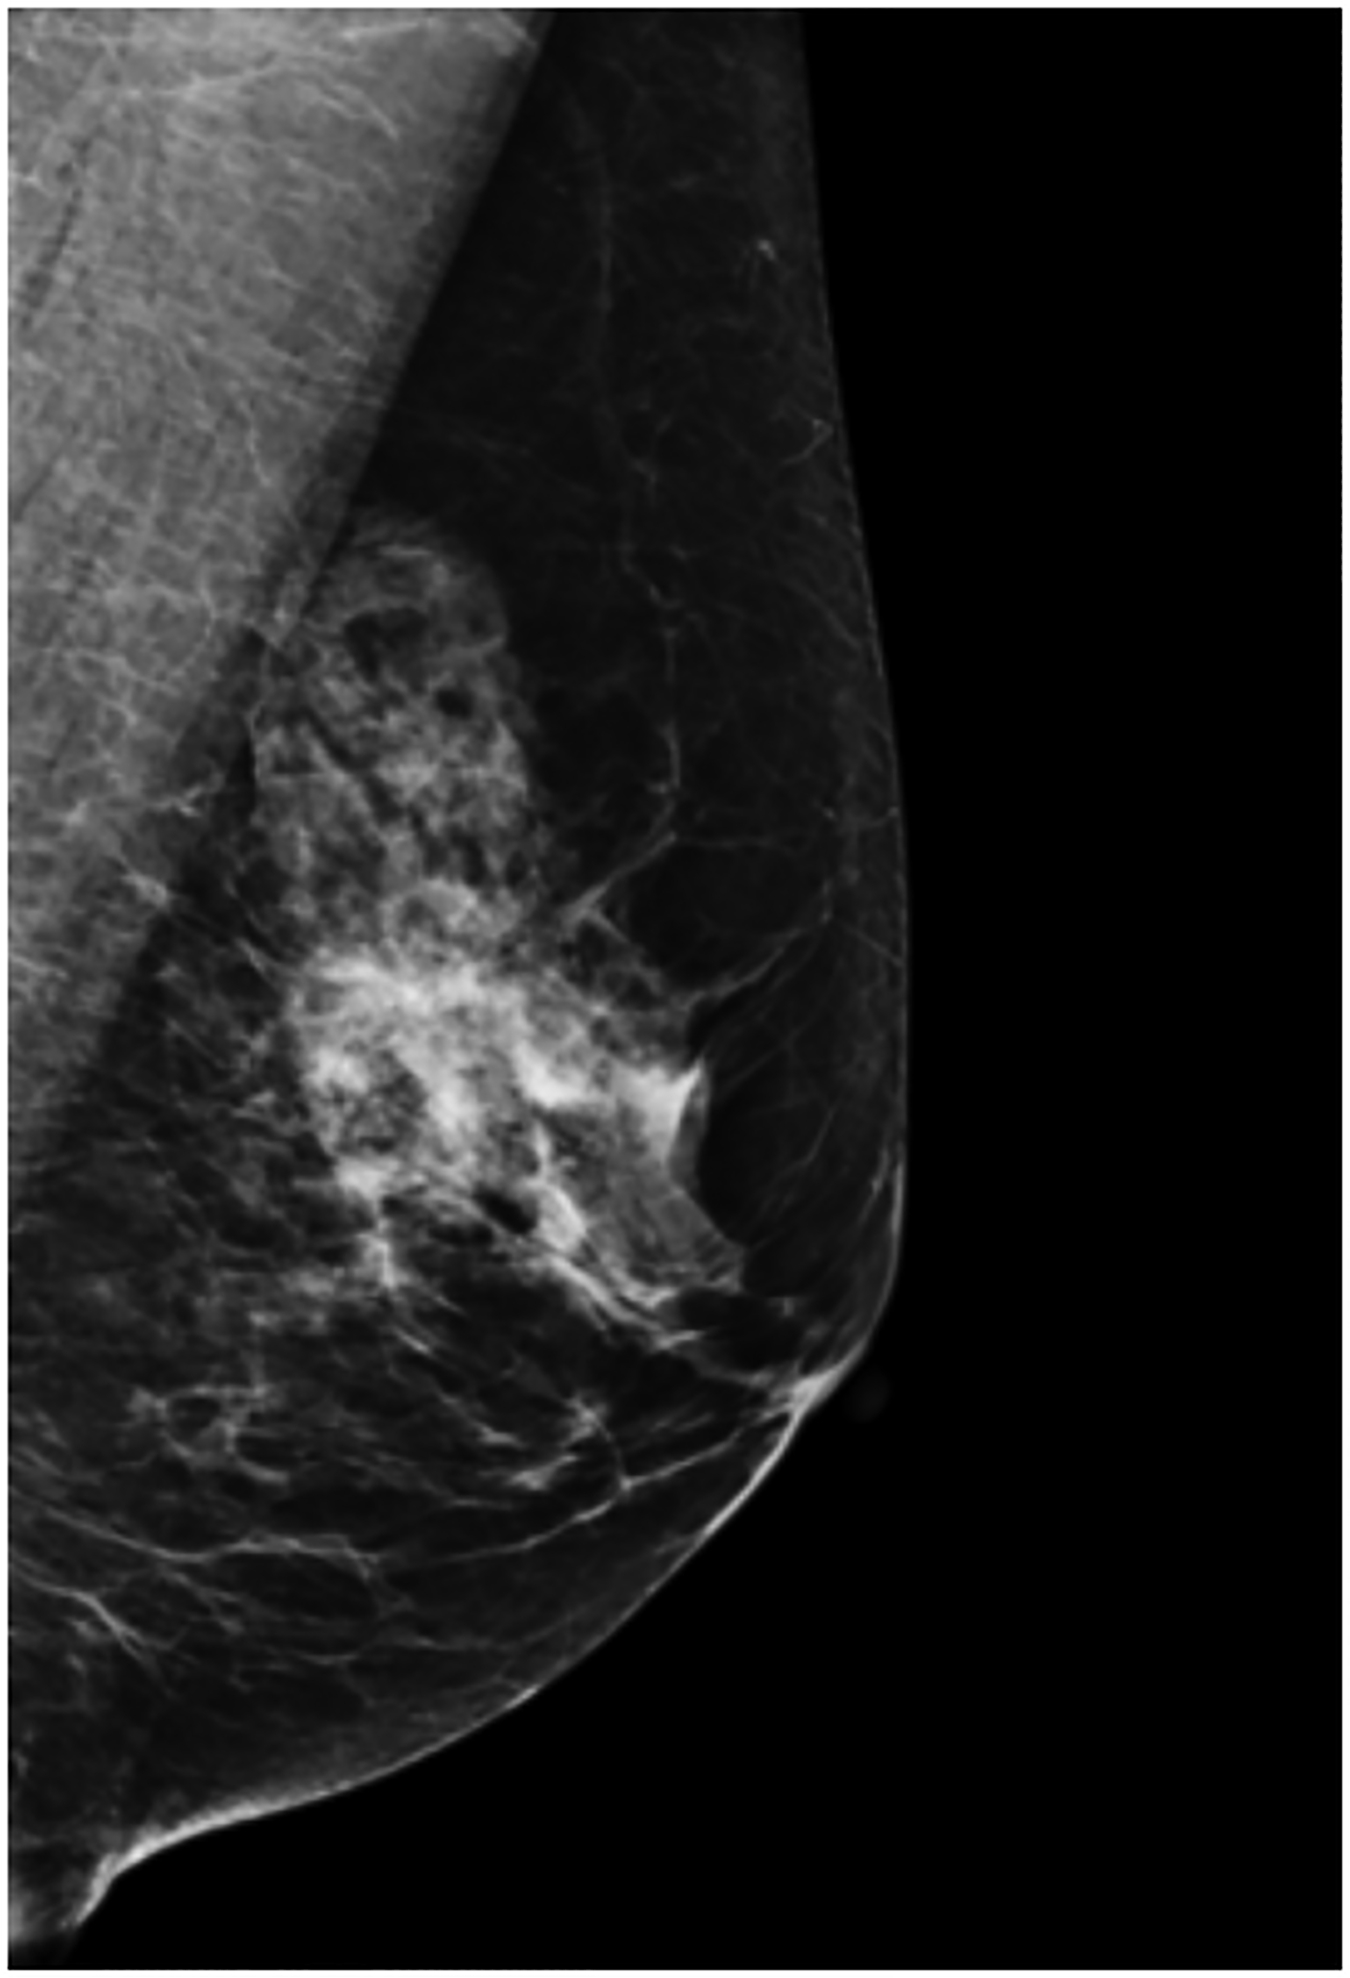
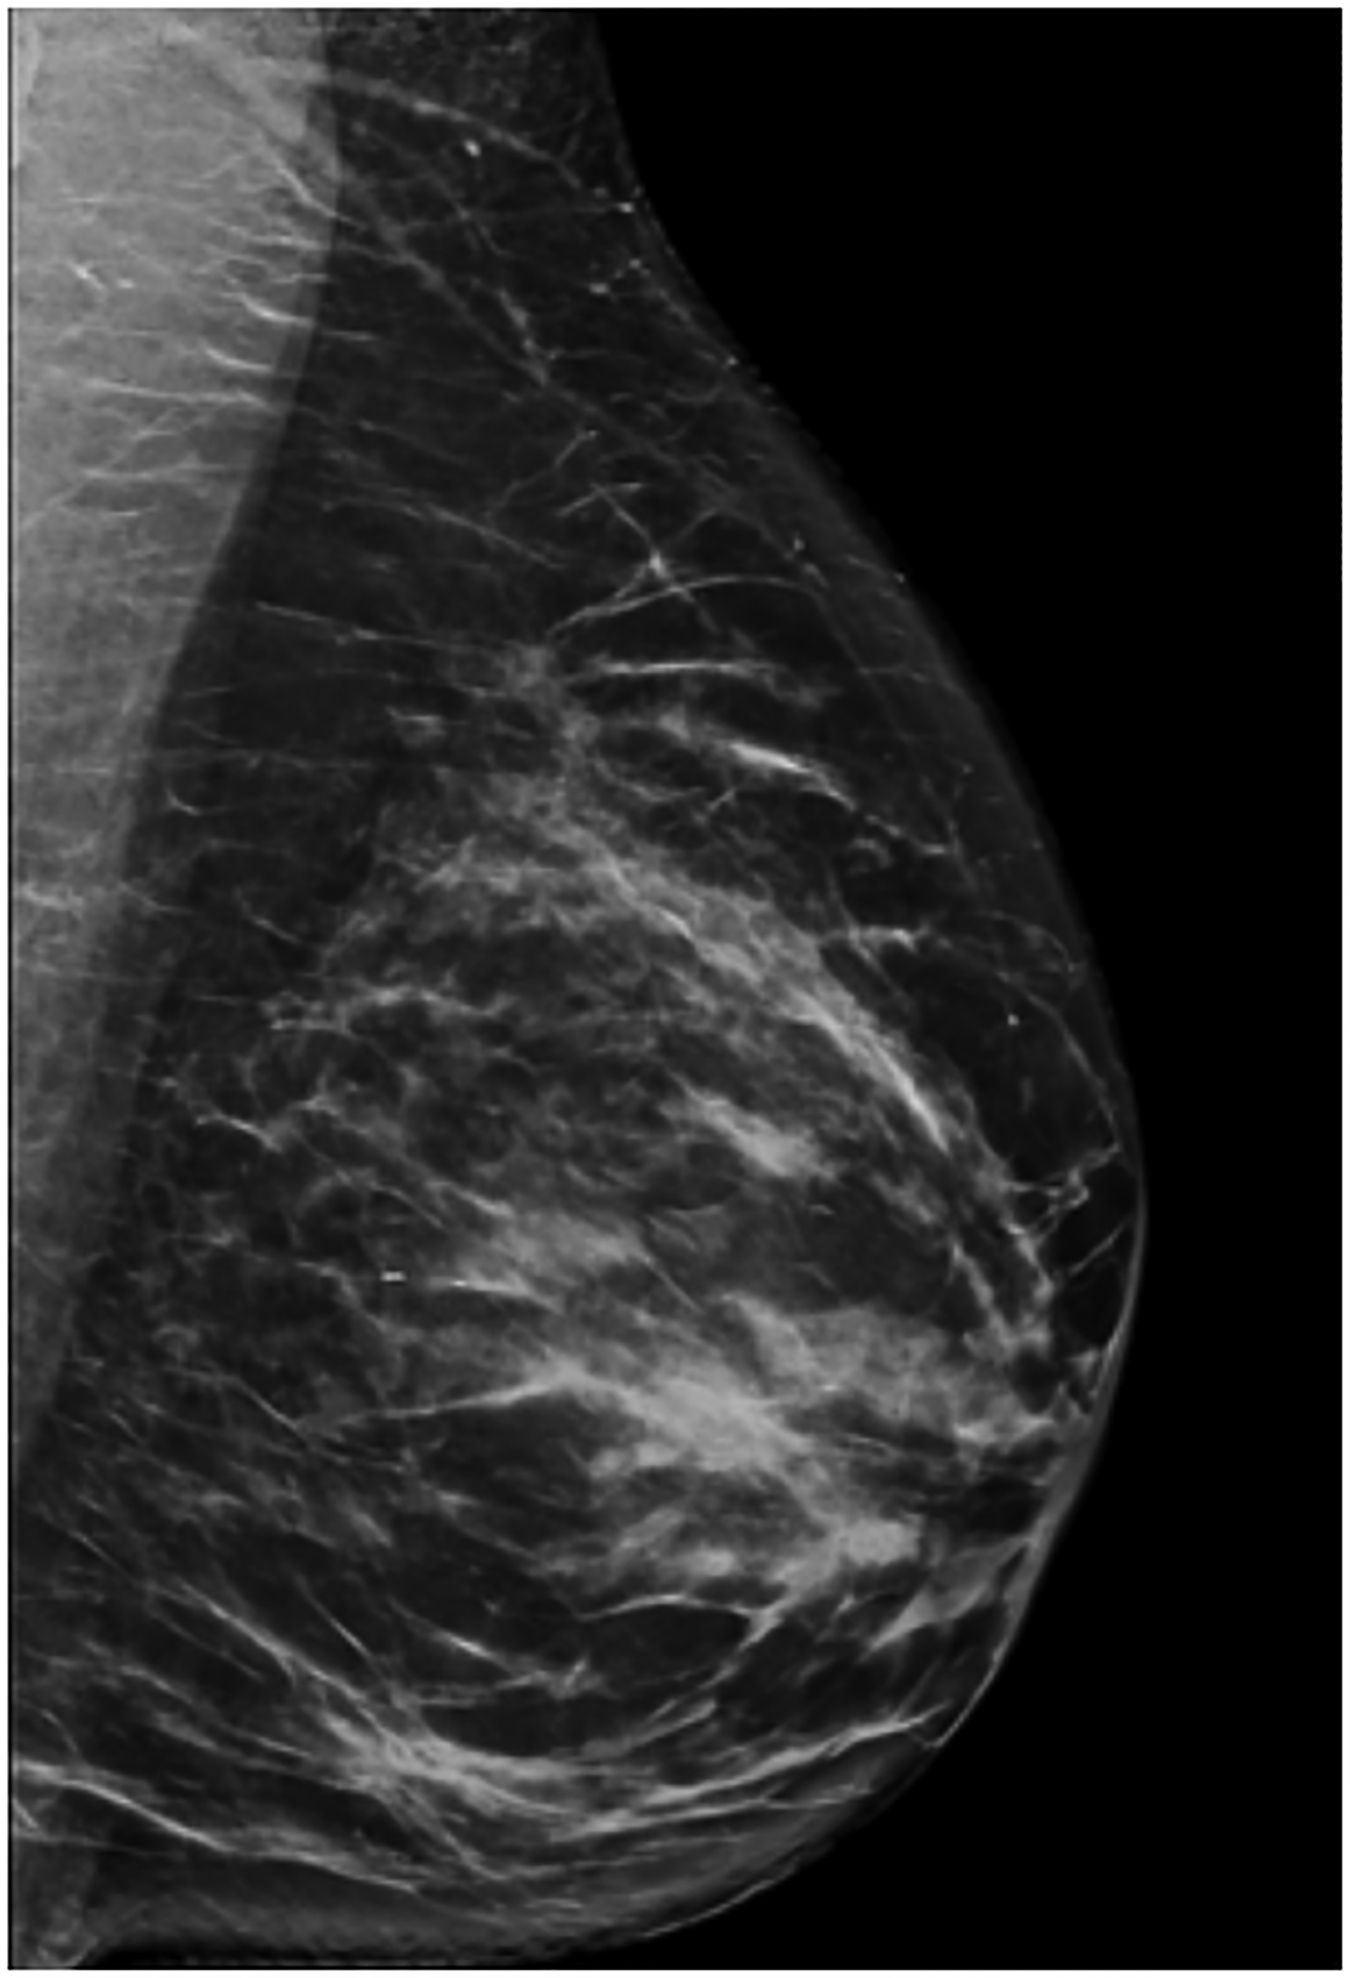
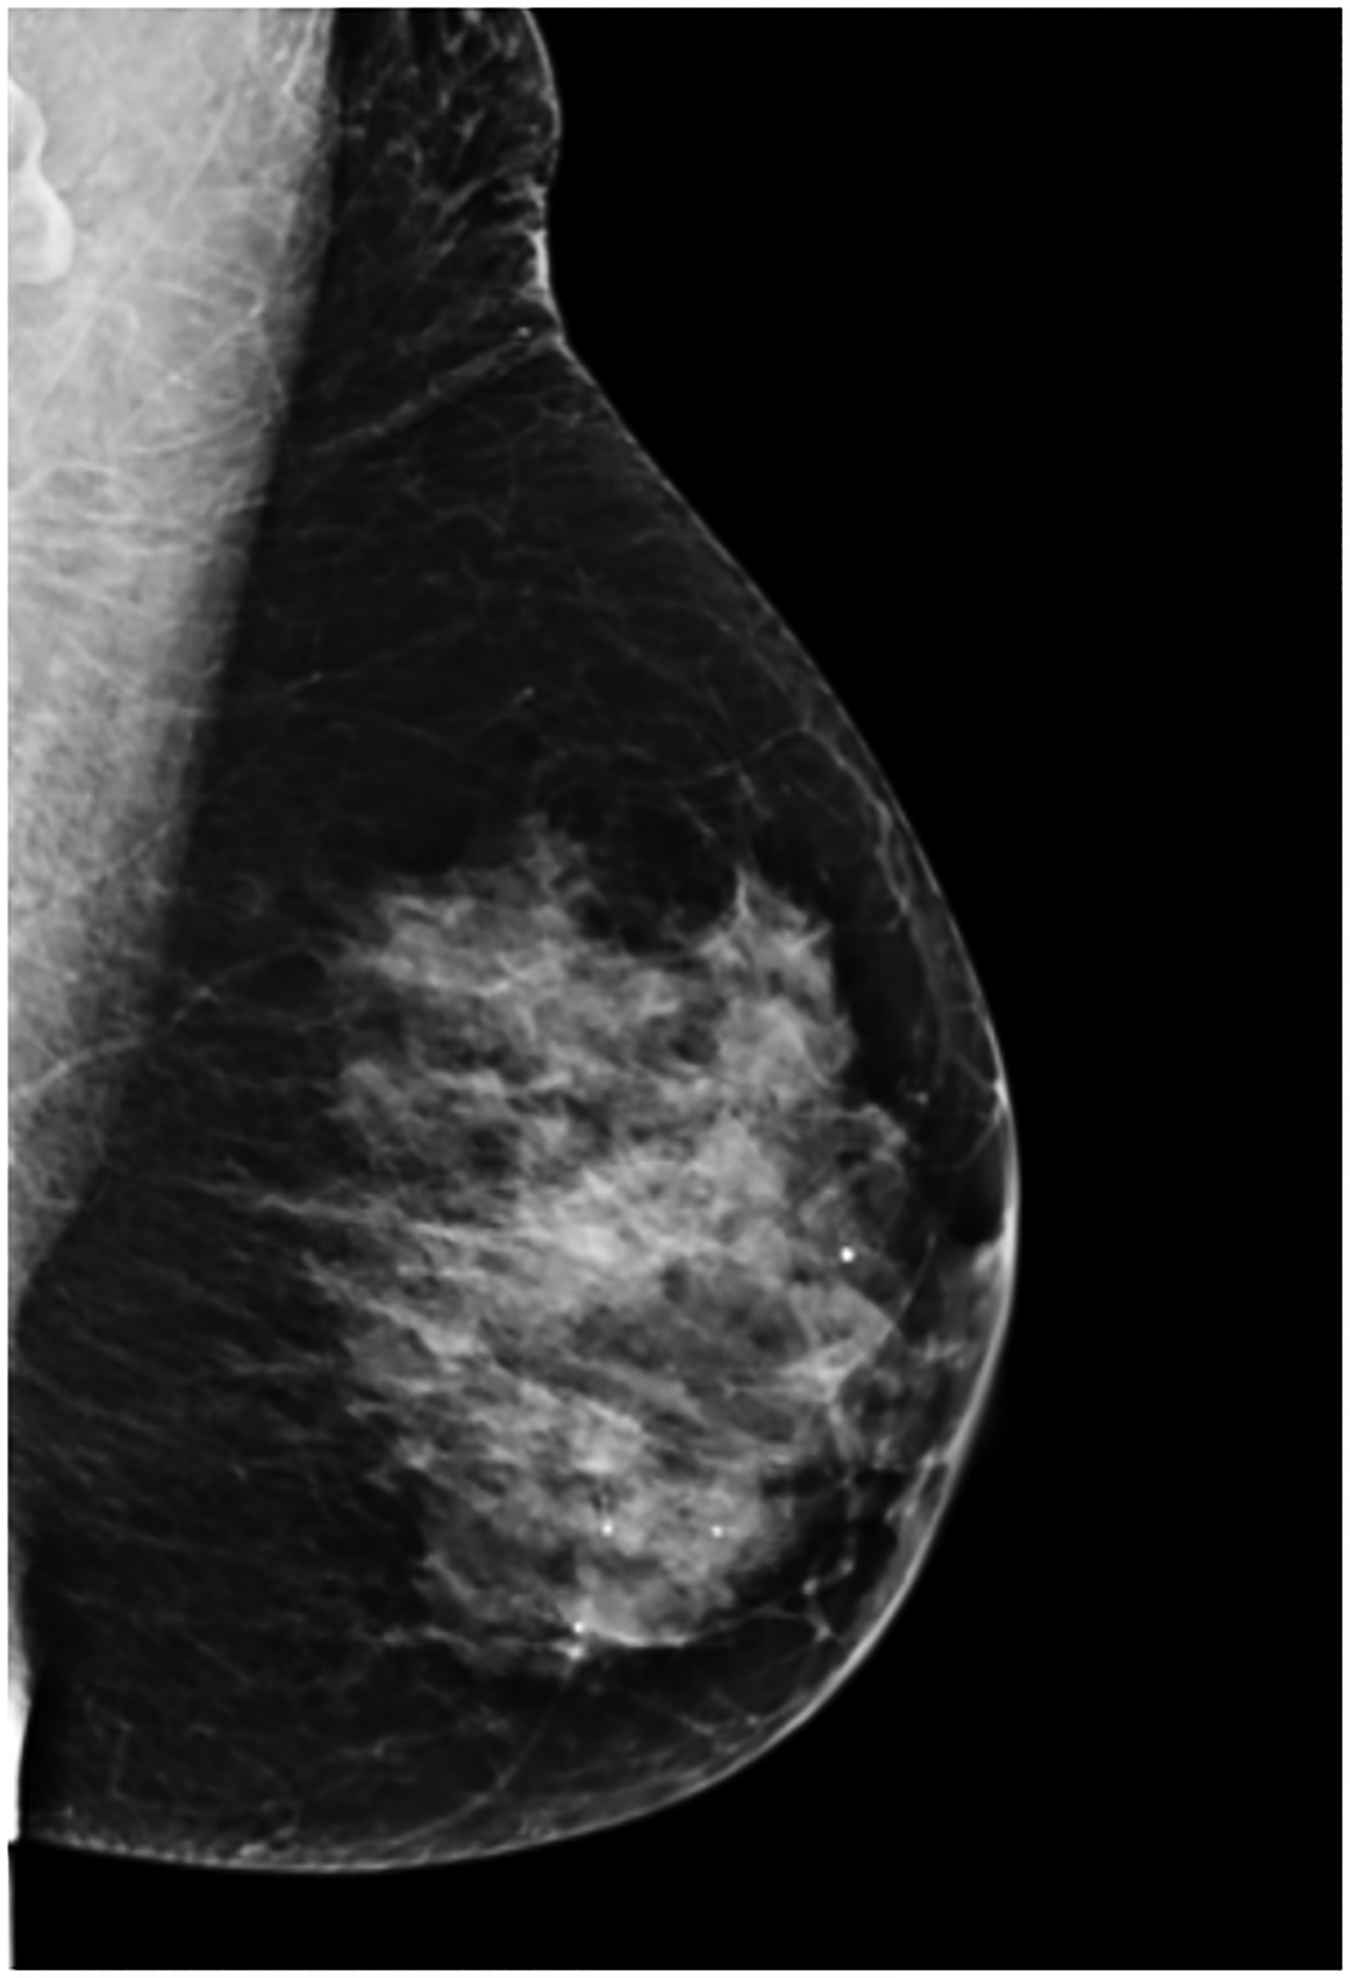
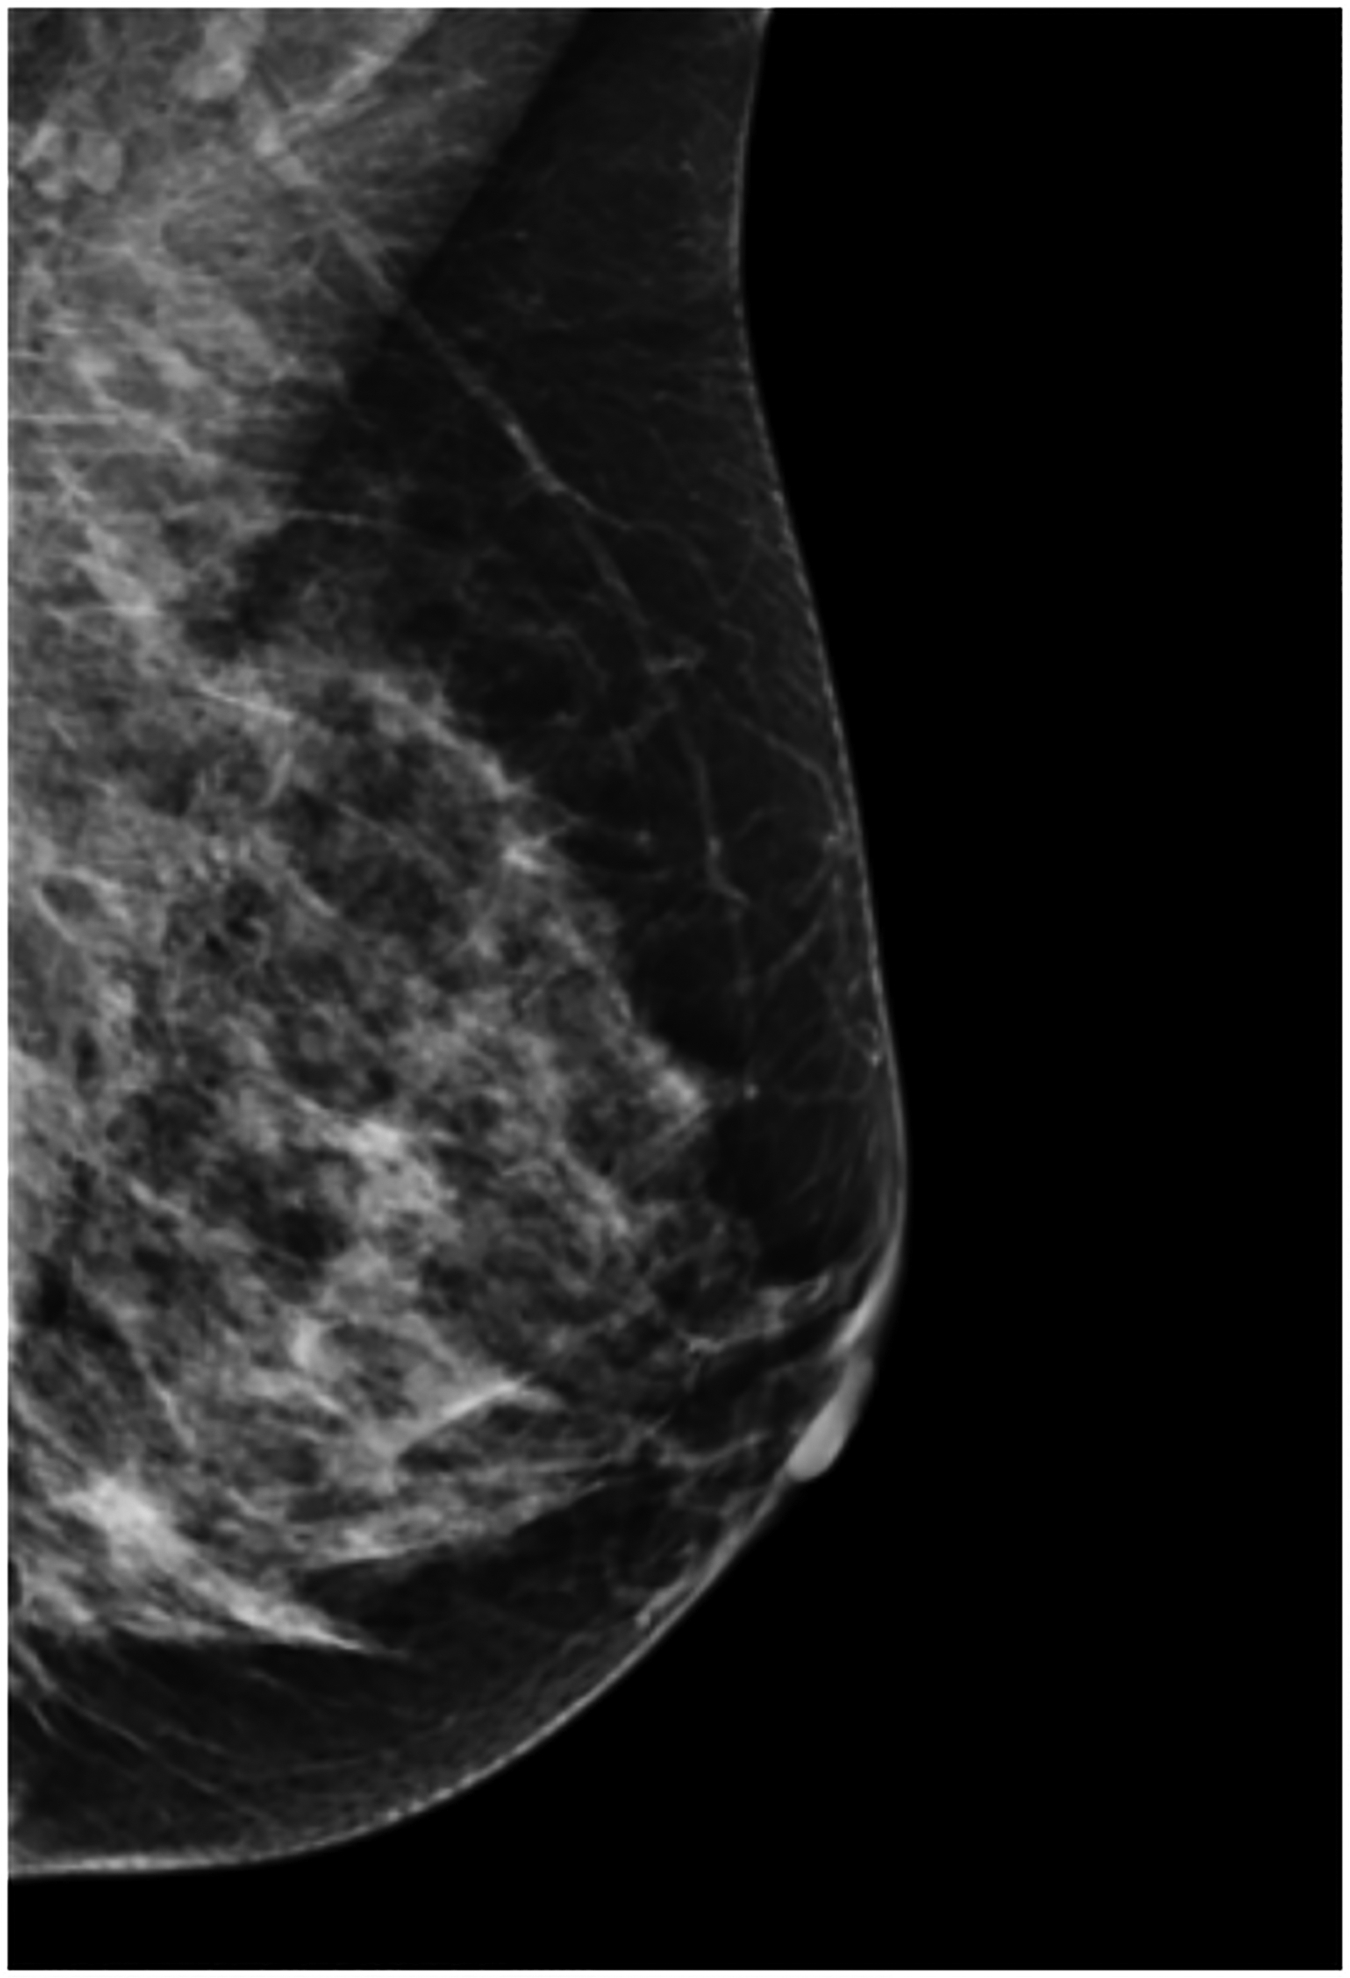
Examples of background parenchymal uptake (BPU) categories on molecular breast imaging (MBI) in five different women. MBI (top row) exams in the mediolateral oblique view are shown for photopenic (panel A), minimal BPU (panel B), mild BPU (panel C), moderate BPU (panel D), and marked (panel E) BPU categories. Corresponding digital mammograms (bottom row) are shown in panels F through J.
BPU on each MBI exam was assessed by one of two breast radiologists (ALC and DHW, with 7 and 10 years’ experience in MBI, respectively) while blinded to all clinical information, including indication for MBI and any future breast cancer diagnoses. In conjunction with MBI interpretation, the readers reviewed mammograms performed closest in time to MBI to visually correlate uptake on MBI with fibroglandular tissue seen on mammography and to annotate density according to the Breast Imaging Reporting and Data System (BI-RADS), 5th edition [19]. Each reader interpreted approximately half of the exams (49% and 51%) in batches of up to 100 patients per reading session. To monitor consistency in BPU interpretation, each batch included a randomly-placed standard set of 10 MBI exams; these interpretations were previously shown as similar between the two readers and highly reproducible over time [20]. Intrareader and interreader agreement for BPU was assessed by calculating percent agreement and unweighted kappa from the standard set of 10 MBI exams interpreted within the first and last batches for each reader.
Statistical analysis
Characteristics of the cohort at baseline MBI are presented by BPU category. Our main exposure of interest was BPU, considered as both the full 5-category variable and a combined 2-category variable of elevated BPU (mild/moderate/marked) and low BPU (photopenic/minimal). Primary risk analysis included multivariable Cox proportional hazards models of time until breast cancer diagnosis. Cox proportional hazards models were adjusted for potential confounders by including age, body mass index (BMI), BI-RADS density, postmenopausal hormone therapy use, and history of breast biopsy showing atypia or lobular carcinoma in situ as covariates. We performed stratified analyses to examine effect modification of BPU and breast cancer risk by menopausal status, BI-RADS density, postmenopausal hormone therapy use, history of biopsy showing atypia or lobular carcinoma in situ, family history of breast cancer, Gail model and BCSC model risk thresholds, and MBI indication. Pairwise interactions between BPU with age and BI-RADS density were evaluated. Kaplan-Meier plots, adjusted for age and BMI, illustrated the relationship between combined BPU categories and breast cancer events. The proportional hazards model assumption was verified using Schoenfeld residual plots and tests.
Five-year absolute risk was calculated only among women with at least 5 years of follow up as the number of women with breast cancer diagnosed within 5 years after MBI per number of women in each subgroup considered. Discriminatory accuracy of risk models in estimating five-year risk of developing invasive breast cancer was assessed using survival C-statistics. C-statistics were calculated from two proportional hazards models: one included BPU (2-category combined variable) and Gail model five-year risk score; the other included BPU and[14] BCSC model five-year risk score[15]. C-statistics from these models were compared to those from respective models including Gail risk score or BCSC risk score alone. Differences in c-statistics were evaluated based on 1000 bootstrap samples [21]. Analyses were conducted using SAS (version 9.4; Cary, NC). A P-value less than 0.05 was considered significant.
Results
Cohort Characteristics
Characteristics by BPU category are noted in Table 1. The 2992 women had a mean age of 56 years (sd 10.6 years). Among 2992 women, the most frequently observed BPU category was minimal (1755 [59%]) and least observed was marked (124 [4%]). Considering combined categories, 845 (28%) women had elevated BPU (mild, moderate, or marked) and 2147 (72%) had low BPU (photopenic or minimal). Most women in the cohort were postmenopausal (1827 [61%]), had dense breasts, defined as BI-RADS c or d density (n=2404 [80%]), and presented for screening MBI (n=2759 [92%]).
Table 1.
Characteristics of the cohort, assessed at baseline MBI, by BPU category.
| Characteristic | Photopenic BPU No. (%) | Minimal BPU No. (%) | Mild BPU No. (%) | Moderate BPU No. (%) | Marked BPU No. (%) | All BPU categories No. (%) |
|---|---|---|---|---|---|---|
| Total women | 392 (13) | 1755 (59) | 437 (15) | 284 (9) | 124 (4) | 2992 (100) |
| Follow-up interval, median ± SD (range), y | 7.4 ± 3.3 (0.6 – 13.8) | 7.2 ±2.9 (0.5 – 13.7) | 7.5 ± 3.1 (0.6 – 13.7) | 7.3 ± 3.2 (0.5 – 13.0) | 7.7 ± 3.3 (0.5 – 13.2) | 7.3 ± 3.1 (0.5 – 13.8) |
| Age, mean ± SD (range), y | 56.7 ± 11.1 (25.9 – 84.7) | 58.9 ± 10.2 (29.0 – 88.2) | 52.5 ± 9.5 (30.6 – 82.6) | 49.2 ± 8.2 (31.7 – 81.2) | 48.5 ± 7.7 (32.9 – 77.4) | 56.3 ± 10.6 (25.9 – 88.2) |
| BMI, mean ± SD (range), kg/m 2 | 22.9 ± 3.4 (15.5 – 41.1) | 26.7 ± 5.1 (16.6 – 57.5) | 27.0 ± 5.1 (18.1 – 53.4) | 26.7 ± 5.2 (17.6 – 47.9) | 26.2 ± 5.1 (18.1 – 50.2) | 26.2 ± 5.2 (15.5 – 74.6) |
| Menopausal Status | ||||||
| Premenopausal | 138 (35) | 451 (26) | 249 (57) | 221 (78) | 105 (85) | 1164 (39) |
| Postmenopausal | 254 (65) | 1304 (74) | 188 (43) | 62 (22) | 19 (15) | 1827 (61) |
| Missing | - | - | - | 1 | - | 1 |
| BI-RADS Density | ||||||
| Non-dense, A + B | 4 (1) | 477 (27) | 58 (13) | 28 (10) | 4 (3) | 571 (19) |
| Dense, C + D | 387 (99) | 1263 (72) | 378 (86) | 256 (90) | 120 (97) | 2404 (80) |
| Missing | 1 | 15 | 1 | - | - | 17 |
| Postmenopausal Hormone Therapy | ||||||
| None at baseline MBI | 208 (83) | 1089 (84) | 121 (66) | 34 (55) | 11 (58) | 1463 (80) |
| Currently using at baseline MBI | 43 (17) | 211 (16) | 65 (35) | 28 (45) | 8 (42) | 355 (20) |
| Missing | 3 | 4 | 2 | - | - | 9 |
| Biopsy history | ||||||
| No atypia or LCIS | 378 (96) | 1699 (97) | 423 (97) | 274 (96) | 118 (95) | 2892 (97) |
| Atypia or LCIS | 14 (4) | 56 (3) | 14 (3) | 10 (4) | 6 (5) | 100 (3) |
| Family History of Breast Cancer | ||||||
| No first-degree relatives | 230 (59) | 1158 (66) | 248 (57) | 163 (57) | 68 (55) | 1867 (62) |
| One or more first-degree relatives | 162 (41) | 597 (34) | 189 (43) | 121 (43) | 56 (45) | 1125 (38) |
| Gail Model Five-Year Risk * | ||||||
| < 1.67% | 205 (53) | 925 (53) | 254 (59) | 190 (68) | 79 (64) | 1653 (56) |
| ≥ 1.67% and < 3% | 124 (32) | 524 (30) | 119 (27) | 63 (22) | 35 (28) | 865 (29) |
| ≥ 3 % | 59 (15) | 292 (17) | 61 (14) | 28 (10) | 9 (7) | 449 (15) |
| BCSC Model Five-Year Risk † | ||||||
| < 1.67% | 115 (32) | 781 (49) | 244 (58) | 193 (69) | 80 (66) | 1413 (51) |
| ≥ 1.67% and < 3% | 196 (54) | 694 (43) | 151 (36) | 69 (24) | 33 (27) | 1143 (41) |
| ≥ 3 % | 49 (14) | 129 (8) | 27 (6) | 18 (6) | 9 (7) | 232 (8) |
| MBI Indication | ||||||
| Screening | 372 (95) | 1613 (92) | 402 (92) | 257 (90) | 115 (93) | 2759 (92) |
| Diagnostic | 20 (5) | 142 (8) | 35 (8) | 27 (10) | 9 (7) | 233 (8) |
| BRCA Mutation | ||||||
| Positive | 2 (0.5) | 6 (0.3) | 0 (0) | 0 (0) | 1 (0.8) | 9 (0.3) |
| Negative or Unknown | 390 (99) | 1749 (99) | 437 (100) | 284 (100) | 123 (99) | 2983 (99) |
Note. – Unless otherwise specified, data are number of women, with percentages in parentheses.
SD = standard deviation; BMI = body mass index; LCIS = lobular carcinoma in situ; BCSC = Breast Cancer Surveillance Consortium
Gail risk model excludes 25 women <35 years, >85 years, or with history of biopsy showing LCIS [14].
BCSC risk model excludes 204 women <35 years or >74 years [15].
During follow-up (median 7.3 years), 144 of 2992 women had a breast cancer event, with median time to diagnosis of 4.2 years after MBI (sd, 2.7 years; range, 0.5 – 11.6 years). Only 3 breast cancers were diagnosed between 0.5 – 1 year after baseline MBI. Median time to diagnosis was similar for premenopausal and postmenopausal women (4.5 years and 4.2 years, respectively). Of 144 breast cancers, 105 (73%) were invasive, 37 (26%) were DCIS, and 2 were identified as breast malignancy in medical records but did not have pathology results available. Invasive cancers had median size of 1.3 cm (sd 1.1 cm; range 0.1 – 5.5 cm); 92 of 105 (88%) were node negative.
Associations of BPU with Breast Cancer
Overall, higher BPU was associated with greater breast cancer risk (p<0.001) as shown in Table 2. In a model adjusted for age and BMI, women with mild, moderate, and marked BPU were at greater risk of breast cancer compared to women with the referent category of minimal BPU (HRs= 2.4, 2.7, and 2.9, respectively). Women with photopenic BPU did not have a statistically different risk from women with minimal BPU (HR=1.4 [CI 0.8, 2.4]). Additional model adjustments for BI-RADS density, postmenopausal hormone therapy, and history of biopsy showing atypia or lobular carcinoma in situ minimally impacted results (Table 2). Pairwise interactions between BPU with age and BI-RADS density were found non-significant.
Table 2.
Association of background parenchymal uptake (BPU) with breast cancer diagnosed ≥180 days after MBI.
| BPU Category | Breast cancer N=144 | No breast cancer N=2848 | HR (95% CI) | HR (95% CI) |
|---|---|---|---|---|
| All Women | Model adjusted for Age, BMI | Model adjusted for Age, BMI, Density*, Hormone therapy, History of atypia/LCIS | ||
| Photopenic | 17 (4.3%) | 375 (95.7%) | 1.36 (0.78, 2.36) | 1.21 (0.68, 2.14) |
| Minimal (ref.) | 63 (3.6%) | 1692 (96.4%) | - | - |
| Mild | 33 (7.6%) | 404 (92.5%) | 2.39 (1.55, 3.69) | 2.60 (1.66, 4.09) |
| Moderate | 21 (7.4%) | 263 (92.6%) | 2.68 (1.60, 4.50) | 2.80 (1.64, 4.77) |
| Marked | 10 (8.1%) | 114 (91.9%) | 2.86 (1.43, 5.73) | 2.76 (1.35, 5.65) |
| p value | <0.001 | <0.001 | ||
| Postmenopausal Women † | N=97 | N=1730 | ||
| Photopenic | 14 (5.5%) | 240 (94.5%) | 1.78 (0.96, 3.30) | 1.60 (0.83, 3.06) |
| Minimal (ref.) | 46 (3.5%) | 1258 (96.5%) | - | - |
| Mild | 24 (12.8%) | 164 (87.2%) | 3.62 (2.20, 5.95) | 4.04 (2.43, 6.73) |
| Moderate | 9 (14.5%) | 53 (85.5%) | 3.82 (1.86, 7.81) | 4.32 (2.07, 9.03) |
| Marked | 4 (21.1%) | 15 (79.9%) | 7.07 (2.54, 19.67) | 7.78 (2.76, 21.92) |
| p value | <0.001 | <0.001 | ||
| Premenopausal Women † | N=47 | N=1117 | ||
| Photopenic | 3 (2.2%) | 135 (97.8%) | 0.50 (0.15, 1.71) | 0.39 (0.11, 1.43) |
| Minimal (ref.) | 17 (3.8%) | 434 (96.2%) | - | - |
| Mild | 9 (3.6%) | 240 (96.4%) | 0.91 (0.41, 2.04) | 0.89 (0.38, 2.05) |
| Moderate | 12 (5.4%) | 209 (94.6%) | 1.40 (0.67, 2.93) | 1.33 (0.61, 2.87) |
| Marked | 6 (5.7%) | 99 (94.3%) | 1.28 (0.50, 3.24) | 1.04 (0.39, 2.78) |
| p value | 0.54 | 0.46 |
HR = hazards ratio; CI = confidence interval; BMI = body mass index; LCIS = lobular carcinoma in situ
Density classified as ACR BI-RADS categories.
Menopausal status missing in 1 woman
The overall risk association with BPU remained when limited to postmenopausal women (p<0.001); age- and BMI-adjusted HRs increased to 3.6, 3.8, and 7.1 for mild, moderate, and marked BPU categories, respectively, relative to minimal BPU. However, BPU, as a 5-category variable, was not significantly associated with breast cancer risk in the subset of premenopausal women (p=0.54) (Table 2).
When combining BPU categories (Table 3), elevated BPU (mild, moderate, and marked categories) was associated with an overall 2.4 times risk of breast cancer relative to women with low BPU (photopenic and minimal categories) (p<0.001). This overall risk estimate remained when restricting analysis to invasive cancers only (HR=2.8, p<0.001). Postmenopausal women with elevated BPU had 3.5 times the risk of women with low BPU (HR=3.5 [CI 2.3, 5.3], p<0.001) but the risk association was still not significant in premenopausal women (HR=1.3 [CI 0.7, 2.3], p=0.39).
Table 3.
Association of elevated BPU (mild, moderate, and marked categories) versus low BPU (photopenic and minimal categories) on breast cancer risk in study subgroups.
| Subgroup Characteristics | Women with future breast cancer / N (%) | HR of Elevated BPU vs. Low BPU (95% CI)* | MBI BPU p-value | 5 year Absolute Risk, % (95% CI) | |
|---|---|---|---|---|---|
| Low BPU | Elevated BPU | ||||
| All Women | 144/2992 (4.8) | 2.39 (1.68, 3.41) | <0.001 | 2.5 (1.8, 3.1) | 4.3 (2.9, 5.7) |
| All Women, Invasive Cancer Only | 105/2992 (3.5) | 2.83 (1.88, 4.27) | <0.001 | 1.7 (1.1, 2.2) | 3.2 (2.0, 4.4) |
| Menopausal Status | |||||
| Premenopausal | 47/1164 (4.0) | 1.29 (0.72, 2.32) | 0.39 | 1.6 (0.6, 2.7) | 2.7 (1.4, 4.1) |
| Postmenopausal | 97/1827 (5.3) | 3.50 (2.31, 5.31) | <0.001 | 2.8 (1.9, 3.6) | 7.7 (4.3, 11.0) |
| BI-RADS Density † | |||||
| Non-dense, A+B | 24/571 (4.2) | 2.25 (0.87, 5.81) | 0.09 | 2.6 (1.1, 4.1) | 3.9 (0.0, 8.1) |
| Dense, C+D | 119/2404 (5.0) | 2.46 (1.67, 3.63) | <0.001 | 2.5 (1.7, 3.2) | 4.4 (2.9, 5.9) |
| Extremely dense only, D | 36/570 (6.3) | 4.19 (1.99, 8.85) | <0.001 | 1.7 (0.3, 3.1) | 5.0 (1.9, 8.0) |
| BI-RADS Density in Postmenopausal Women † | |||||
| Non-dense, A+B | 19/420 (4.5) | 3.35 (1.26, 8.92) | 0.02 | 2.7 (0.9, 4.4) | 5.9 (0.0, 13.7) |
| Dense, C+D | 78/1394 (5.6) | 3.25 (2.05, 5.14) | <0.001 | 2.8 (1.8, 3.8) | 8.1 (4.3, 11.8) |
| Extremely dense only, D | 17/246 (6.9) | 8.52 (2.94, 24.70) | <0.001 | 1.6 (0.0, 3.4) | 9.5 (0.2, 17.9) |
| BI-RADS Density in Premenopausal Women † | |||||
| Non-dense, A+B | 5/151 (3.3) | 0.51 (0.06, 4.55) | 0.54 | 2.2 (0.0, 5.2) | 2.0 (0.0, 5.9) |
| Dense, C+D | 41/1009 (4.1) | 1.55 (0.82, 2.94) | 0.17 | 1.5 (0.4, 2.6) | 2.2 (1.3, 4.2) |
| Extremely dense only, D | 19/324 (5.9) | 1.66 (0.65, 4.21) | 0.29 | 1.9 (0.0, 4.0) | 3.7 (0.8, 6.6) |
| Hormone Therapy in Postmenopausal Women | |||||
| None at baseline MBI | 86/1463 (5.9) | 3.83 (2.42, 6.06) | <0.001 | 3.2 (2.2, 4.2) | 9.8 (5.0, 14.4) |
| Currently using at baseline MBI | 11/355 (3.1) | 10.95 (2.35, 50.92) | 0.002 | 0.8 (0.0, 2.0) | 4.4 (0.1, 8.6) |
| Biopsy History | |||||
| No atypia or LCIS | 133/2892 (4.6) | 2.50 (1.73, 3.61) | <0.001 | 2.3 (1.7, 3.0) | 4.2 (2.8, 5.6) |
| Atypia or LCIS | 11/100 (11.0) | 1.67 (0.4, 5.74) | 0.42 | 6.1 (0.1,11.8) | 7.2 (0.0, 17.8) |
| Family History of Breast Cancer | |||||
| No first-degree relatives | 71/1125 (6.3) | 2.36 (1.43, 3.88) | <0.001 | 3.0 (1.7, 4.3) | 5.4 (2.9, 7.8) |
| One or more first degree relatives | 73/1867 (3.9) | 2.37 (1.43, 3.93) | <0.001 | 2.1 (1.3, 2.9) | 3.5 (1.8, 5.2) |
| Gail Model Five-Year Risk ‡ | |||||
| < 1.67% | 37/1651 (2.2) | 2.07 (1.08, 3.95) | 0.03 | 1.1 (0.4, 1.7) | 1.8 (0.6, 3.0) |
| ≥ 1.67% | 68/1314 (5.2) | 2.40 (1.49, 3.88) | <0.001 | 2.2 (1.3, 3.2) | 5.6 (2.9, 8.3) |
| ≥ 3% | 32/449 (7.1) | 2.96 (1.47, 5.96) | 0.002 | 3.4 (1.4, 5.4) | 7.6 (2.0, 12.9) |
| BCSC Model Five-Year Risk § | |||||
| < 1.67% | 37/1412 (2.6) | 2.04 (1.06, 3.91) | 0.03 | 0.9 (0.2, 1.6) | 1.6 (0.5, 2.7) |
| ≥ 1.67% | 62/1375 (4.5) | 2.46 (1.48, 4.07) | <0.001 | 2.0 (1.1, 2.9) | 5.8 (3.0, 8.5) |
| ≥ 3% | 21/232 (8.3) | 4.41 (1.87, 10.43) | <0.001 | 3.0 (0.4, 5.5) | 8.2 (0.1, 15.6) |
| MBI Indication | |||||
| Screening | 125/2759 (4.5) | 1.97 (1.38, 2.80) | <0.001 | 2.6 (1.7, 3.1) | 3.9 (2.5, 5.3) |
| Diagnostic | 19/233 (8.2) | 1.81 (0.73, 4.49) | 0.20 | 3.4 (0.4, 6.3) | 9.0 (1.9, 15.7) |
N = the number of women in each subgroup
Models adjusted for age and body mass index (BMI) at time of MBI.
BI-RADS density missing in 17 women and menopausal status missing in 1 woman.
Gail risk model data is calculated from invasive cancers only and excludes 25 women <35 years, >85 years, or with history of biopsy showing LCIS [14].
BCSC risk model data is calculated from invasive cancers only and excludes 204 women <35 years or >74 years [15].
Kaplan-Meier plots illustrate the differences in rates of breast cancer between women with elevated BPU and low BPU for the overall cohort (Fig. 2) and the postmenopausal and premenopausal subsets (Fig. 3). Where there were greater breast cancer event rates in premenopausal women with elevated BPU (Fig. 3A), this was not statistically significant. In postmenopausal women, higher rates of breast cancer in women with elevated BPU occurred early in follow-up and persisted throughout the following 10 years (Fig. 3B).
Fig. 2 –
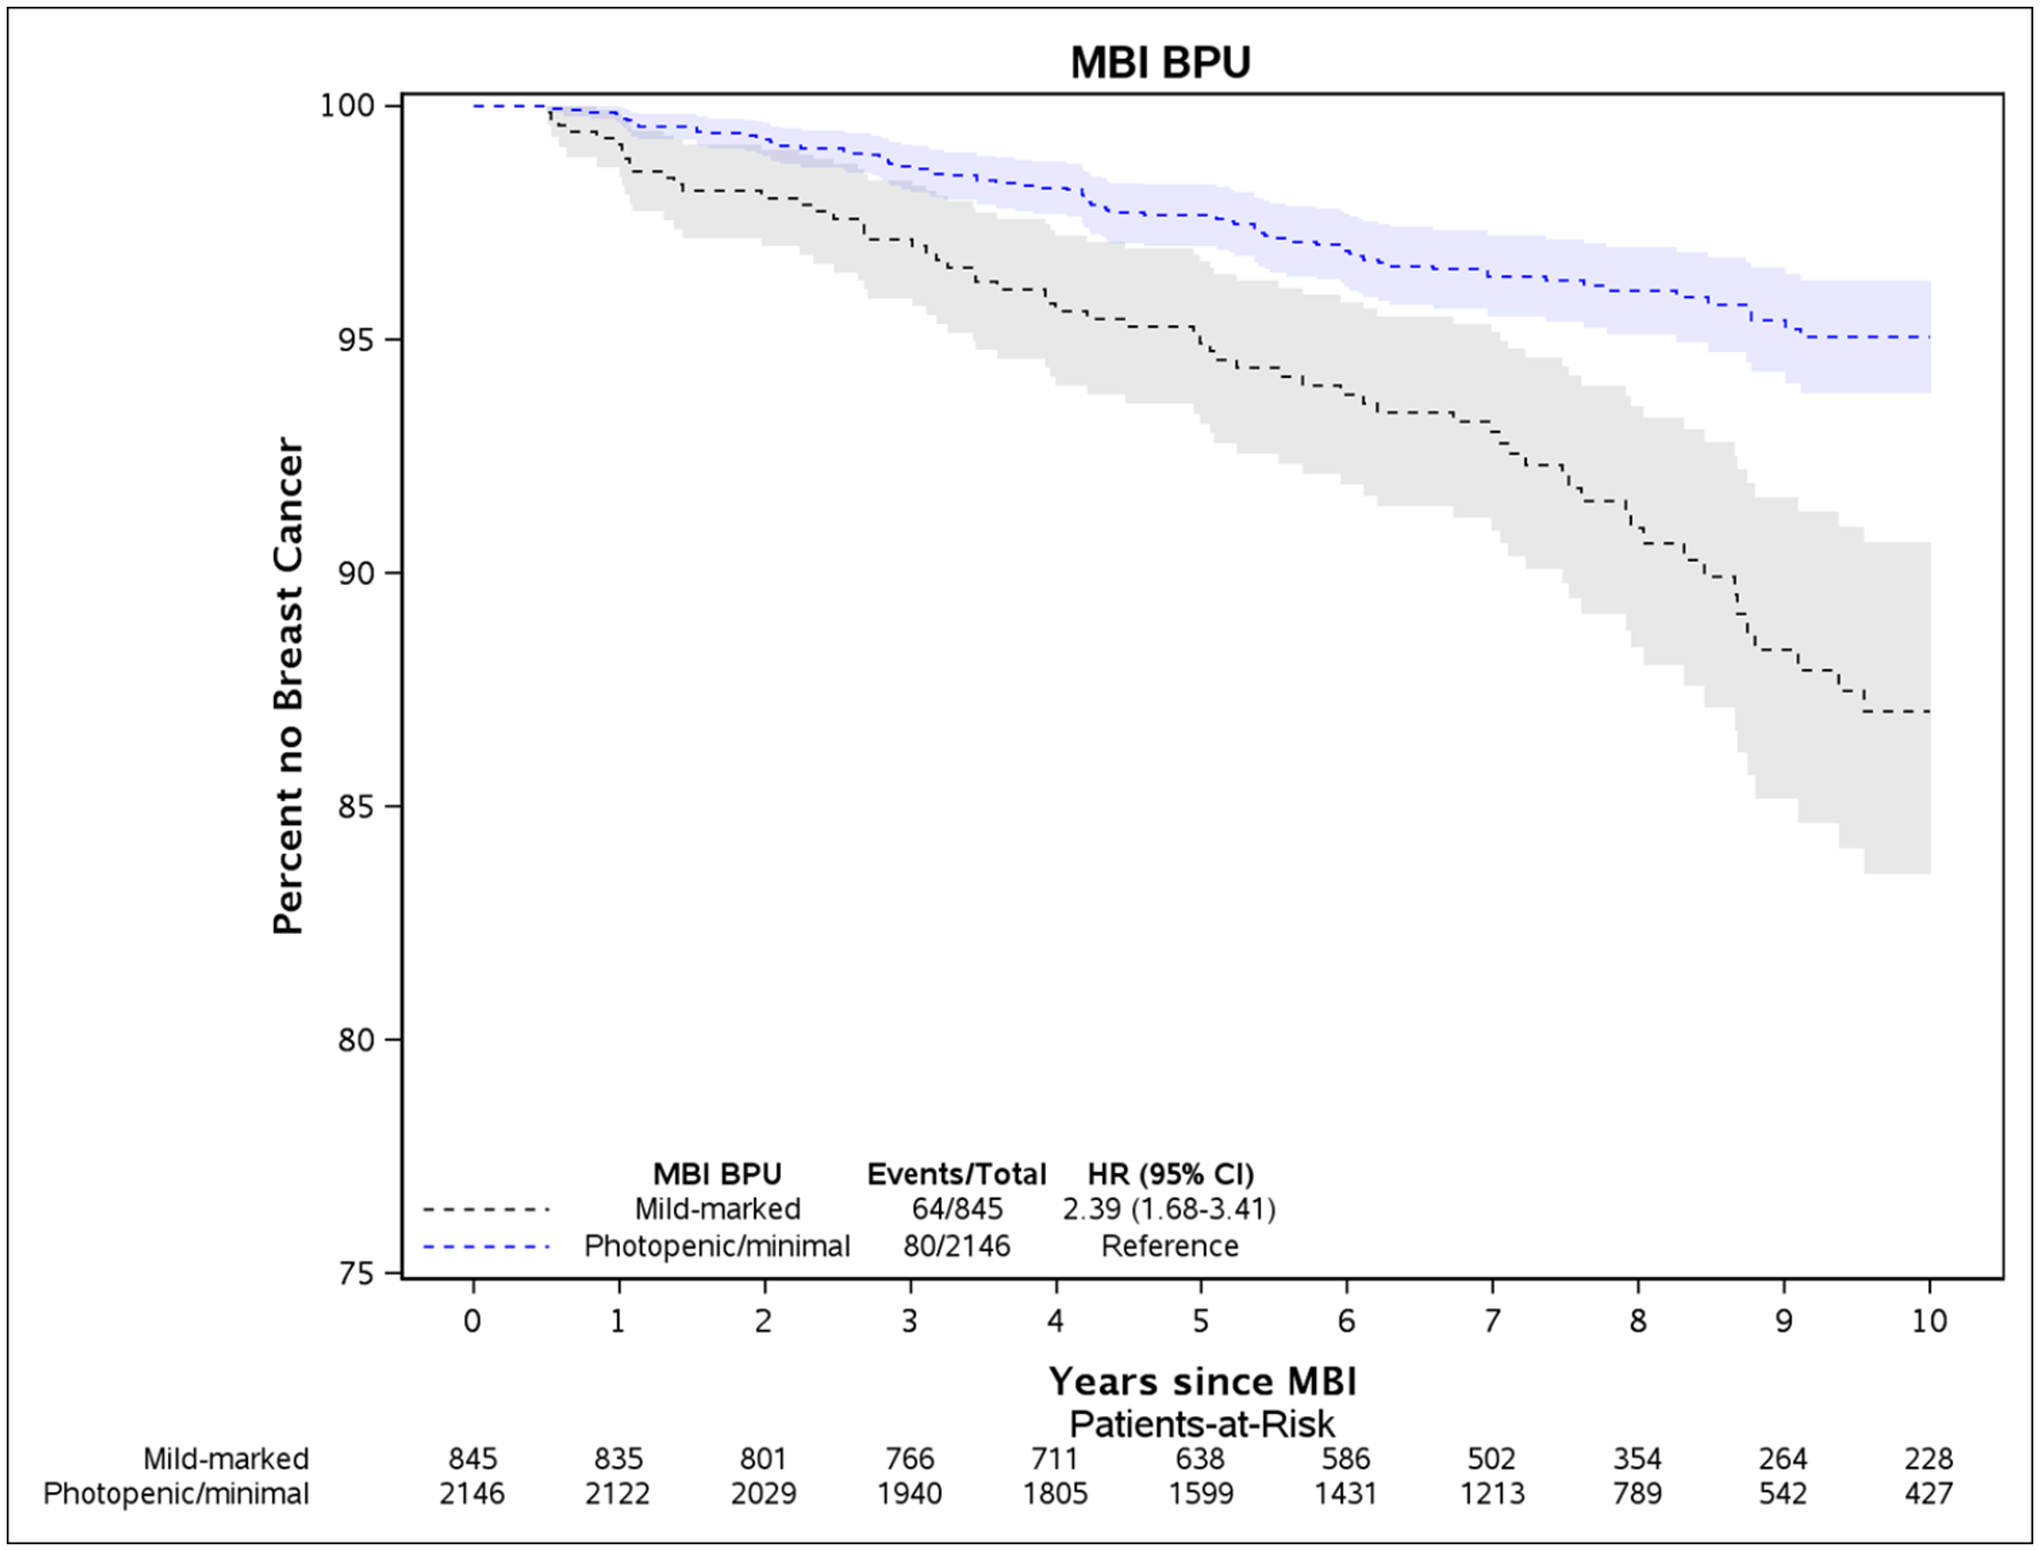
Kaplan-Meier plot of time until breast cancer diagnosis and 95% confidence intervals between elevated BPU (mild, moderate, or marked) compared to low BPU (photopenic or minimal), adjusted for age and body mass index at time of MBI.
Fig. 3 –
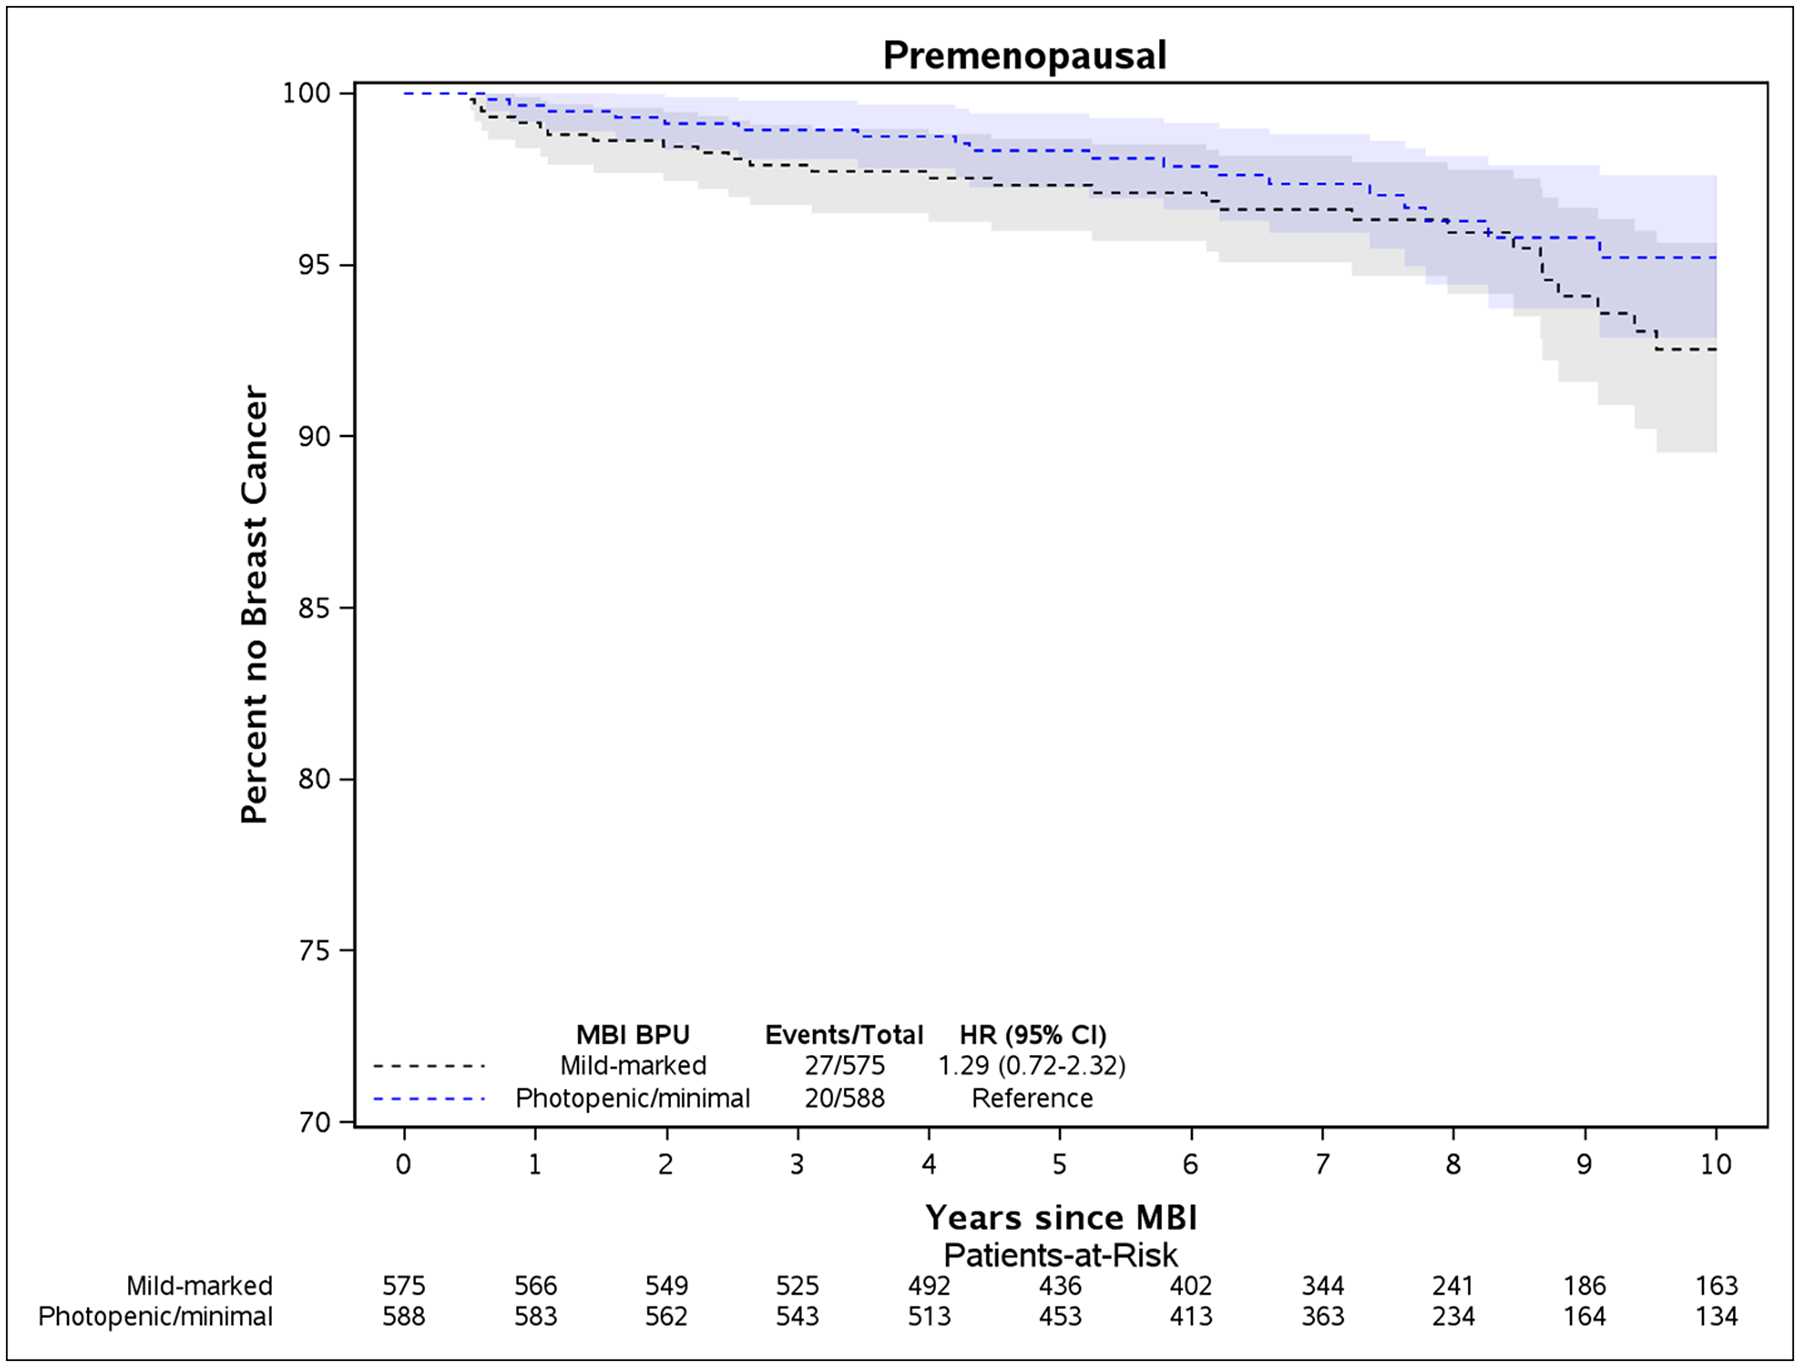
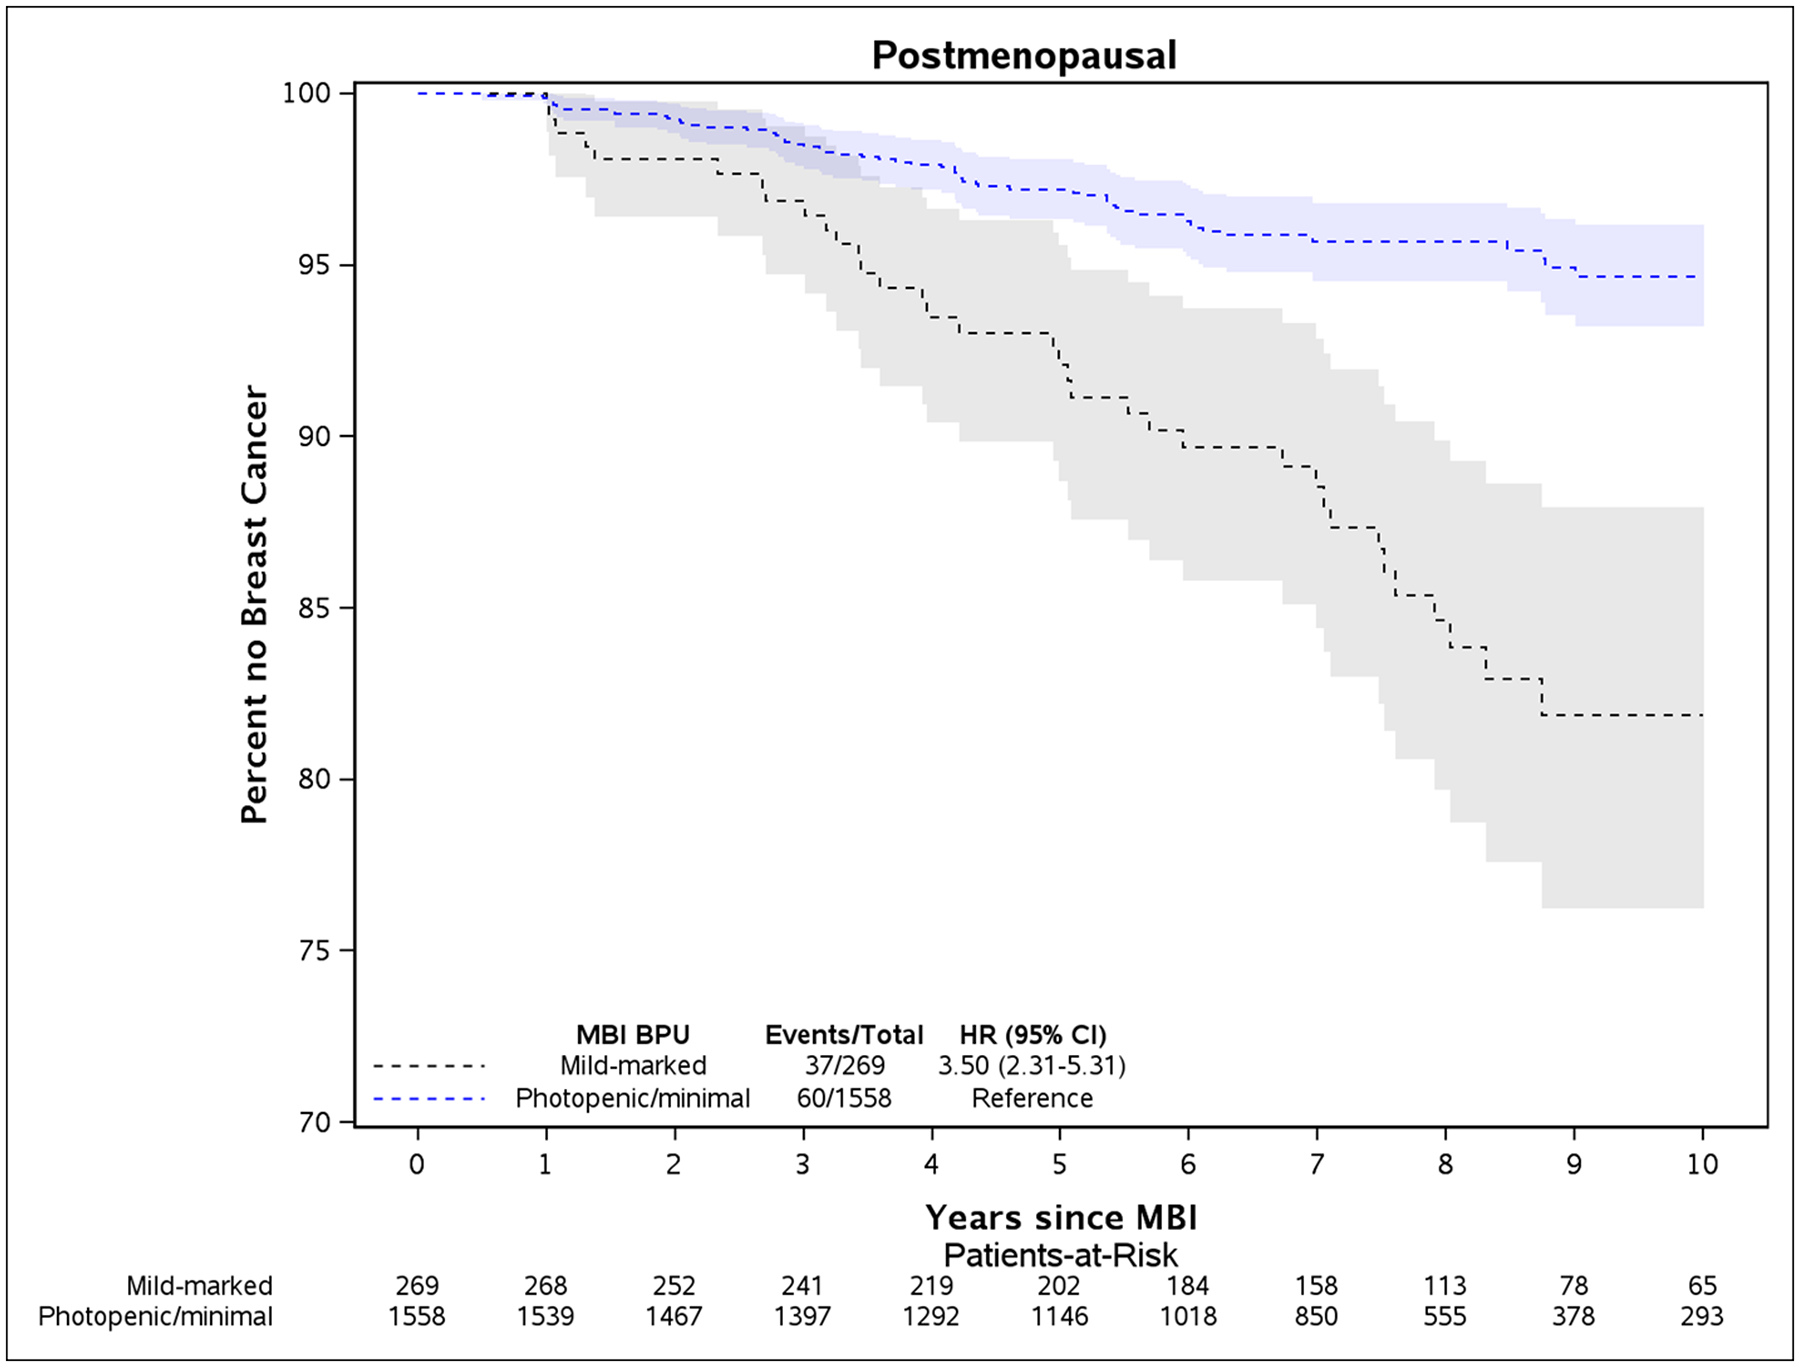
Kaplan-Meier plot of time until breast cancer diagnosis and 95% confidence intervals between elevated BPU (mild, moderate, or marked) compared to low BPU (photopenic or minimal), adjusted for age and body mass index at time of baseline MBI. Plots are for women who were premenopausal (panel A) and postmenopausal (panel B) at baseline MBI.
As shown in Table 3, postmenopausal women with elevated BPU were at approximately 3.3 times the risk of women with low BPU, in both subsets of mammographically dense breasts (HR=3.3, p<0.001) and non-dense breasts (HR = 3.3, p=0.02). In the subset of postmenopausal women with extremely dense breasts, those with elevated BPU were at 8.5 times greater risk than those with low BPU (HR=8.5, p<0.001). Elevated BPU was associated with higher risk in both postmenopausal women currently taking hormone therapy (HR=11.0, p=0.002) and those who were not (HR=3.8, p<0.001).
Elevated BPU’s risk was similar by family history (HR=2.4, p<0.001 vs. 2.4, p<0.001 in women with and without first degree family history). BPU was associated with risk among women with Gail model or BCSC model five-year risk of at least 1.67% (HR=2.4, p<0.001 and HR=3.2, p<0.001) (Table 3), which is the threshold used to determine eligibility for tamoxifen in the Breast Cancer Prevention Trial [22]. Risk estimates were elevated but not statistically significant in the subgroups of 100 women with a prior biopsy showing atypia or lobular carcinoma in situ (HR=1.7, p=0.42) and 233 women presenting for diagnostic MBI (HR=1.8, p=0.2), although power was limited due to small size of these subgroups.
Absolute Risk and BPU
The average five-year absolute risk for breast cancer of the overall cohort was 3.0% (CI 2.3, 3.6). For invasive cancers only, the average five-year absolute risk was 2.1% (CI 1.6, 2.6). Absolute risk of breast cancer differed by BPU level: women with elevated BPU had five-year absolute risk of 4.3% (CI 2.9, 5.7) compared to 2.5% (CI 1.8, 3.1) for those with low BPU (Table 3). For nearly all subgroups, five-year absolute risk estimates were greater in magnitude for women with elevated BPU relative to those with low BPU; the only exception was premenopausal women with non-dense breasts. Significantly higher five-year absolute risk estimates were found for women with elevated BPU, compared to women with low BPU, for three subgroups: postmenopausal women (7.7% vs. 2.8%), postmenopausal women with dense breasts (8.1% vs. 2.8%), and women with BCSC model five-year risk ≥1.67% (5.8% vs. 2.0%). The lowest five-year absolute risk of 0.8% was found in postmenopausal women using hormone therapy and having low BPU, while those on hormone therapy with elevated BPU had an absolute risk of 4.4%.
Impact of BPU on Discriminatory Accuracy
Discriminatory accuracy results are shown in Table 4. For the overall cohort, the C-statistic for models including BPU (low vs. elevated) and Gail or BCSC risk score was not significantly different from that with Gail risk score (p=0.23) or BCSC risk score (p=0.10), alone. However, in the postmenopausal subset, addition of BPU significantly increased discriminatory accuracy for invasive breast cancer, relative to the Gail model alone (C-statistic 65.1 vs 59.1, p = 0.04) and relative to the BCSC risk score alone (C-statistic 66.4 vs. 60.4, p=0.04). In the premenopausal subset, addition of BPU resulted in higher magnitude of the C-statistic but results were not statistically significant (p=0.20 and p=0.11).
Table 4.
Discriminatory accuracy in estimating five-year risk of invasive breast cancer for Gail and BCSC models, with and without 2-category (low or elevated) background parenchymal uptake (BPU).
| Factors in Risk Model | C-statistic (95% CI) | Difference (95% CI) | P-value |
|---|---|---|---|
| All Women | |||
| Gail risk score | 59.0 (54.2, 63.8) | - | |
| Gail risk score + BPU | 62.5 (58.0, 66.9) | 3.5 (−2.2, 9.2) | 0.23 |
| BCSC risk score | 60.3 (55.2, 65.1) | - | |
| BCSC risk score + BPU | 64.8 (60.1, 69.3) | 4.5 (−0.9, 9.9) | 0.10 |
| Postmenopausal Women | |||
| Gail risk score | 59.1 (53.8, 64.2) | - | |
| Gail risk score + BPU | 65.1 (58.9, 70.7) | 5.9 (0.2, 11.6) | 0.04 |
| BCSC risk score | 60.4 (54.6, 66.2) | - | |
| BCSC risk score + BPU | 66.4 (60.2, 72.0) | 6.0 (0.3, 11.8) | 0.04 |
| Premenopausal Women | |||
| Gail risk score | 52.6 (42.1, 64.5) | - | |
| Gail risk score + BPU | 60.1 (50.0, 69.3) | 7.5 (−3.9, 19.0) | 0.20 |
| BCSC risk score | 53.2 (45.3, 61.4) | - | |
| BCSC risk score + BPU | 61.3 (52.8, 69.5) | 8.1 (−1.7, 18.0) | 0.11 |
Reader Agreement in BPU
Intrareader agreement, assessed as percent agreement and unweighted kappa, was 70% (7/10) and κ=0.62 for one reader and 70% (7/10) and κ=0.63 for the other reader for the full 5-category variable of BPU; 100% (10/10) intrareader agreement (κ=1) was obtained for both readers for the combined 2-category BPU (low vs. elevated). Interreader agreement for the readers’ first batch of studies was 100% (10/10, κ=1) for both 5-category and 2-category BPU. Interreader agreement for each readers’ last batch of studies was 80% (8/10, κ=0.73) for 5-category BPU and 100% (10/10, κ=1) for 2-category BPU.
Discussion
In this first cohort study of background parenchymal uptake (BPU) on molecular breast imaging (MBI) with breast cancer, we confirmed that BPU is independently associated with breast cancer in a multivariable model and also improves discriminatory accuracy of an existing risk model that incorporates breast density. We found elevated BPU to be associated with an overall 2.4 times greater risk of breast cancer. This association was driven by the stronger association of BPU and breast cancer among postmenopausal women (HR = 3.5). While there was a trend of greater breast cancer rates in premenopausal women with elevated BPU, the risk association was smaller in magnitude and not statistically significant in the premenopausal subgroup (HR = 1.3). For postmenopausal women, risk models including BPU improved discriminatory accuracy relative to Gail risk score or BCSC risk score alone, suggesting that BPU offers additional risk information beyond established risk factors, including family history and mammographic density.
Our cohort, which largely comprised women with mammographically dense breasts presenting for supplemental screening MBI, had an average five-year absolute risk of 3.0%. However, absolute risk was greater in magnitude for women with elevated BPU compared to low BPU in the overall cohort (4.3% vs. 2.5%) and within nearly all subgroups examined. The greatest difference in absolute risk was among postmenopausal women with dense breasts, where those with elevated BPU had a five-year absolute risk of 8.1%, compared to 2.8% for those with low BPU. These findings have important clinical implications given recommendations that providers discuss the use of endocrine therapy to reduce breast cancer risk in women with five-year projected absolute risk ≥1.67%, and that women most likely to benefit include those with five-year risk ≥3% [24]. Our results provide suggestive evidence that postmenopausal women with elevated BPU on MBI may be more likely to benefit from endocrine therapy.
At our institution, MBI is offered to women with dense breasts who seek supplemental screening but do not meet the high risk criteria to warrant breast MRI screening (e.g. >20% lifetime risk by familial risk models [25]) or cannot undergo MRI for other reasons, such as claustrophobia, implanted devices, or cost concerns. Interest in MBI is growing as its advantages – a rapid learning curve for radiologists, favorable cost profile, and relatively low recall rates and high positive predictive value compared to other supplemental modalities – are reported [18, 26]. Across studies examining MBI in prevalence (first) round screening of women with dense breasts, MBI has consistently provided an incremental cancer detection rate of 7 to 9 cancers per 1000 women screened after 2D mammography or tomosynthesis [27–30]. Although concerns about radiation exposure from MBI have limited its acceptance in practice, MBI is now performed at administered activities (8 mCi Tc-99m sestamibi or less) considered safe for routine screening and with risk estimates that overlap those of mammography[31]. Nevertheless, ongoing work aims to further reduce the radiation dose of MBI [32].
These latest results add to the growing body of literature examining the role of functional imaging techniques, such as MBI and MRI, to improve risk prediction along with cancer detection, particularly among women with mammographically dense breasts. The mechanism of Tc-99m sestamibi uptake in fibroglandular tissue on MBI is not entirely clear, but sestamibi is known to be sequestered in cellular mitochondria of tumors and its retention is related to perfusion and cell viability [33]. In context of MRI, gadolinium enhancement in tumors correlates with angiogenic and protease activity (i.e. tissue alterations that signify cell proliferation and metastatic growth) [34]. Thus, higher levels of BPU or BPE may indicate fibroglandular tissue with heightened perfusion, proliferation, and hormonal responsiveness, and therefore predisposed to future cancer development.
Like BPE, BPU is influenced by hormonal factors, including hormone therapy, antiestrogens, and menstrual cycle [35–37]. A previous study reported approximately one-third of premenopausal women showing an increase in BPU level from follicular to luteal cycle phase [37]. As we were unable to account for cycle phase in our analyses, these fluctuations may partially explain the lack of a significant association of BPU and breast cancer observed in premenopausal women. It may also be that elevated BPU reflects expected behavior of proliferative fibroglandular tissue in the premenopausal breast and minimally impacts risk.
In postmenopausal women, however, we hypothesize that elevated BPU reflects fibroglandular tissue that hasn’t undergone expected reduction in proliferation and age-related lobular involution but is still “functionally active” and at greater risk for breast cancer [38]. When analysis was limited to postmenopausal women not taking hormone therapy, BPU remained a risk factor, suggesting that the association observed among postmenopausal women was not merely an artifact of hormonal influences on fibroglandular tissue. Interestingly, the lowest risk subgroup in the study was postmenopausal women currently taking hormone therapy at MBI, who also had low BPU (absolute five-year risk of 0.8%). This finding suggests that low BPU might identify a subset of women with breast tissue not responsive to hormones and therefore not at higher breast cancer risk due to hormone therapy. More work is needed to examine the potential role of BPU in this setting.
Our study had limitations. First, BPU interpretation was performed by two readers and was subjective. However, high intra- and inter-reader agreement in BPU was found in this study and consistency in BPU assessment over time has been previously shown [12, 20]. A quantitative BPU measure and an automated tool for classifying BPU may improve the robustness of BPU assessments and thus improve risk prediction [11, 20]. Second, we constrained our analysis to include only incident cancer. This design allowed us to establish temporality, with BPU as a risk factor for future breast cancer and also avoided bias in readers’ interpretation due to presence of cancer or treatment effects. However, it is possible that some breast cancer events were prevalent at MBI, but masked by BPU or simply undetected. The 4.2-year median time to diagnosis suggests that most cancer cases developed after baseline MBI. Third, we were not able characterize breast cancer risk of our cohort by the Tyrer-Cuzick model, a familial model recommended by American College of Radiology to determine eligibility for breast MRI screening [25], as detailed family pedigree (including unaffected relatives) needed for accurate use of this model was unavailable. However, our study provided evidence that BPU provides additional risk information beyond the factors considered in BCSC and Gail models, and even significantly improved the c-statistic relative to Gail and BCSC 5-year risk alone for postmenopausal women. We also had limited diversity in our population, with over 95% non-Hispanic white women. Finally, further work is needed to the examine association of changes in BPU over time with breast cancer risk and to validate our results in external cohorts, including those with differing race and ethnicity.
Conclusion
In summary, this cohort study confirmed that background parenchymal uptake on molecular breast imaging is independently associated with breast cancer. This association was strongest among postmenopausal women and was not significant in the premenopausal subset. Background parenchymal uptake provides incremental discrimination in breast cancer risk prediction for postmenopausal women when combined with the Gail model or BCSC model, which incorporates breast density. Postmenopausal women with dense breasts and elevated BPU were identified as having particularly high absolute risk at which additional screening or preventive options should be considered.
Highlights.
Key finding:
Among postmenopausal women with dense breasts, those with elevated BPU on MBI have over 3 times risk of breast cancer (HR=3.3 [CI 2.0, 5.1]) and higher five-year absolute risk (8.1% [CI 4.3, 11.8]) compared to those with low BPU (2.8% [CI 1.8, 3.9]).
Importance:
Postmenopausal women with elevated BPU on MBI have a five-year absolute risk that warrants discussion of additional breast cancer screening or prevention options.
Acknowledgments
The authors thank Lacey Ellingson, Tiffinee Swanson, Thuy Tran, Courtney Solberg, Aaron Norman, Austin Kennedy, David Lake, and the Mayo Clinic Survey Research Center for essential contributions to data collection and management for this study.
Funding
This work was supported by grants from the National Cancer Institute at the National Institutes of Health (R21 CA 197752); the National Center for Advancing Translational Sciences (UL1 TR000135); Mayo Clinic Center for Individualized Medicine; and Mayo Clinic Cancer Center Fraternal Order of Eagles Cancer Research Fund.
Footnotes
Author Disclosures
Two authors of this study (C.B. Hruska and M.K. O’Connor) receive royalties for licensed technologies per agreement between Mayo Clinic and CMR Naviscan, a manufacturer of MBI systems. No other authors have conflicts to disclose.
IRB Statement
This retrospective cohort study was HIPAA-compliant and approved by our institutional review board, which issued a waiver of consent.
References
- 1.Keating NL, Pace LE. New Federal Requirements to Inform Patients About Breast Density: Will They Help Patients? JAMA 2019; [DOI] [PubMed] [Google Scholar]
- 2.Sprague BL, Gangnon RE, Burt V, et al. Prevalence of Mammographically Dense Breasts in the United States. Journal of the National Cancer Institute 2014; 106 [DOI] [PMC free article] [PubMed] [Google Scholar]
- 3.Brentnall AR, Harkness EF, Astley SM, et al. Mammographic density adds accuracy to both the Tyrer-Cuzick and Gail breast cancer risk models in a prospective UK screening cohort. Breast Cancer Research 2015; 17:147. [DOI] [PMC free article] [PubMed] [Google Scholar]
- 4.Berg WA, Zhang Z, Lehrer D, et al. Detection of breast cancer with addition of annual screening ultrasound or a single screening MRI to mammography in women with elevated breast cancer risk. JAMA 2012; 307:1394–1404 [DOI] [PMC free article] [PubMed] [Google Scholar]
- 5.Bakker MF, de Lange SV, Pijnappel RM, et al. Supplemental MRI Screening for Women with Extremely Dense Breast Tissue. N Engl J Med 2019; 381:2091–2102 [DOI] [PubMed] [Google Scholar]
- 6.Hruska CB. Molecular Breast Imaging for Screening in Dense Breasts: State of the Art and Future Directions. AJR Am J Roentgenol 2017; 208:275–283 [DOI] [PubMed] [Google Scholar]
- 7.Sippo DA, Rutledge GM, Burk KS, et al. Effect of Background Parenchymal Enhancement on Cancer Risk Across Different High-Risk Patient Populations Undergoing Screening Breast MRI. American Journal of Roentgenology 2019; 212:1412–1418 [DOI] [PubMed] [Google Scholar]
- 8.Dontchos BN, Rahbar H, Partridge SC, et al. Are Qualitative Assessments of Background Parenchymal Enhancement, Amount of Fibroglandular Tissue on MR Images, and Mammographic Density Associated with Breast Cancer Risk? Radiology 2015; 276:371–380 [DOI] [PMC free article] [PubMed] [Google Scholar]
- 9.King V, Brooks JD, Bernstein JL, Reiner AS, Pike MC, Morris EA. Background parenchymal enhancement at breast MR imaging and breast cancer risk. Radiology 2011; 260:50–60 [DOI] [PMC free article] [PubMed] [Google Scholar]
- 10.Arasu VA, Miglioretti DL, Sprague BL, et al. Population-Based Assessment of the Association Between Magnetic Resonance Imaging Background Parenchymal Enhancement and Future Primary Breast Cancer Risk. J Clin Oncol 2019:JCO1800378 [DOI] [PMC free article] [PubMed] [Google Scholar]
- 11.Hruska CB, Geske JR, Swanson TN, et al. Quantitative background parenchymal uptake on molecular breast imaging and breast cancer risk: a case-control study. Breast Cancer Res 2018; 20:46. [DOI] [PMC free article] [PubMed] [Google Scholar]
- 12.Hruska CB, Scott CG, Conners AL, et al. Background parenchymal uptake on molecular breast imaging as a breast cancer risk factor: a case-control study. Breast Cancer Res 2016; 18:42. [DOI] [PMC free article] [PubMed] [Google Scholar]
- 13.Phipps AI, Ichikawa L, Bowles EJ, et al. Defining menopausal status in epidemiologic studies: A comparison of multiple approaches and their effects on breast cancer rates. Maturitas 2010; 67:60–66 [DOI] [PMC free article] [PubMed] [Google Scholar]
- 14.NIH National Cancer Institute. The Breast Cancer Risk Assessment Tool, https://bcrisktool.cancer.gov/. Accessed: December 12, 2018
- 15.NCI-funded Breast Cancer Surveillance Consortium (P01 CA154292 and HHSN261201100031C). Breast Cancer Surveillance Consortium Risk Calculator, https://tools.bcsc-scc.org/BC5yearRisk Accessed: October 15, 2019
- 16.Swanson T, Tran TD, Ellingson L, et al. Best Practices in Molecular Breast Imaging: A Guide for Technologists. J Nucl Med Technol 2018; [DOI] [PubMed] [Google Scholar]
- 17.Hruska CB, Weinmann AL, Tello Skjerseth CM. Proof of concept for low-dose molecular breast imaging with a dual-head CZT gamma camera. Part II. Evaluation in patients. Med Phys 2012; 39:3476. [DOI] [PMC free article] [PubMed] [Google Scholar]
- 18.Conners AL, Hruska CB, Tortorelli CL, et al. Lexicon for standardized interpretation of gamma camera molecular breast imaging: observer agreement and diagnostic accuracy. Eur J Nucl Med Mol Imaging 2012; 39:971–982 [DOI] [PubMed] [Google Scholar]
- 19.Sickles EA, D’Orsi CJ, Bassett LW. ACR BI-RADS® Mammography. In: ACR BI-RADS® Atlas, Breast Imaging Reporting and Data System., 5th ed. Reston, VA.: American College of Radiology, 2013 [Google Scholar]
- 20.Carter RE, Attia ZI, Geske JR, et al. Classification of Background Parenchymal Uptake on Molecular Breast Imaging Using a Convolutional Neural Network. JCO Clinical Cancer Informatics 2019:1–11 [DOI] [PMC free article] [PubMed] [Google Scholar]
- 21.Uno H, Cai T, Pencina MJ, D’Agostino RB, Wei LJ. On the C-statistics for evaluating overall adequacy of risk prediction procedures with censored survival data. Statistics in medicine 2011; 30:1105–1117 [DOI] [PMC free article] [PubMed] [Google Scholar]
- 22.Fisher B, Costantino JP, Wickerham DL, et al. Tamoxifen for prevention of breast cancer: report of the National Surgical Adjuvant Breast and Bowel Project P-1 Study. J Natl Cancer Inst 1998; 90:1371–1388 [DOI] [PubMed] [Google Scholar]
- 23.McCarthy AM, Guan Z, Welch M, et al. Performance of Breast Cancer Risk-Assessment Models in a Large Mammography Cohort. JNCI: Journal of the National Cancer Institute 2019; 112:489–497 [DOI] [PMC free article] [PubMed] [Google Scholar]
- 24.Visvanathan K, Fabian CJ, Bantug E, et al. Use of Endocrine Therapy for Breast Cancer Risk Reduction: ASCO Clinical Practice Guideline Update. J Clin Oncol 2019; 37:3152–3165 [DOI] [PubMed] [Google Scholar]
- 25.Saslow D, Boetes C, Burke W, et al. American Cancer Society guidelines for breast screening with MRI as an adjunct to mammography. CA Cancer J Clin 2007; 57:75–89 [DOI] [PubMed] [Google Scholar]
- 26.Hruska CB, Conners AL, Jones KN, et al. Diagnostic workup and costs of a single supplemental molecular breast imaging screen of mammographically dense breasts. AJR Am J Roentgenol 2015; 204:1345–1353 [DOI] [PMC free article] [PubMed] [Google Scholar]
- 27.Rhodes DJ, Hruska CB, Phillips SW, Whaley DH, O’Connor MK. Dedicated dual-head gamma imaging for breast cancer screening in women with mammographically dense breasts. Radiology 2011; 258:106–118 [DOI] [PubMed] [Google Scholar]
- 28.Rhodes DJ, Hruska CB, Conners AL, et al. Journal club: molecular breast imaging at reduced radiation dose for supplemental screening in mammographically dense breasts. AJR Am J Roentgenol 2015; 204:241–251 [DOI] [PMC free article] [PubMed] [Google Scholar]
- 29.Shermis RB, Wilson KD, Doyle MT, et al. Supplemental Breast Cancer Screening With Molecular Breast Imaging for Women With Dense Breast Tissue. AJR Am J Roentgenol 2016; 207:450–457 [DOI] [PubMed] [Google Scholar]
- 30.Rhodes D, Hunt K, Conners A, et al. Abstract PD4–05: Molecular breast imaging and tomosynthesis to eliminate the reservoir of undetected cancer in dense breasts: The Density MATTERS trial. Cancer Research 2019; 79:PD4–05-PD04–05 [Google Scholar]
- 31.Brown M, Covington MF. Comparative benefit to risk of molecular breast imaging, 2D full-field digital mammography with and without tomosynthesis, and synthetic mammography with tomosynthesis. Radiology: Imaging Cancer 2019; [DOI] [PMC free article] [PubMed] [Google Scholar]
- 32.Tao AT, Hruska CB, Conners AL, et al. Dose Reduction in Molecular Breast Imaging With a New Image-Processing Algorithm. American Journal of Roentgenology 2019; 214:185–193 [DOI] [PubMed] [Google Scholar]
- 33.Moretti J-L, Hauet N, Caglar M, Rebillard O, Burak Z. To use MIBI or not to use MIBI? That is the question when assessing tumour cells. European journal of nuclear medicine and molecular imaging 2005; 32:836–842 [DOI] [PubMed] [Google Scholar]
- 34.Kuhl CK, Strobel K, Bieling H, Leutner C, Schild HH, Schrading S. Supplemental Breast MR Imaging Screening of Women with Average Risk of Breast Cancer. Radiology 2017; 283:361–370 [DOI] [PubMed] [Google Scholar]
- 35.Hruska CB, Rhodes DJ, Conners AL, et al. Background Parenchymal Uptake During Molecular Breast Imaging and Associated Clinical Factors. American Journal of Roentgenology 2015; 204:W363–W370 [DOI] [PMC free article] [PubMed] [Google Scholar]
- 36.Hruska CB, Hunt KN, Conners AL, et al. Impact of short-term low-dose tamoxifen on molecular breast imaging background parenchymal uptake: a pilot study. Breast Cancer Res 2019; 21:38. [DOI] [PMC free article] [PubMed] [Google Scholar]
- 37.Hruska CB, Conners AL, Vachon CM, et al. Effect of menstrual cycle phase on background parenchymal uptake at molecular breast imaging. Acad Radiol 2015; 22:1147–1156 [DOI] [PMC free article] [PubMed] [Google Scholar]
- 38.Radisky DC, Visscher DW, Frank RD, et al. Natural history of age-related lobular involution and impact on breast cancer risk. Breast Cancer Res Treat 2016; 155:423–430 [DOI] [PMC free article] [PubMed] [Google Scholar]


