

Abstract
Objective:
To determine class and sex differences in mandibular growth and modeling.
Materials and Methods:
A mixed-longitudinal sample of 130 untreated French-Canadian adolescents, 77 (45 boys and 32 girls) with Class I (normal or abnormal) occlusion and 53 (26 boys and 27 girls) with Class II division 1 malocclusion, was used. Based on eight landmarks, eight traditional measurements were used to compare the anteroposterior position of the maxilla and mandible, relationship between the jaws, and mandibular size. Mandibular superimpositions were used to compare the horizontal and vertical changes of condylion, gonion, and menton.
Results:
While there were no differences in maxillary position based on the SNA angle, Class IIs had more retrognathic mandibles than did Class Is. Total mandibular length was greater in Class Is than in Class IIs at 15 years of age. Superior and total growth and modeling changes at condylion and gonion, respectively, were greater for Class Is than Class IIs. Boys were more prognathic than girls; they had larger mandibles and exhibited greater size increases and growth changes than girls did.
Conclusions:
There are both class and sex differences in mandibular growth and modeling.
Keywords: Craniofacial, Growth, Class II malocclusion, Normal occlusion, Mandibular growth
INTRODUCTION
Class II malocclusion, classified based on the distal relationship of the mandibular molar relative to the maxillary molar,1 affects a substantial numbers of individuals. The National Health and Nutrition Examination Survey estimated, based on overjet, that approximately 14.7% of the US population has Class II malocclusion, with prevalence decreasing from 22.6% between 8 and 11 years of age, to 15.6% between 12 and 17 years of age and then to 13.4% between 18 and 50 years of age.2 The National Center for Health Statistics reported that 20.4% of 6- to 11-year-olds have bilateral Class II molar relationships,3 compared with 14.5% of 12- to 17-year-olds.4
Most studies that classified malocclusion based on dental relationships have reported no differences between Class Is and IIs in maxillary AP position and mandibular retrusion among Class IIs.5–7 When individuals whose AP skeletal relationships worsened over time (ie, whose AP discrepancies increase) were compared with those whose relationships improved, the differences were again due to mandibular, and not maxillary, growth.8
Based on studies evaluating mandibular size and growth changes, it remains unclear exactly why Class IIs tend to be retrusive. Shorter total and mandibular corpus lengths have been reported among Class IIs compared with Class Is,9–12 although no differences have also been found.7,12–14 Some studies have shown greater growth in total mandibular length among Class Is than Class IIs,7,9,12 while others have not.10,11 Greater increases in mandibular corpus length among Class Is than Class IIs have been demonstrated by some7,9 but not all of the studies.13,14 Ramus heights have been reported to be shorter10,15 and no different9,12,14 among Class IIs than Class Is. Growth increases in ramus height have also been shown to be both different12 and not different.9,14,15
To determine the growth differences between Class Is and Class IIs, individual landmarks must be examined. Evaluating landmarks, rather than distances and angles, makes it possible to quantify the changes that take place independent of the growth changes occurring at other sites. For example, increases of ramus height depend on the growth at condylion and resorption at gonion. Similarly, growth direction influences linear dimensions; 10 mm of vertical condylar growth affects overall mandibular length less than 10 mm of posteriorly directed growth (Figure 1). Class differences in the growth of individual landmarks, which make it possible to delineate growth direction, have not been previously evaluated.
Figure 1.
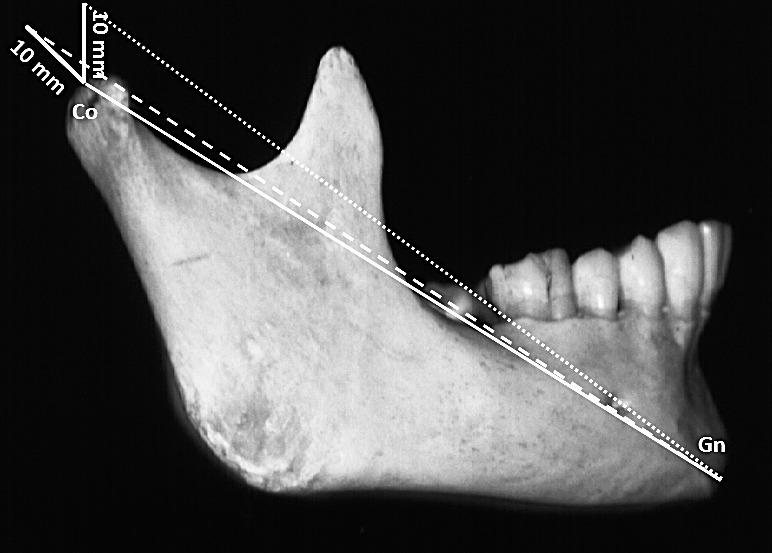
Same amounts (10 mm) of condylar growth (continuous lines) produce differences in total mandibular length (CoGn), depending on the growth direction. Initial CoGn (100 mm) (continuous line) increased to approximately 106 mm with vertical condylar growth (dotted line) and to approximately 110 mm with posterior condylar growth (dashed line).
To reconcile the existing inconsistencies and provide new comparisons based on the growth of individual landmarks, the present project was designed to evaluate longitudinal changes that occur during adolescence. The specific aims were to determine whether there are differences in mandibular growth between Class Is and Class IIs and to evaluate sex differences in mandibular growth. The null hypothesis was that there are no differences between groups.
MATERIALS AND METHODS
The data were derived from a mixed-longitudinal sample collected by the Human Growth Research Center, University of Montreal.16 Using a random-number generator, the sample was randomly chosen from 107 schools from three school districts representing the socioeconomic background of the larger population. The sample was restricted to adolescents with four French-Canadian grandparents. The sample included 71 boys and 59 girls, evaluated at 10 (T1) and 15 (T2) years of age. Approximately 7.1% and 13.9% of the observations had missing data at T1 and T2, respectively. The sample included adolescents classified as having Class I (normal or abnormal) occlusion or Class II division 1 malocclusion based on their molar and canine relationships (Table 1).
Table 1.
Cross-Tabulation Showing the Sample Sizes Based on Class and Sex

All cephalograms were traced and digitized by the same technician. Radiographic enlargement was 11.08%. Eight landmarks (Figure 2) were used to compute eight traditional measurements. Technical reliability of the landmarks ranged between 90% and 99%, with the horizontal aspect of the condylion having the largest error (Table 2). Four measures of jaw position (SNA, SNB, ANB, and MPA angle), three measures of mandibular size (CoGn, CoGo, GoGn), and the gonial angle were computed.
Figure 2.

Cephalometric landmarks digitized: (S) sella, (N) nasion, (Co) condylion, (Go) gonion, (Me) menton, (A) A-point, and (B) B-point. Horizontal and vertical measurements were obtained by registering on sella (S) and orienting on SN −7°.
Table 2.
Technical Reliability of the Landmarks

To describe growth and modeling of the mandibular landmarks, each subject's radiographs were superimposed on natural mandibular reference structures.17 Reliability of the mandibular superimpositions was 93%.18 Rectangular coordinates (X, Y) were used to describe the horizontal and vertical positions of each landmark. The mandibles were superimposed and the tracings were registered on the T1 sella and oriented using a horizontal reference line (RL), defined by the T1 sella-nasion minus 7° (Figure 2). For example, the horizontal change of condylion (Co_h) was measured parallel to the RL, and its vertical (Co_v) change was measured perpendicular to the RL. The hypotenuse √ (horizontal change2 + vertical change2) was calculated to define the total change for each landmark. Negative values indicated changes in the inferior and posterior directions; positive values indicated changes in the superior and anterior directions. Relative growth differences between the sexes and between the classes were computed as percentages. For example, the relative difference between Class IIs and Class Is was calculated as {[(Change Class Is – Change Class IIs)/Change Class IIs] × 100}.
Statistical Analysis
The measurements were transferred to SPSS software (version 19.0, SPSS, Chicago, Ill) for evaluation. Based on the skewness and kurtosis statistics, the variables were judged to be normally distributed. Paired t-tests were used to evaluate changes over time (ie, differences between 10 and 15 years of age). Two-way analysis of variance was used to compare the groups. A probability level of .05 was used to determine statistical significance.
RESULTS
Between 10 and 15 years of age, Class Is and Class IIs showed statistically significant (P < .05) decreases in the ANB angle, due primarily to increases in the SNB angle; they also demonstrated significant decreases in the mandibular plane (MPA) and gonial (CoGoMe) angles and increases in all three measures of mandibular size (Table 3). Both Class Is and IIs exhibited posterosuperior growth changes at condylion, posterosuperior modeling at gonion, and anteroinferior modeling at menton (Table 4).
Table 3.
Descriptive Statistics and Statistical Comparisons for Cephalometric Measures in Class I and Class II Subjects at Age 10 Years and 15 Years and Changes Between 10 and 15 Yearsa

Table 4.
Horizontal, Vertical, and Total Changes Between Dental Class I and Class II Subjects Based on Mandibular Superimposition, Oriented Relative to SN −7°

While boys showed small decreases in ANB angle and MPA, girls showed no significant changes (Table 5). Both sexes demonstrated significant decreases in the gonial angle as well as increases in ramus height, corpus length, and total mandibular length. Boys and girls showed statistically significant condylar growth and mandibular modeling between 10 and 15 years of age (Table 6).
Table 5.
Descriptive Statistics and Statistical Comparisons of Males and Females at Ages 10 Years and 15 Years and Changes Between 10 and 15 Years

Table 6.
Horizontal, Vertical, and Total Changes of Male and Female Subjects Based on Mandibular Superimposition, Oriented Relative to SN −7°

Class Differences
The ANB angle was significantly (P < .001) smaller in Class Is than in Class IIs at 10 and 15 years of age, due to differences in the SNB angle (Table 3). Total mandibular length (CoGn) was also significantly larger at 15 years in Class I than in Class II subjects, but there were no differences at 10 years of age. Neither the measures of jaw position nor size showed significant group differences in the changes that occurred between 10 and 15 years of age. Class Is showed significantly more superior and total condylar growth (≈16%) than Class IIs (Table 4). They also showed significantly greater superior (24%) and total (14%) modeling at gonion.
Sex Differences
At 10 and 15 years of age, boys had larger mandibles than girls (Table 5), with differences increasing significantly over time. The only other statistically significantly sex differences pertained to the SNA and SNB angles at 15 years of age, which were larger in boys than in girls, due to greater male increases between 10 and 15 years. Compared with girls, boys also had significantly greater (30%) superior and total condylar growth, greater (30%) posterosuperior modeling at gonion, and greater anterior (30%), vertical (24%), and total (23%) modeling at menton (Table 6).
DISCUSSION
As expected, the ANB angle was smaller (by approximately 2°) in Class Is than in Class IIs at both 10 and 15 years of age. While most studies have reported smaller ANB angles among untreated Class I than Class II subjects,7,12,13,15 Bishara reported no differences, which could have been due to the sample's age or the vertical growth patterns of the Class I sample.11 Approximately 75% of subjects with Class II dental malocclusion also have Class II skeletal relationships,19,20 indicating that the Class II dental malocclusion is primarily due to the skeletal discrepancies.
Group differences in the ANB angle were mainly due to mandibular retrusion. Subjects with Class I and II malocclusion had SNA angles that were comparable; Class IIs had SNB angles that were approximately 2° smaller than Class Is at 10 years and almost 2.5° smaller at 15 years. Mandibular retrusion of Class IIs has been previously shown to be the primary determinant of the ANB discrepancies when the classification is based on dental criteria.6,9,12 The mandible might be expected to be the primary determinant because it is the least mature structure in the craniofacial complex and, therefore, under the greatest environmental and epigenetic influence.21
Importantly, the mandibular plane angles of both Class I and Class II subjects were similar, as were the decreases in the mandibular plane angles over time. Ngan and coworkers7 also found no differences in the MPA between Class Is and IIs. Previous reports of greater vertical growth among Class IIs did not compare their samples to Class I controls.6,22 The lack of vertical discrepancies is important because mandible rotation has been closely associated with chin projection.17,23–25 If the Class II problem is primarily mandibular and retrusion is not due to vertical discrepancies, then there must either be mandibular growth deficiencies or differences in cranial base morphology. Larger cranial base lengths and angles have been reported for Class IIs than Class Is.26–28
Class II subjects have less condylar growth during adolescence than Class Is. Total and vertical condylar growths were approximately 16% less in the Class II sample (Figure 3A). Class differences in the growth of ramus height were much smaller (6.2%) than the differences in condylar growth. The difference can be explained by resorption at gonion. For every 1 mm that the condyles grew superiorly, resorption relocated gonion almost 0.5 mm.29,30 The Class differences in the growth direction of gonion over time (ie, slightly more posterior and less superior for Class IIs) reduces differences in ramus height (Figure 3B). Similar or slightly lesser amounts of vertical resorption at gonion have been previously shown to occur for every millimeter of superior condylar growth.29,30 The greater the inferior displacement, the greater the growth at condylion and resorption at gonion.30 The fact that ramus height underestimates the growth that occurs at condylion explains why this and other studies have found no differences in ramus height between adolescents with Class I and Class II malocclusions.11,14 The present study is the first to show significantly more condylar growth, based on mandibular superimpositions, among untreated Class Is than Class IIs.
Figure 3.

Chart representing the horizontal and vertical growth and modeling changes between 10 and 15 years of age based on mandibular superimposition. At 10 years of age, the initial position of the landmarks was at zero (X and Y). (A) Condylion changes. (B) Gonion changes.
The total mandibular length of Class IIs was significantly shorter at 15 years of age but not at 10 years. Stahl and coworkers12 also showed greater total length among older, but not younger, Class Is. Bishara et al.10 suggested that Class Is have larger mandibles in the mixed but not the permanent dentition, but their Class I mixed dentition subjects were significantly more hyperdivergent than their Class II subjects.
The SNA and SNB angles increased significantly in boys between 10 and 15 years of age and did not change in girls, resulting in angles that were 1.7%–2.2% larger among 15-year-old boys. Previous studies have not shown sex differences in the anteroposterior position of the jaws among either Class IIs or Class Is.10,31–33 Boys also showed significant decreases in the MPA, whereas girls did not. Nevertheless, there were no sex differences in the MPA at 10 and 15 years nor in the changes of the mandibular plane that occurred, as previously reported.10,31,32 This suggests that boys undergo more horizontal and less vertical growth than girls do.21
Male mandibles were consistently larger and grew more than female mandibles. Previous studies have reported sex differences at some ages but not others.10,13,31 Riolo et al.31 reported significant sex differences for total mandibular length and ramus height but not for corpus length, while others have found sex differences in corpus length.13,33,34 With respect to ramus height, both statistically significant33,35 and no differences34 have been reported. Sex differences increased between 10 and 15 years because boys have a more intense adolescent growth than girls.36,37
The sexual dimorphism identified between 10 and 15 years of age may be confounded by sex differences in the timing of adolescence. Peak adolescent velocity is usually attained at 13.6 ± 1.3 years of age for boys and at 11.8 ± 1.2 years of age for girls.37 As such, girls enter their adolescence phase of growth approximately 2 years before boys (ie, at approximately 10 years). As such, the 10-year-old estimates of dimorphism should not, on average, be affected by these maturational differences. If there were no sex differences in yearly growth rates during adolescence, these maturational differences might be expected to underestimate sex differences at 15 years of age, as well as the changes that occur between 10 and 15 years. However, boys have greater peak velocities than girls,36,37 making it difficult to determine exactly how sex differences in the timing of adolescence might be expected to affect the results of the present study.
CONCLUSIONS
Based on a sample of 130 untreated French-Canadian adolescents at 10 and 15 years of age:
Class IIs have larger ANB angles due to retrusive mandibles rather than protrusive maxillas.
Class IIs exhibit less vertical condylion growth and less gonial modeling than Class Is; condylar growth deficiencies among Class IIs resulted in shorter overall mandibular lengths at 15 years of age.
Boys are relatively more protrusive than girls; their mandibles are larger and grow more than female mandibles.
Acknowledgments
This research was supported by MRC grant No. MA-8917.
REFERENCES
- 1.Angle EH. Malocclusion of the Teeth 7th ed. Philadelphia, Pa: S.S. White Dental Mfg Co; 1907. [Google Scholar]
- 2.Proffit WR. Prevalence of malocclusion and orthodontic treatment need in the United States: estimates from the NHANES III survey. Int J Adult Orthod Orthognath Surg. 1998;13:97–106. [PubMed] [Google Scholar]
- 3.Kelly JE, Sanchez M, Van Kirk LE. Vital and Health Statistics series 11 number 130. Washington, DC: US Public Health Service; 1977. An assessment of the occlusion of the teeth of children: 6–11 years. [PubMed] [Google Scholar]
- 4.Kelly JE, Harvey CR. Vital and Health Statistics series 11 number 162. Washington, DC: US Public Health Service; 1977. An assessment of the occlusion of the teeth of youths: 12–17 years. [PubMed] [Google Scholar]
- 5.Hitchcock HP. A cephalometric description of Class II, Division 1 malocclusion. Am J Orthod. 1973;63:414–423. doi: 10.1016/0002-9416(73)90146-2. [DOI] [PubMed] [Google Scholar]
- 6.McNamara JA. Components of Class II malocclusion in children 8–10 years of age. Angle Orthod. 1981;51:177–202. doi: 10.1043/0003-3219(1981)051<0177:COCIMI>2.0.CO;2. [DOI] [PubMed] [Google Scholar]
- 7.Ngan PW, Byczek E, Sheick J. Longitudinal evaluation of growth changes in Class II Division 1 subjects. Semin Orthod. 1997;3:222–231. doi: 10.1016/s1073-8746(97)80055-2. [DOI] [PubMed] [Google Scholar]
- 8.Buschang PH, Martins J. Childhood and adolescent changes of skeletal relationships. Angle Orthod. 1998;68:199–206. doi: 10.1043/0003-3219(1998)068<0199:CAACOS>2.3.CO;2. [DOI] [PubMed] [Google Scholar]
- 9.Baccetti T, Franchi L, McNamara JA, Jr, Tollaro I. Early dentofacial features of Class II malocclusion: a longitudinal study from the deciduous through the mixed dentition. Am J Orthod Dentofacial Orthop. 1997;111:502–509. doi: 10.1016/s0889-5406(97)70287-7. [DOI] [PubMed] [Google Scholar]
- 10.Bishara SE, Jakobsen JR, Vorhies B, Bayati P. Changes in dentofacial structures in untreated Class II division 1 and normal subjects: a longitudinal study. Angle Orthod. 1997;67:55–66. doi: 10.1043/0003-3219(1997)067<0055:CIDSIU>2.3.CO;2. [DOI] [PubMed] [Google Scholar]
- 11.Bishara SE. Mandibular changes in persons with untreated and treated Class II division 1 malocclusion. Am J Orthod Dentofacial Orthop. 1998;113:661–673. doi: 10.1016/s0889-5406(98)70227-6. [DOI] [PubMed] [Google Scholar]
- 12.Stahl F, Baccetti T, Franchi L, McNamara JA., Jr Longitudinal growth changes in untreated subjects with Class II Division 1 malocclusion. Am J Orthod Dentofacial Orthop. 2008;134:125–137. doi: 10.1016/j.ajodo.2006.06.028. [DOI] [PubMed] [Google Scholar]
- 13.Riesmeijer AM, Prahl-Andersen B, Mascarenhas AK, Joo BH, Vig KW. A comparison of craniofacial Class I and Class II growth patterns. Am J Orthod Dentofacial Orthop. 2004;125:463–471. doi: 10.1016/j.ajodo.2003.05.012. [DOI] [PubMed] [Google Scholar]
- 14.Vásquez MJ, Baccetti T, Franchi L, McNamara JA., Jr Dentofacial features of Class II malocclusion associated with maxillary skeletal protrusion: a longitudinal study at the circumpubertal growth period. Am J Orthod Dentofacial Orthop. 2009;135:568.e1–7. doi: 10.1016/j.ajodo.2007.05.026. [DOI] [PubMed] [Google Scholar]
- 15.Baccetti T, Stahl F, McNamara JA., Jr Dentofacial growth changes in subjects with untreated Class II malocclusion from late puberty through young adulthood. Am J Orthod Dentofacial Orthop. 2009;135:148–154. doi: 10.1016/j.ajodo.2007.03.033. [DOI] [PubMed] [Google Scholar]
- 16.Demirjian A, Brault DM, Jenicek M. Etude comparative de la croissance de l'enfant canadien d'orige francais a Montreal. Can J Public Health. 1971;62:11–19. [PubMed] [Google Scholar]
- 17.Björk A, Skieller V. Normal and abnormal growth of the mandible: a synthesis of longitudinal cephalometric implant studies over a period of 25 years. Eur J Orthod. 1983;5:1–46. doi: 10.1093/ejo/5.1.1. [DOI] [PubMed] [Google Scholar]
- 18.Buschang PH, LaPalme L, Tanguay R, Demirjian A. The technical reliability of superimposition on cranial base and mandibular structures. Eur J Orthod. 1986;8:152–156. doi: 10.1093/ejo/8.3.152. [DOI] [PubMed] [Google Scholar]
- 19.Beresford JS. Tooth size and class distinction. Dent Pract. 1969;20:113–120. [PubMed] [Google Scholar]
- 20.Milacic M, Markovic M. A comparative occlusal and cephalometric study of dental and skeletal anteroposterior relationships. Br J Orthod. 1983;10:53–54. doi: 10.1179/bjo.10.1.53. [DOI] [PubMed] [Google Scholar]
- 21.Buschang PH, Baume RM, Nass GG. A craniofacial growth maturity gradient for males and females between 4 and 16 years of age. Am J Phys Anthropol. 1983;61:373–381. doi: 10.1002/ajpa.1330610312. [DOI] [PubMed] [Google Scholar]
- 22.Hunter J. The Natural History of the Human Teeth Explaining Their Structure Use Formation Growth and Disease. London, UK: J. Johnson; 1771. [Google Scholar]
- 23.Björk A. Prediction of mandibular growth rotation. Am J Orthod. 1969;55:585–599. doi: 10.1016/0002-9416(69)90036-0. [DOI] [PubMed] [Google Scholar]
- 24.Björk A, Skieller V. Facial development and tooth eruption: an implant study at the age of puberty. Am J Orthod. 1972;62:339–383. doi: 10.1016/s0002-9416(72)90277-1. [DOI] [PubMed] [Google Scholar]
- 25.Buschang PH, Santos-Pinto A. Condylar growth and glenoid fossa displacement during childhood and adolescence. Am J Orthod Dentofac Orthop. 1998;113:437–442. doi: 10.1016/s0889-5406(98)80016-4. [DOI] [PubMed] [Google Scholar]
- 26.Houston WJ. A cephalometric analysis of Angle class II, division II malocclusion in the mixed dentition. Dent Pract Dent Rec. 1967;17:372–376. [PubMed] [Google Scholar]
- 27.Hopkin GB, Houston WJ, James GA. The cranial base as an aetiological factor in malocclusion. Angle Orthod. 1968;38:250–255. doi: 10.1043/0003-3219(1968)038<0250:TCBAAA>2.0.CO;2. [DOI] [PubMed] [Google Scholar]
- 28.Horowitz SL, Converse JM, Gerstman LJ. Craniofacial relationships in mandibular prognathism. Arch Oral Biol. 1969;14:121–131. doi: 10.1016/0003-9969(69)90026-0. [DOI] [PubMed] [Google Scholar]
- 29.Baumrind S, Ben-Bassat Y, Korn EL, Bravo LA, Curry S. Mandibular remodeling measured on cephalograms: osseous changes relative to superimposition on metallic implants. Am J Orthod Dentofac Orthop. 1992;102:134–142. doi: 10.1016/0889-5406(92)70025-6. [DOI] [PubMed] [Google Scholar]
- 30.Buschang PH, Gandini Júnior LG. Mandibular skeletal growth and modelling between 10 and 15 years of age. Eur J Orthod. 2002;24:69–79. doi: 10.1093/ejo/24.1.69. [DOI] [PubMed] [Google Scholar]
- 31.Riolo ML, Moyers RE, McNamara JA, Hunter WS. An Atlas of Craniofacial Growth Cephalometric Standards From University School Growth Study. Ann Arbor, Mich: The University of Michigan, Center For Human Growth and Development; 1974. [Google Scholar]
- 32.Bhatia SN, Leighton BC. A Manual of Facial Growth A Computer Analysis of Longitudinal Cephalometric Growth Data. New York, NY: Oxford University Press; 1993. [Google Scholar]
- 33.Coben SE. The integration of facial skeletal variants. Am J Orthod. 1955;41:407–434. [Google Scholar]
- 34.Cannon J. Craniofacial height and depth increments in normal children. Angle Orthod. 1970;40:202–218. doi: 10.1043/0003-3219(1970)040<0202:CHADII>2.0.CO;2. [DOI] [PubMed] [Google Scholar]
- 35.Maj G, Luzi C, Lucchese PO. Cephalometric appraisal of Class II and Class III malocclusions. Angle Orthod. 1960;30:26–32. [Google Scholar]
- 36.Nanda RS. The rates of growth of several facial components measured from serial cephalometric roentgenograms. Am J Orthod. 1955;41:658–673. [Google Scholar]
- 37.Buschang PH, Tanguay R, Demirjian A, LaPalme L, Goldstein H. Pubertal growth of the cephalometric point gnathion: multilevel models for boys and girls. Am J Phys Anthropol. 1988;77:347–354. doi: 10.1002/ajpa.1330770307. [DOI] [PubMed] [Google Scholar]