Abstract
Objective:
To evaluate the three-dimensional (3D) perioral soft tissue changes after orthodontic treatment in patients with dentoalveolar protrusion using structured light–based scanners.
Materials and Methods:
Forty-four Korean adults (19 men and 25 women, 21.4 ± 3.4 years) with dentoalveolar protrusion treated by extraction of all four first premolars and then en masse retraction with maximum anchorage were evaluated. Lateral cephalograms and 3D facial scans were obtained before treatment (T1) and immediately after debonding (T2). Superimposition was performed, and 27 perioral landmarks were identified. The 3D changes in the landmarks and ratio of movement of the soft tissue relative to the horizontal incisal tip were evaluated. A paired t-test and one-way analysis of variance were performed.
Results:
The upper incisors were retracted 5.76 mm and the lower incisors were retracted 4.62 mm (P < .001). The upper lip moved inferoposteriorly, and the lower lip moved superoposteriorly. In the lower lip, upward movement was greater than backward movement (P < .001). The most prominent changes appeared at the greatest bulge area. The relative ratios were 42%–53% in the upper lip area and 22%–82% in the lower lip area. The lip corners moved superoposteriorly (P < .001). Subnasale moved downward (P < .05) and posteriorly (P < .001), while the landmarks under the nostrils moved upward and posteriorly (P < .001).
Conclusion:
Facial scans from white structured light scanners efficiently evaluated 3D perioral soft tissue in dentoalveolar protrusion patients. Backward movement and significant vertical movement of the lip were observed. The nasal and lip angle areas showed considerable changes.
Keywords: Structured light–based scanners, Perioral soft tissue, Dentoalveolar protrusion, 3D analysis
INTRODUCTION
The objective of orthodontic treatment is shifting away from the creation of ideal dental and skeletal relationships and is instead placing more emphasis on the facial soft tissue. Therefore, improved soft tissue esthetics has become an important treatment objective. Dentoalveolar protrusion, characterized by protrusive and proclined upper and lower incisors and increased procumbency of the lips,1 is a common chief complaint among Asian patients2,3 seeking orthodontic care for esthetic reasons. Generally, extraction of first premolars is planned, along with retraction of the anterior teeth with maximum anchorage.2–4
In the past, soft tissue changes following the extraction of premolars in patients with dentoalveolar protrusion were evaluated primarily with lateral cephalometric radiographs.5–8 Leonardi et al.1 reported in their systematic review that the upper and lower lips were retracted 2 to 3.2 mm and 2 to 4.5 mm, respectively, after treatment. However, conventional two-dimensional cephalometry presents several limitations, owing to its midsagittal projection, when investigating the changes of perioral soft tissue.9 Alternatively, acquisition of facial soft tissue data via pre- and posttreatment photos is an easy and intuitive way to analyze changes. Still, it does not provide sufficient information and is influenced by many factors, including the distance and angle from which the photograph is taken.10
Recently, three-dimensional (3D) imaging techniques have been developed to evaluate facial soft tissue more accurately.10 Acquisition methods of 3D imaging can be divided into cone beam computed tomography and noncontact optical scanning methods, such as laser-based scanners or structured light–based scanners.11 Three-dimensional cone beam computed tomographic images, which are widely used in dentistry, provide information about both superficial and deep structures. However, their disadvantages include low resolution caused by the distance between slices, absence of color value, and radiation exposure.12
Laser scanning systems have many advantages. They are noninvasive and quickly provide high-resolution images. However, their limitations are as follows: the equipment is expensive, technicians are required to wear eye protection, the systems are technique sensitive, and the obtained images are only moderately photorealistic.11,13 On the other hand, structured light systems can obtain rapidly captured photorealistic images in a noninvasive manner. They project an organized light pattern of grids, dots, stripes, and other designs onto the surface of the object.11 The structured light system uses white light, which can be safely viewed with the naked eye. The high speed and safe light source mean that this approach can be used in long-term studies and those involving children and large population samples.14
Previous studies of 3D facial imaging in orthodontic treatment have focused mainly on the short-term effects of bracket bonding15 or debonding.16 All of them used laser scanner systems, but no study has yet been conducted to evaluate 3D soft tissue changes after active orthodontic treatment in various malocclusion types. Therefore, the purpose of this study was to evaluate 3D perioral soft tissue changes after orthodontic treatment that included four-premolar extraction in dentoalveolar protrusion patients using a structured light–based scanner.
MATERIALS AND METHODS
The sample consisted of 44 Korean adults (19 men and 25 women, 21.4 ± 3.4 years) with a chief complaint of lip protrusion. They each had Class I dentoalveolar protrusion (U1-FH ≥120°, IMPA ≥100°), with minimal crowding (less than 4 mm). They were treated first with extraction of all four first premolars and then with en masse retraction with maximum anchorage. The working wire was 0.019- × 0.025-inch stainless-steel wire without extra torque, and anchorage was reinforced with a transpalatal arch. Elastic chains with a force of 200 g between the second molar and the hook distal to the lateral incisor were applied. Patients with craniofacial syndromes, such as cleft lip and palate, or severe skeletal disharmony such as facial asymmetry were excluded. This retrospective study was performed under the approval of the Institutional Review Board of Kyung Hee University Dental Hospital (KHD IRB-1312-02).
Data Acquisition
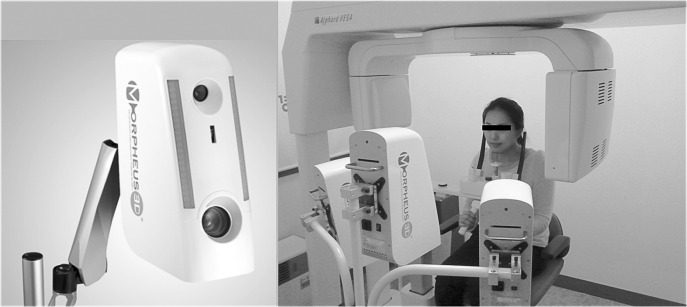
Lateral cephalograms as well as 3D facial scans, using a light-emitting diode–based white structured light scanner (Morpheus 3D, Morpheus Inc, Seoul, Korea), were obtained before treatment and immediately after debonding (scan time: 0.8 seconds, 3× frame rate: 15 frames/s, data accuracy: ± 0.2 mm). During scanning, each patient sat on a revolving chair with the lips relaxed and head in a natural head position. Each patient was scanned from three different views simultaneously (Figure 1), and then the three images corresponding to these views were reconstructed into one 3D image using a registration process (Figure 2).
Figure 1.
The structured light scanner (Morpheus 3D) used in this study and equipment setting scanned from three different views simultaneously.
Figure 2.
Reconstruction of 3D face by automatic registration analyzing the geometry of six selected circumjacent points.
Landmarks and Coordinate System
Camper's plane was rotated 7.5° upward on the axis that connected right and left tragus and translated until it met soft tissue nasion (N′), and this was set as the axial reference plane (x-axis). The plane perpendicular to the x-axis that passed N′ was set as the sagittal reference plane (y-axis). The plane perpendicular to the axial and the sagittal planes that passed through N′ was defined as the coronal reference plane (z-axis).15 These planes corresponded to a coordinate system that has N′ as a zero point. In other words, the right and left of a patient are recorded on the x-axis (left: +, right: −), above and below a patient (above: +, below: −) are recorded on the y-axis, and the front and back of a patient (front: +, back: −) are recorded on the z-axis. Superimposition was executed before and after orthodontic treatment with reference to left and right exocanthion, endocanthion, N′, and wide face of forehead using 3D Image Overlay.15 Therefore, a superimposed 3D image with one coordinate system was obtained from each individual before and after orthodontic treatment (Figure 3).
Figure 3.
Superimposed color map image, with a unified coordinate system, before and after orthodontic treatment. Increases in the blue color gradient indicate greater inward displacement after treatment; green indicates no change.
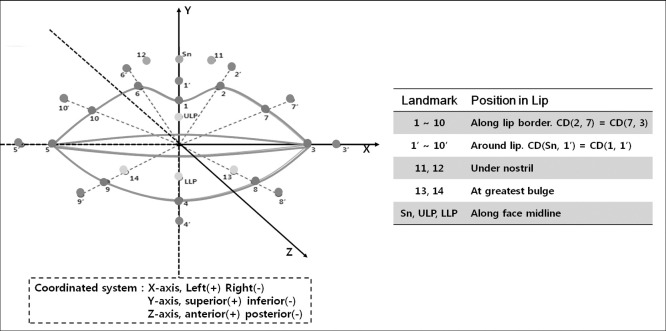
To monitor the perioral soft tissue changes, 27 landmarks were identified along the lip border, around the lip, under the nostril, at the greatest bulge of each portion, and along the face midline (Figure 4). The 3D coordinate values of the landmarks (x, y, z) were acquired, and the changes in landmarks were evaluated by superimposing the images onto those taken before treatment. In lateral cephalograms, the horizontal reference plane was determined as a 7° clockwise rotation of the sella- N′ plane passing through sella; the vertical reference plane was a plane that is perpendicular to the horizontal reference plane at sella. Vertical and horizontal changes of upper and lower anterior teeth and point A and point B were evaluated.
Figure 4.
Twenty-seven perioral soft tissue landmarks and their coordinate system. Sn indicates subnasale; ULP, upper lip profile; and LLP, lower lip profile.
1, The lowest point of the middle area of the Cupid's bow; 2 and 6, the highest point of the Cupid's bow; 3 and 5, the most lateral point of vermilion border; 4, the lowest point of vermilion border; 7-10, midpoints of curved vermilion border; 1', midpoint between point 1 and point Sn; and 2'-10', perioral points which are counterparts of each point along the lip border(1-10), being apart by the same distance between point 1 and point 1'.
Statistical Analysis
All measurements were repeated by the same operator after 2 weeks. The second measurements were compared to the first for each variable using the Pearson correlation coefficient, which was above 0.98 at the 95% confidence level. Therefore, the mean of the two data sets was used. Normality of the data distribution on the variables of the lateral cephalograms and the facial scans was confirmed using the Shapiro-Wilk test. To compare before- and after-treatment measurements, paired t-tests were used. A one-way analysis of variance with Duncan's multiple comparison test was performed to compare between axes. P values less than .05 indicated a statistically significant difference.
RESULTS
In the lateral cephalograms, there were no significant changes in the vertical dimension among all variables (Table 1). There was significant retraction of point A (0.76 mm, P < .01), whereas there was no significant change in point B. The maxillary central incisor tip was retracted 5.76 mm (P < .001), whereas that of the lower incisors was retracted 4.62 mm (P < .001). The root positions of both the upper and lower incisors did not change significantly.
Table 1.
Vertical and Horizontal Changes of Hard Tissue During Retraction on Lateral Cephalograms
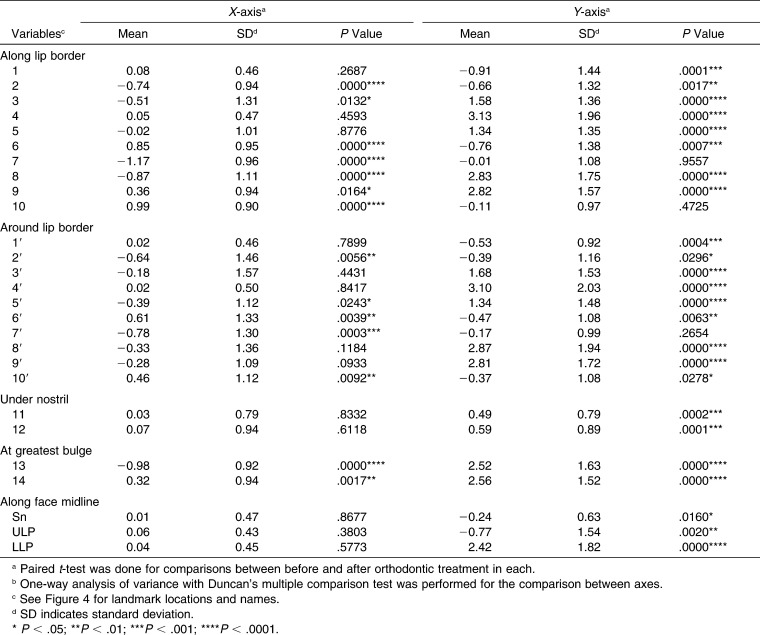
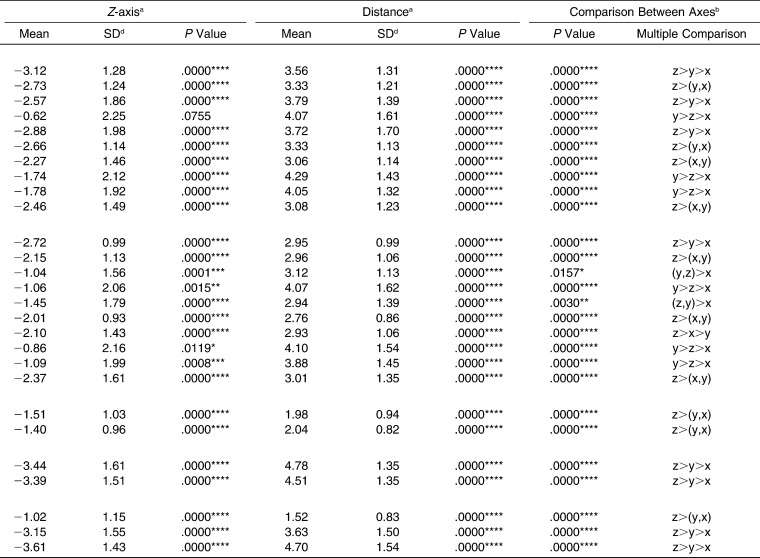
The 3D changes in the perioral soft tissue after orthodontic treatment are shown in Figure 5 and Table 2. All landmarks showed a significant distance between pretreatment and posttreatment values (P < .001). In the x-axis, there were significant changes in most variables, except for those located at the facial midline or under the nostrils. However, the amount was less than 1 mm and therefore not clinically important. In the y-axis, the upper lip, including the Cupid's bow, moved downward (P < .01 or .001), and the lower lip moved upward (P < .001), which resulted in thinning of the lip. The amount of upward movement of the lower lip (approximately 3 mm) was remarkable compared to that of the upper lip (less than 1 mm). Similarly, changes in the greatest bulge points (upper lip [ULP], 13, lower lip [LLP], 14) produced the decreased lip eversion. Only the measurements of the lower lip border (landmarks 4, 8, and 9) and those around the lip (landmarks 4′, 8′, and 9′) showed more movement in the upward direction rather than backward movement (P < .001).
Figure 5.
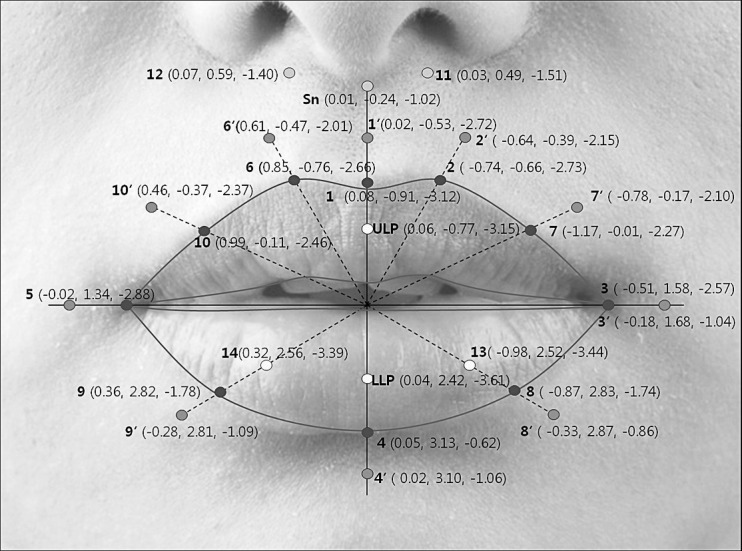
Overall 3D changes of soft tissue landmarks after orthodontic treatment with extraction of all four first premolars. Shown as: (changes in the x-axis, y-axis, and z-axis).
Table 2.
Three-Dimensional Changes of Soft Tissue During Retraction on the Facial Scan Images
Table 2.
Extended
As a result of the retraction, significant backward movement of all landmarks was prominent in the z-axis, except landmark 4 (P < .05 or .01 or .001). Relative percentage changes of the soft tissue movements to the incisal tip movement in the z-axis are shown in Figure 6. In the upper lip, the range was 40%–50%, in which landmarks along the midline were higher and gradually decreased to the outer area. In the lower lip, a wide range of percentage change was observed. The highest value (up to 80%) was shown at the greatest bulge points, and the lowest value was observed on LLP. The retraction at the lip border (1–10) was greater than those around the lip (1′–10′).
Figure 6.
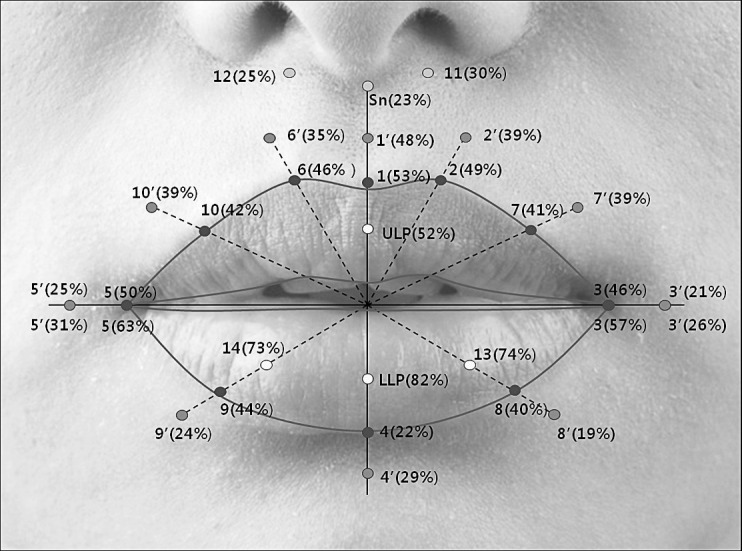
The relative ratio of the amount of soft tissue movement in the z-axis to that of the incisal tip movement in the anteroposterior direction.
Under the nostril, subnasale (Sn), positioned along the face midline, moved downward and backward (P < .05 and < .001, respectively), whereas landmarks 11 and 12 moved upward and backward (P < .001). At the angle of the lips, landmarks 3 and 5 moved upward (P < .001) and posteriorly (P < .001).
DISCUSSION
To justify the use of the 3D surface scanner as a clinical and research tool, validity of facial scanning data should be proven. Precision refers to reproducibility at different time points by the same observer, or among different observers at the same time. Previous studies revealed that three types of 3D surface scanners—laser scanners, stereophotogrammetry, and structured light systems—all showed a difference of less than 1 mm among landmarks. Reproducibility using the laser scanning system was reported to be 0.4 mm with different times17 and 0.2 mm using the structured light system.14 Bhatia et al.18 quantified facial surface changes using a structured light scanner and showed little difference.
On the other hand, accuracy can be measured by comparison between direct anthropometric measurements and 3D facial scan values. Marmulla et al.19 reported a mean accuracy of 1.1 mm for a laser scanning system and Ma et al.14 reported 0.93 mm for a structured light system. Recently, techniques have evolved rapidly and precision and accuracy have improved. The scanner used in our study reported an accuracy of 0.2 mm.
Many structured light scanning systems in previous studies have been nonmodular,20,21 which means that several captures from alternative views are necessary to obtain data for the whole face. Successive scanning from left and right views results in inherent inconsistency because changes in position or facial expression of the subject may occur between each scanning point.21 To overcome this problem, a specially designed new structured light–scanning system was used in this study. Three scanners were positioned so that the subject's face could be scanned from multiple views simultaneously in less than 1 second. In this way, any changes in expression or movements by the subject could be avoided. Additionally, a computed tomogram can be taken in the same position with the scanner system to verify that the hard and soft tissue data matched.
It is a matter of controversy whether there is a reliable relationship between the changes in hard tissues and those in the soft tissues.22 Lip changes are affected by several factors, such as growth, lip tonicity, lip morphology, lip position during imaging, and anchorage control during retraction.23,24 To control for these factors, completion of growth was confirmed using the radiographs, and then the same treatment mechanics were applied including anchorage control and retraction methods. The lips were naturally relaxed in centric relation, because tension of the lip varied at centric occlusion. Hillesund et al.25 mentioned that a relaxed lip position is more favorable than when lips are contacting slightly, because tension of the lips can counterbalance the change between before and after treatment.
Previous cephalometric studies with good sample homogeneity showed that the ratio between lip changes and incisor retraction ranged from 1∶1.75 to 1∶2.2 for the upper lip and from 1∶1.2 to 1∶1.4 for the lower lip.2,6 These results were in accordance with those of our study, which showed relative ratios of 52% for the upper lip and 82% for the lower lip. Significant retraction of the soft tissues occurred beyond the midsagittal region, in accordance with a study of Solem et al.,26 who showed that upper lip retraction was concentrated between the nasolabial fold and commissures.26 In the current study, the amount of retraction of the landmarks inside the lip was greater than those at the lip border, which were greater than those around the lip. This is believed to occur because anatomical mobility decreases as the distance between the anterior teeth and the supported lip increases.15 Among the landmarks inside the lip, the amount of retraction of the lower lip was greater than that of the upper lip. The greater volume and convex curvature of the lower lip brought about the changes concentrated on the bulge area. The upper lip is affected primarily by posterior movement of the maxillary anterior teeth, whereas the lower lip is frequently contacted by the upper lip and affected by both the maxillary and mandibular anterior teeth. Previous work has reported that the lower lip responds to orthodontic tooth movement in a more predictable way than the upper lip does.16
With respect to vertical movement, the upper lip moved downward less than 1 mm, whereas the lower lip moved upward approximately 3 mm, which resulted in thinning of the lip. Lee et al. reported that after brackets are bonded, lip support is significantly increased, and the upper lip moved superiorly, whereas the lower lip moved inferiorly.15 After extraction of the premolars, the opposite movement is expected, as the upward movement of the lower lip tends to maintain lip competency. Interestingly, the backward movement of the greatest bulge area in the lower lip was almost twice that seen along the lip border. This means that the vermilion border of the lower lip moved upward rather than backward and that decreased lip eversion was primarily effected by the change in the greatest bulge area.
There were no significant differences among corresponding left and right landmarks in terms of the amount of retraction. This means that the posterior movement of the left and right teeth is almost symmetric during orthodontic treatment with premolar extraction. The upward movement of the lip angle and downward movement of ULP contributed to a more attractive lip curvature by resolving the reverse upper lip line.27 Interestingly, the soft tissue under the nostril also moved posteriorly. Solem et al. also showed that the lip change extended to the columella area.26 It is necessary to determine whether this happened because of an adaptive change of the underlying hard tissue (retraction of A point) or because of a change in the lip movement. Lee et al. demonstrated that if there was a change in the lips after bracket bonding, the position of Sn also changed.15
A wide range of individual variability was observed in response to treatment and soft tissue adaptation. Further studies conducted in a larger patient sample are necessary to investigate and confirm the factors that may influence changes in perioral soft tissues, such as initial lip volume, tonicity, and philtrum length. Three-dimensional scanning data are required to make comparisons after other treatment modalities as well, including nonextraction orthodontic treatment or combined orthognathic surgery. The analysis of data of soft tissue changes obtained from 3D scanners will enable us to better predict virtual 3D treatment outcomes.
CONCLUSIONS
Three-dimensional imaging using a structured light scanner showed significant changes in the lip and perioral soft tissues of patients with dentoalveolar protrusion after orthodontic treatment with extraction of all four first premolars.
Both backward and vertical movements of the lips were observed.
There were considerable changes, even in the nasal area and around the angles of the lip.
ACKNOWLEDGMENT
This research was supported by a National Research Foundation of Korea grant funded by the Korean government (2009-0092562).
REFERENCES
- 1.Leonardi R, Annunziata A, Licciardello V, Barbato E. Soft tissue changes following the extraction of premolars in nongrowing patients with bimaxillary protrusion. A systematic review. Angle Orthod. 2010;80:211–216. doi: 10.2319/010709-16.1. [DOI] [PMC free article] [PubMed] [Google Scholar]
- 2.Lew K. Profile changes following orthodontic treatment of bimaxillary protrusion in adults with the Begg appliance. Eur J Orthod. 1989;11:375–381. doi: 10.1093/oxfordjournals.ejo.a036009. [DOI] [PubMed] [Google Scholar]
- 3.Tan TJ. Profile changes following orthodontic correction of bimaxillary protrusion with a preadjusted edgewise appliance. Int J Adult Orthod Orthognath Surg. 1996;11:239–251. [PubMed] [Google Scholar]
- 4.Kusnoto J, Kusnoto H. The effect of anterior tooth retraction on lip position of orthodontically treated adult Indonesians. Am J Orthod Dentofacial Orthop. 2001;120:304–307. doi: 10.1067/mod.2001.116089. [DOI] [PubMed] [Google Scholar]
- 5.Bravo LA. Soft tissue facial profile changes after orthodontic treatment with four premolars extracted. Angle Orthod. 1994;64:31–42. doi: 10.1043/0003-3219(1994)064<0031:STFPCA>2.0.CO;2. [DOI] [PubMed] [Google Scholar]
- 6.Bills DA, Handelman CS, BeGole EA. Bimaxillary dentoalveolar protrusion: traits and orthodontic correction. Angle Orthod. 2005;75:333–339. doi: 10.1043/0003-3219(2005)75[333:BDPTAO]2.0.CO;2. [DOI] [PubMed] [Google Scholar]
- 7.Caplan MJ, Shivapuja PK. The effect of premolar extractions on the soft-tissue profile in adult African American females. Angle Orthod. 1997;67:129–136. doi: 10.1043/0003-3219(1997)067<0129:TEOPEO>2.3.CO;2. [DOI] [PubMed] [Google Scholar]
- 8.Diels RM, Kalra V, DeLoach N, Jr, Powers M, Nelson SS. Changes in soft tissue profile of African-Americans following extraction treatment. Angle Orthod. 1995;65:285–292. doi: 10.1043/0003-3219(1995)065<0285:CISTPO>2.0.CO;2. [DOI] [PubMed] [Google Scholar]
- 9.Fuhrmann RA, Schnappauf A, Diedrich PR. Three-dimensional imaging of craniomaxillofacial structures with a standard personal computer. Dentomaxillofac Radiol. 1995;24:260–263. doi: 10.1259/dmfr.24.4.9161172. [DOI] [PubMed] [Google Scholar]
- 10.Lane C, Harrell W., Jr Completing the 3-dimensional picture. Am J Orthod Dentofacial Orthop. 2008;133:612–620. doi: 10.1016/j.ajodo.2007.03.023. [DOI] [PubMed] [Google Scholar]
- 11.Kau CH, Richmond S, Incrapera A, English J, Xia JJ. Three-dimensional surface acquisition systems for the study of facial morphology and their application to maxillofacial surgery. Int J Med Robot. 2007;3:97–110. doi: 10.1002/rcs.141. [DOI] [PubMed] [Google Scholar]
- 12.Miracle AC, Mukherji SK. Cone-beam CT of the head and neck, part 1: physical principles. AJNR Am J Neuroradiol. 2009 Jun;30(6):1088–1095. doi: 10.3174/ajnr.A1653. doi:10.3174/ajnr.A1653. Epub 2009 May 13. [DOI] [PMC free article] [PubMed] [Google Scholar]
- 13.Bush K, Antonyshyn O. Three-dimensional facial anthropometry using a laser surface scanner: validation of the technique. Plast Reconstruct Surg. 1996;98:226–235. doi: 10.1097/00006534-199608000-00004. [DOI] [PubMed] [Google Scholar]
- 14.Ma L, Xu T, Lin J. Validation of a three-dimensional facial scanning system based on structured light techniques. Comput Methods Programs Biomed. 2009;94:290–298. doi: 10.1016/j.cmpb.2009.01.010. [DOI] [PubMed] [Google Scholar]
- 15.Lee WJ, Lee KY, Yu HS, Baik HS. Lip and perioral soft tissue changes after bracket bonding using 3-D laser scanner. Korean J Orthod. 2011;41:411–422. [Google Scholar]
- 16.Jeon H, Lee SJ, Kim TW, Donatelli RE. Three-dimensional analysis of lip and perioral soft tissue changes after debonding of labial brackets. Orthod Craniofac Res. 2013;16:65–74. doi: 10.1111/ocr.12006. [DOI] [PubMed] [Google Scholar]
- 17.Kau CH, Richmond S, Zhurov AI, et al. Reliability of measuring facial morphology with a 3-dimensional laser scanning system. Am J Orthod Dentofacial Orthop. 2005;128:424–430. doi: 10.1016/j.ajodo.2004.06.037. [DOI] [PubMed] [Google Scholar]
- 18.Bhatia G, Vannier MW, Smith KE, Commean PK, Riolo J, Young VL. Quantification of facial surface change using a structured light scanner. Plast Reconstr Surg. 1994;94:768–774. doi: 10.1097/00006534-199411000-00003. [DOI] [PubMed] [Google Scholar]
- 19.Marmulla R, Hassfeld S, Lüth T, Mühling J. Laser-scan-based navigation in cranio-maxillofacial surgery. J Craniomaxillofac Surg. 2003;31:267–277. doi: 10.1016/s1010-5182(03)00056-8. [DOI] [PubMed] [Google Scholar]
- 20.Weinberg SM, Scott NM, Neiswanger K, Brandon CA, Marazita ML. Digital three-dimensional photogrammetry: evaluation of anthropometric precision and accuracy using a Genex 3D camera system. Cleft Palate Craniofac J. 2004;41:507–518. doi: 10.1597/03-066.1. [DOI] [PubMed] [Google Scholar]
- 21.Weinberg SM, Kolar JC. Three-dimensional surface imaging: limitations and considerations from the anthropometric perspective. J Craniofac Surg. 2005;16:847–851. doi: 10.1097/01.scs.0000164330.96675.0c. [DOI] [PubMed] [Google Scholar]
- 22.Kasai K. Soft tissue adaptability to hard tissues in facial profiles. Am J Orthod Dentofacial Orthop. 1998;113:674–684. doi: 10.1016/s0889-5406(98)70228-8. [DOI] [PubMed] [Google Scholar]
- 23.Petrén S, Bondemark L, Söderfeldt B. A systematic review concerning early orthodontic treatment of unilateral posterior crossbite. Angle Orthod. 2003;73:588–596. doi: 10.1043/0003-3219(2003)073<0588:ASRCEO>2.0.CO;2. [DOI] [PubMed] [Google Scholar]
- 24.Oliver BM. The influence of lip thickness and strain on upper lip response to incisor retraction. Am J Orthod. 1982;82:141–148. doi: 10.1016/0002-9416(82)90492-4. [DOI] [PubMed] [Google Scholar]
- 25.Hillesund E, Fjeld D, Zachrisson BU. Reliability of soft-tissue profile in cephalometrics. Am J Orthod. 1978;74:537–550. doi: 10.1016/0002-9416(78)90029-5. [DOI] [PubMed] [Google Scholar]
- 26.Solem RC, Marasco R, Guiterrez-Pulido L, Nielsen I, Kim SH, Nelson G. Three-dimensional soft-tissue and hard-tissue changes in the treatment of bimaxillary protrusion. Am J Orthod Dentofacial Orthop. 2013;144:218–228. doi: 10.1016/j.ajodo.2013.03.018. [DOI] [PubMed] [Google Scholar]
- 27.Sabri R. The eight components of a balanced smile. J Clin Orthod. 2005;39:155–167. [PubMed] [Google Scholar]


