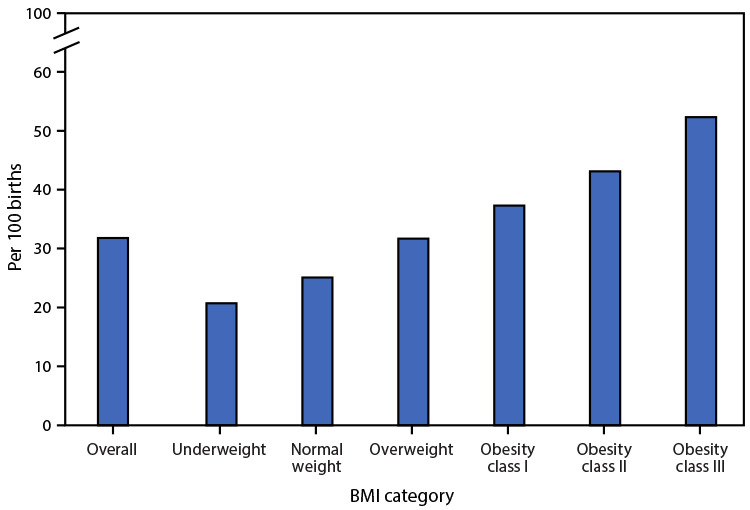
In 2020, 31.8% of live births were to women who had a cesarean delivery. The rate of cesarean delivery was lowest for women who were underweight before pregnancy (20.7%); the rate rose steadily as BMI increased to obesity class III (52.3%). One quarter (25.1%) of women of normal weight had a cesarean delivery.
Sources: National Vital Statistics System, natality file. https://wonder.cdc.gov/natality-expanded-current.html; Defining adult overweight and obesity. https://www.cdc.gov/obesity/adult/defining.html#:~:text=Class%203%3A%20BMI%20of%2040%20or%20higher.%20Class,body%20fatness%20or%20the%20health%20of%20an%20individual
Footnotes
Abbreviation: BMI = body mass index.
BMI = weight (kg)/height (m2). BMI categories are underweight (<18.5), normal weight (18.5–24.9), overweight (25.0–29.9), obesity class I (30.0–34.9), obesity class II (35.0–35.9), and obesity class III (≥40.0).


