

Abstract
BACKGROUND:
The growth in the elderly population is predicted to expand exponentially and developing countries like Pakistan have about two-third of the global elderly population. It is vital to maintain the health of the elderly aged population to reduce disabilities and health-care cost.
AIM:
This study aimed to determine the health promotion practices among the older aged population in Pakistan and to explore the factors associate with adopting healthy lifestyle practices.
MATERIALS AND METHODS:
This was a cross-sectional study spanning from 2019 to 2020 conducted on 317 participants of age more than 60 years in Pakistan. The participants included healthy attendants of patients visiting the outpatient clinics of different disciplines in the Liaquat National Hospital Karachi through purposive sampling technique. The health-promoting practices were assessed using Health-Promoting Lifestyle Profile II Questionnaire. The factors that determined the healthy practices among the elderly population were identified using independent t-test and analysis of variance and Tukey test, with a significance level of P < 0.05. IBM SPSS Statistics 22 was used for data entry and analysis.
RESULTS:
The highest subscale was detected from interpersonal relationships and spiritual growth. The lowest score was detected from physical activity. The scores differed significantly by occupation, education, and the marital status of the participants. Females, unmarried people, those who were less educated, and participants relying on others for financial support had lower health-promoting lifestyle scores.
CONCLUSION:
The overall health-promoting practices were good among the old-aged population of Pakistan. These practices differed particularly for physical activity, spiritual growth, and interpersonal relationships.
Keywords: Developing countries, health-promoting practices, healthy aging, old-age population
Introduction
The growth in the elderly population is predicted to escalate exponentially according to the current demographic trends.[1] Compared to all other age groups, elderly people have the fastest growth rate. It is estimated that by the year 2050, the percentage of older people will be around 22% of the global population.[2] Population aging has been fastest in the developing countries.[3,4] In Pakistan, as of 2019, almost 15 million people are aged over 60 years. This is accounted for 7% of the country's total population. It is expected that this proportion of older people would double to 12% in 2050 with 40 million people aged over 60 years.[4]
In impending years, this growing old-aged population is speculated to impose serious challenges in terms of health and financial needs. The physiological decline in the body functions with age results in the development of chronic diseases.[5,6] Along with this, there is a shift of role in the family and social position.[7] Many of them experience the loss of close relationships. The pace of losing functional ability varies among older individuals. According to the Pakistan Demographic and Health Survey 2017, about 69.4% of old-aged people have difficulty in physical functioning.[8] With the growing phenomenon of brain drain in Pakistan, many of the elders are left without a family structure to look after them in their times of need. The concept of old-age home is not prevalent among the population. Although few private old-age homes have been established in urban areas; however, very few can avail them owing to cost issues.
It is important to maintain the health of the elderly aged population in Pakistan to reduce disabilities and health-care cost. The extended life must be considered as a valuable resource and this could be achieved by prolonging healthy middle life.[9]
Pakistan is a developing country, beset with numerous challenges in terms of poor economic growth, low health budget, and a fragmented health-care system. Many have to rely on out-of-pocket health expenditures. Although the government of Pakistan designed a national policy for health of the elderly in 1999, it has not been implemented. Geriatrics has not been recognized as a specialized area of training in the country, with general practitioners and other specialists are providing health-care services to the elderly in the country.[10,11]
This study aimed to assess the health promotion practices among the older aged population in Pakistan and to determine the factors associated with adopting healthy lifestyle practices. The outcomes of this study would guide policymakers to devise strategies for overcoming the challenges and needs of the rapidly increasing elderly population.
Materials and Methods
Study design and setting
The study was a cross-sectional survey. It was conducted in the Liaquat National Hospital Karachi during May 2019 and October 2020. Liaquat National Hospital is a private tertiary care hospital in Karachi, with over 700 inpatient bed facilities and more than 35 medical subspecialties.[12]
Study participants and sampling technique
The study was done on healthy attendants of patients visiting the outpatient clinics of different disciplines. The participants were approached in the waiting areas of outpatient clinics. A nonrandom, purposive sampling technique was applied to enroll the participants of age more than 60 years in the study. People with any known physical disability or diagnosed psychiatric illness were excluded from the sample. The data collectors made sure that the participants were visiting the hospital as attendants of the patient and not as patients themselves. The final sample size calculated was 317 elderly people using the World Health Organization (WHO) sample size software.
Ethical considerations
The ethical approval of the study was received from the Research Committee and Ethical review committee (ethical code number: App#0477-2019-LNH-ERC) of the Liaquat National Hospital. The participants were directed to a separate, relatively secluded section of the waiting area to maintain confidentiality and privacy. The nature and purpose of the study were explained to them and written informed consent was obtained. They were assured of keeping their information confidential, using it only for research purposes.
Data collection tool and technique
The questionnaire comprised two sections: sociodemographic section and Health-Promoting Lifestyle Profile (HPLP II) (adult version).[13] The sociodemographic section of the questionnaire was developed by researchers who are experts in the field. It contained questions aiming to determine the sociodemographic characteristics of the participants (age, gender, educational level, marital status, financial status, and chronic diseases).
The next section of the questionnaire, HPLP-II, examines the health-promoting behaviors of individuals with 52 items in 6 domains of nutrition (9 questions), physical activity (8 questions), health responsibility (9 questions), stress management (8 questions), interpersonal relationships (9 questions), and spiritual growth (9 questions). Each question has four possible answers on a 4-point Likert-type scale (never, sometimes, often, and routinely). The total score of the questionnaire is between 52 and 208, and the score of each section is based on the highest score of that particular section. To calculate a mean score, the scores of items were summed and then divided by the number of items. Higher mean scores denoted positive health-promoting lifestyles or behaviors. The total HPLP II score is further classified into four levels: poor for the range: 52–90, moderate for the range: 91–129, good for the range: 130–168, and excellent for the range: 169–208.
Statistics
The data were analyzed using IBM SPSS Statistic version 22. Descriptive statistics were employed to calculate frequencies (percentages) for qualitative and mean (standard deviation) for quantitative variables. Independent Student's t-test or analysis of variance (ANOVA) was used for comparing the mean of HPLP across the different categories of demographic characteristics. Tukey post hoc tests were performed to determine the direction and significance of differences between the groups. P < 0.05 was considered to be statistically significant.
Results
A total of 317 participants were enrolled in the study. Major sociodemographic factors are illustrated in Tables 1 and 2. The age range was 60–76 years, with a mean of 67.08 ± 3.26 years. Over half of the participants were males (54.9%). Half of them had more than 10 years of education; however, 20% never attended formal school. Over one-third of the participants were housewives, and over one-third of them were still working to earn a living. Concerning marital status, a majority of the participants were married (75.1%) and living with their spouses (72.3%). As for living arrangements, 76% reported that they lived in unitary family including their spouse, children, and parents. More than half (59.6%) were suffering from chronic diseases, mainly hypertension (15.8%) and diabetes (11%). Some of them had two or more chronic diseases simultaneously (15.8%). Half of the participants (47.4%) mentioned not having their regular medical checkups. The median monthly family income as well as personal income was about 80,000 and 22,500 Pakistani Rupees, respectively. Half of the participants (52.1%) were able to bear their monthly expenses.
Table 1.
Demographic characteristics of elderly participants (n=317)
| Variables | Frequencies, n (%) |
|---|---|
| Age (years), mean±SD | 67.08±3.26 |
| Gender | |
| Male | 174 (54.9) |
| Female | 143 (45.1) |
| Education status | |
| Primary | 28 (8.8) |
| Middle | 22 (6.9) |
| Matriculation | 51 (16.1) |
| Intermediate | 33 (10.4) |
| Graduate | 99 (31.2) |
| Postgraduate | 24 (7.6) |
| Informal | 23 (7.3) |
| Uneducated | 37 (11.7) |
| Occupation | |
| Retired | 88 (27.8) |
| Private job | 29 (9.1) |
| Government job | 7 (2.2) |
| Business | 77 (24.3) |
| Housewife | 110 (34.7) |
| Other (unemployed/voluntary work) | 6 (1.9) |
| Marital status | |
| Married | 238 (75.1) |
| Separated | 6 (1.9) |
| Divorced | 4 (1.3) |
| Widow/widower | 55 (17.4) |
| Unmarried | 13 (4.1) |
| Refused to answer | 1 (0.3) |
| Family living stylea | |
| Unitary | 241 (76) |
| Joint | 76 (24) |
| Living with | |
| No one | 5 (1.6) |
| Spouse | 24 (7.6) |
| Children | 57 (18) |
| Siblings | 19 (6) |
| Spouse and children | 165 (52.1) |
| Spouse children siblings | 40 (12.6) |
| Otherb | 7 (2.2) |
| Chronic diseases | |
| Yes | 189 (59.6) |
| No | 128 (40.4) |
| Chronic diseases (n=189) | |
| Hypertension | 50 (15.8) |
| Joint diseases | 12 (3.8) |
| Diabetes | 35 (11) |
| Cardiac diseases | 12 (3.8) |
| 2 disease | 39 (12.3) |
| 3 diseases | 11 (3.5) |
| Otherc | 30 (9.4) |
| Regular medical checkup | |
| Never | 76 (24) |
| Every month | 28 (8.8) |
| Every 6 months | 74 (23.3) |
| Yearly | 65 (20.5) |
| After 2 years | 5 (1.6) |
| When sick | 69 (21.8) |
aUnitary family=couple, children and parents; Joint family=couple, children, parents, siblings, cousins, and aunt or uncle, bother=uncle, aunt, friend, or cousin, cother=asthma and benign prostatic hyperplasia. SD=Standard deviation
Table 2.
The social characteristics of elderly people (n=317)
| Variables | Median | IQR |
|---|---|---|
| Number of household members | 2 | 2 |
| Retirement duration (years) (n=86) | 8 | 7.25 |
| Household monthly income (Rs.) | 80,000 | 50,000 |
| Personal monthly income (Rs.) | 22,500 | 45,000 |
| Duration of chronic illness (years) (n=189) | 10 | 14.5 |
| Daily expense source, frequency, n (%) | ||
| Self | 165 (52.1) | |
| Spouse | 58 (18.3) | |
| Son | 81 (25.6) | |
| Daughter | 3 (0.9) | |
| Sibling | 10 (3.1) | |
IQR=Interquartile range
Table 3 shows participants’ HPLP II scores for the six subscales. The HPLP II total mean score was 132.07 ± 16.47 (range = 91–179), and the highest mean in the subscales was 29.8 ± 3.58 for interpersonal relationships, followed by 27.41 ± 4.61 for spiritual growth. The lowest score was 11.86 ± 4.01 for physical activity.
Table 3.
The range of dimensions Health-Promoting Lifestyle Profile-II scores among participants (n=317)
| HPLP II and subscales | Mean±SD | Minimum-maximum | Highest and lowest obtainable score |
|---|---|---|---|
| Health responsibility | 21.12±4.46 | 9-34 | 9-36 |
| Physical activity | 11.86±4.01 | 8-32 | 8-32 |
| Nutrition | 21.54±4.64 | 12-36 | 9-36 |
| Spiritual growth | 27.41±4.61 | 11-36 | 9-36 |
| Interpersonal relationships | 29.38±3.58 | 18-36 | 9-36 |
| Stress management | 20.67±3.52 | 10-29 | 8-32 |
| Total HPLP II | 132.07±16.47 | 91-179 | 52-208 |
HPLP II=Health-Promoting Lifestyle Profile-II, SD=Standard deviation
Figure 1 shows the levels of total HPLP II score among the elderly participants. Almost all of the participants had scores in the range of moderate and good classes and very few acquired excellent scores. None of them had a poor level of HPLP II score.
Figure 1.
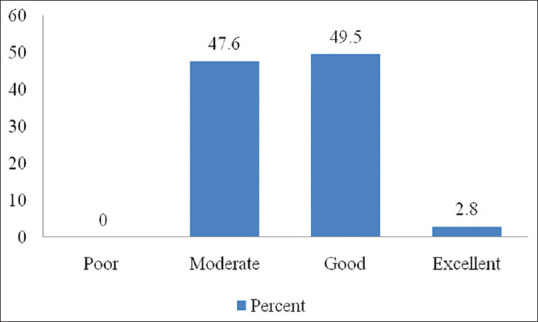
The percentage of the participants acquiring Health-Promoting Lifestyle Profile II score (n = 317)
It is evident from the data shown in Table 4 that males had significantly higher scores than females in the areas of physical activity, nutrition, spiritual growth, and overall HPLP II. The average score for male was also better than that for female students in the areas of health responsibility, interpersonal relationships, and stress management subscales however with no statistically significant differences.
Table 4.
The distribution of Health-Promoting Lifestyle Profile and subsets scores according to study variables among the participants (n=317)
| Variables | HR | PA | N | SG | IR | SM | Total HPLP II |
|---|---|---|---|---|---|---|---|
| Gender | |||||||
| Male | 21.43±4.5 | 12.61±4.4 | 22.13±4.7 | 27.93±4.4 | 29.72±3.6 | 20.92±3.6 | 134.74±16.81 |
| Female | 20.95±4.4 | 10.94±3.1 | 20.83±4.4 | 26.78±4.7 | 28.97±3.4 | 20.36±3.4 | 128.82±15.50 |
| t | 0.94 | 3.78 | 2.51 | 2.21 | 1.85 | 1.41 | 3.22 |
| P | 0.34 | <0.001 | 0.01 | 0.02 | 0.06 | 0.15 | <0.001 |
| Education | |||||||
| Primary | 20.04±4.54 | 2.7±0.52 | 22.1±4.57 | 27.1±5.45 | 29.7±2.88 | 20.3±3.32 | 130.39±13.3 |
| Middle | 20.68±3.38 | 2.3±0.51 | 21.5±3.70 | 25.8±3.31 | 30±2.69 | 20±3.32 | 128.05±9 |
| Matriculation | 20.53±4.24 | 4.4±0.62 | 22.6±5.55 | 28.4±5.17 | 29.7±3.31 | 21.4±3.22 | 134.9±16.1 |
| Intermediate | 21.48±3.95 | 4.1±0.71 | 21.3±4.20 | 26.9±3.71 | 28.7±3.90 | 20.1±3.31 | 130.52±14 |
| Graduate | 22.90±3.12 | 4.2±0.42 | 21.8±4.17 | 27.9±3.91 | 29.8±3.23 | 21.3±3.5 | 136.65±15 |
| Postgraduate | 25.92±4.07 | 4.2±0.87 | 23.9±4.61 | 29.9±4.35 | 31.8±3.30 | 22±4.0 | 148.17±17.9 |
| Informal | 19.52±3.65 | 3.6±0.76 | 18.9±3.99 | 26.3±3.48 | 28.6±3.07 | 19±2.88 | 122.78±10.4 |
| Uneducated | 16.59±4.46 | 2.4±0.40 | 19.1±4.42 | 25.1±5.80 | 26.3±4.12 | 19±3.55 | 116.27±14.5 |
| F | 16.86 | 5.32 | 4.13 | 3.62 | 6.85 | 3.71 | 13.80 |
| P | <0.001 | <0.001 | <0.001 | <0.001 | <0.001 | <0.001 | <0.001 |
| Occupation | |||||||
| Retired | 23.41±3.66 | 12.91±4.04 | 22.6±4.49 | 27.95±4.40 | 29.99±3.26 | 21.17±3.44 | 138.07±15.7 |
| Working | 20.51±4.83 | 12.21±4.65 | 21.6±4.76 | 27.92±4.72 | 29.66±3.84 | 20.71±3.75 | 132.69±17.7 |
| Housewife | 20.21±4.03 | 10.64±2.75 | 20.5±4.44 | 26.41±4.54 | 28.59±3.41 | 20.22±3.28 | 126.59±13.6 |
| F | 16.35 | 9.00 | 5.26 | 4.00 | 4.40 | 1.80 | 12.90 |
| P | <0.001 | <0.001 | <0.001 | <0.001 | <0.001 | 0.14 | <0.001 |
| Marital status | |||||||
| Married | 21.54±4.35 | 12.53±4.25 | 22±4.64 | 27.4±4.66 | 30.1±3.47 | 20.8±3.58 | 134.5±16.48 |
| Others | 20.23±4.67 | 9.82±2.18 | 20.1±4.39 | 27.1±4.50 | 26.9±2.70 | 20.1±3.30 | 124.5±14.04 |
| t | 2.27 | 5.43 | 3.05 | 0.48 | 7.51 | 1.57 | 4.87 |
| P | 0.02 | <0.001 | <0.001 | 0.63 | <0.001 | 0.11 | <0.001 |
| Chronic disease | |||||||
| Yes | 22.19±4.1 | 12.13±3.7 | 22.52±4.4 | 27.69±4.9 | 29.52±3.5 | 20.90±3.4 | 134.96±16.2 |
| No | 19.77±4.5 | 11.45±4.3 | 20.09±4.5 | 26.98±4.0 | 29.18±3.6 | 20.31±3.6 | 127.79±15.9 |
| t | 4.91 | 1.48 | 4.72 | 1.34 | 0.82 | 1.47 | 3.88 |
| P | <0.001 | 0.14 | <0.001 | 0.18 | 0.40 | 0.14 | <0.001 |
HR=Health responsibility, PA=Physical activity, N=Nutrition, SR=Spiritual growth, IR=Interpersonal relationships, SM=Stress management, HPLP II=Health-Promotion Lifestyle Profile II
Table 4 also shows that there was a statistically significant difference between education groups for subsets and total HPLP II scores as demonstrated by one-way ANOVA (P ≤ 0.001). A Tukey post hoc test showed that the postgraduate group had statistically significantly higher total HPLP-II scores than the primary, middle, matriculation, intermediate, graduate, informal, and uneducated groups (P ≤ 0.001). In contrast, the uneducated group had significantly lower HPLP-II scores than the primary, matriculation, intermediate, graduate, and postgraduate groups (P ≤ 0.001).
The results among the different occupational groups showed that the participants from the retired group had statistically significant mean scores than other groups concerning health responsibility, physical activity, spiritual growth, interpersonal relationships subscales, and total HPLP II. The housewives had lower scores in total HPLP II and all of the subsets [Table 4].
In terms of marital status [Table 4], the married participants had statistically significant higher scores in total HPLP II and in the domains of health responsibility, physical activity, nutrition, and interpersonal relationships. There was no difference in the subscales of spiritual growth and stress management between the group participants.
Furthermore, the results showed that the participants with chronic diseases had significantly better mean scores compared to participants without any chronic illness in the subsets of health responsibility, nutrition, and total HPLP II scores. While there were no statistically significant differences in the other four subscales, however, the participants with chronic diseases had better mean results in each of the domains [Table 4].
Discussion
The demographic data of the participants showed that the mean age of the sample was 67 years; this finding is inconsistent with the overall demography of Pakistan according to the WHO, which puts the life expectancy of the Pakistani population at 65 and 67 years for males and females, respectively. One reason for this finding could be that we were unable to sample a larger population due to a lack of funding. A study with a larger sample size would be able to capture the true average age of the older population of the city.
Literacy contributes to the health-promoting practices among the old-age population. Educational attainment is positively associated with self-care ability among the elderly.[14] Our sample population was literate where the majority attained formal education from school; around one-third had completed their graduation, and very few were uneducated. Nevertheless, nearly half of the study participants either never visited a health facility for routine medical checkups, or only visited one until it was unavoidable. These findings demonstrate the complex relationships between educational levels, health-promoting practices, and utilization of health-care facilities, clearly depicting that it is not merely education and/or health-promoting practices that make an old-aged person visit a health facility.[15]
In general, the older aged population relies on their next generation for financial support in Pakistan.[11] However, in our study, more than one-third of the elderly participants were still working to earn a living, and over 50% of them were able to withstand their daily expenses. The rise in life expectancy, lack of safety nets, and poverty lead to the rising trend of employment among the older population of Pakistan.[11] Only government employees and some private organization employees receive a certain amount of financial cover in the form of pensions from the government after retirement.
Those suffering from chronic diseases showed better health-promoting practices than nondiseased individuals. The reason might be that they are more likely to receive frequent health-promotive messages on their visits to the health facility for their chronic illnesses. Routine medical checkups are important to identify the early signs of deviations in optimum health. This is supported by previous literature which shows that chronic disease is directly related to the behavior of utilizing primary health-care services. In addition, as the number of chronic diseases increases, people tend to use health services to a greater extent. Health-care utilization, outpatient services, and general practitioner's counseling increase with the number of illnesses and medications in the older aged group.[15]
A majority of the participants were married, living with their family, including a spouse and children. This reflects the social structure of the Pakistani population. Marriage is considered a respectable institution in the society and a majority stays within this relationship till old age.[16] Marriage encourages healthy behavior early in life and its benefits continue in old age.[17]
The respondents’ scores were highest for the interpersonal relationship scale. Social activities and communicating with people improve coping abilities and generate feelings of optimism and hope.[18] Similarly, the scores were higher in the scale of spiritual growth. Being a spiritual personality reduces feelings of depression and anxiety and encourages a sense of relaxation. Faith and spirituality have a positive effect on the overall well-being, social functioning, and purpose of life among the older adults.[19] The belief in the supreme signifies an important dimension for the quality of life in old-aged people, contributing positively to the meaning of life, resilience in difficult times, and health promotion.[20]
Physical activity is perceived as the key to living a healthy long life;[21] however, our study participants acquired low scores on the physical activity domain. This finding is consistent with the previous literature identifying that this segment of society is the least physically active.[22] Physical activity and similar health-promoting activities that are incorporated as a personal habit at a young age are found to persist into adulthood. Data suggest that many young people do not prefer engaging in physical activity of adequate length and intensity to benefit their health, in spite of the known health benefits. This leads to a decrease in quality of health, extending its impacts into old age since behaviors, healthy, and unhealthy are formed at a very early age.[23,24,25]
Self-care practices have a pivotal role for the older age population to manage their own health. Health promotion practices can enable them to stay in control of their aging process.[26] Individuals who are less vibrant tend to have more health issues compared to those who are actively involved in different activities. Adopting self-care early in life is necessary to attain an ideal physical and mental health at older age.
Limitation and recommendation
This study is one of the first to explore the health-promoting lifestyles among the elderly population in Karachi, Pakistan. Previous research has focused on assessment of the burden of comorbidities in this age group. However, there are very few studies that have assessed the preventive practices among the older aged population against the departure of health. This study suggests that prioritizing the health-promoting practices for the old-aged population of Pakistan will not only improve their health but would also reduce the overall health-care cost. The study had certain limitations. It was conducted in one hospital and data were collected from the healthy old-aged visiting attendants. There is a possibility the old-aged people who are less mobile or those suffering from more serious diseases could have been missed out. Therefore, the results of the study cannot be generalized. Community-based research is recommended for further investigation.
Conclusion
The overall health-promoting practices were good among the old-aged population of Karachi. The health-promoting practices differed by gender, educational level, and marital status, particularly for physical activity, spiritual growth, and interpersonal relationships. Females, unmarried, less educated, and participants relying on others for financial support had lower health-promoting lifestyle scores. It is recommended to acquire the health-promoting lifestyle practices early in life to extend the middle age of the population instead of stretching the life at the end. This implies keeping people healthy as long as possible and providing them with opportunities to practice appropriate health-promotion activities and healthy lifestyle.
Financial support and sponsorship
Nil.
Conflicts of interest
There are no conflicts of interest.
Acknowledgment
We acknowledge the participants who took part in the study by giving us their time.
References
- 1.United Nations, Department of Economic and Social Affairs, Population Division. World Population Ageing 2017-Highlights (ST/ESA/SER.A/397) 2017. [Last accessed on 2021 Mar 23]. Available from: https://www.un.org/en/development/desa/population/publications/pdf/ageing/WPA2017_Highlights.pdf .
- 2.WHO. 10 Facts on Ageing and Health. [Last accessed on 2020 Dec 18]. Available from: http://www.who.int/features/factfiles/ageing/en/
- 3.United Nations, Department of Economic and Social Affairs, Population Division. World Population Ageing 2019: Highlights (ST/ESA/SER.A/430) 2019. [Last accessed on 2021 Mar 23]. Available from: https://www.un.org/en/development/desa/population/publications/pdf/ageing/WorldPopulationAgeing2019-Highlights.pdf .
- 4.He W, Goodkind D, Kowal P. U.S. Census Bureau, International Population Reports, P95/16-1, An Aging World: 2015. U.S. Washington, DC: Government Publishing Office; 2016. [Last accessed on 2021 Mar 22]. Available from: https://www.census.gov/content/dam/Census/library/publications/2016/demo/p95-16-1.pdf . [Google Scholar]
- 5.HelpAge Global Network. [Last accessed on 2021 Mar 22]. Available from: https://ageingasia.org/ageing-population-pakistan/
- 6.Flint B, Tadi P. StatPearls. Treasure Island, FL: StatPearls Publishing; 2021. [Last updated on2020 Dec 02]. Physiology, aging. Available from: https://www.ncbi.nlm.nih.gov/books/NBK556106/ [PubMed] [Google Scholar]
- 7.Harridge SD, Lazarus NR. Physical activity, aging, and physiological function. Physiology (Bethesda) 2017;32:152–61. doi: 10.1152/physiol.00029.2016. [DOI] [PubMed] [Google Scholar]
- 8.Vidovićová L. New roles for older people. Pop Ageing. 2018;11:1–6. [Google Scholar]
- 9.National Institute of Population Studies (NIPS) [Pakistan] and ICF. Pakistan Demographic and Health Survey 2017-18. Islamabad, Pakistan, and Rockville, Maryland, USA: NIPS and ICF; 2018. [Google Scholar]
- 10.World Health Organization. World Report on Ageing and Health. Geneva: World Health Organization; 2015. [Last accessed on 2020 Nov 05]. Available from: https://apps.who.int/iris/bitstream/handle/10665/186463/9789240694811_eng.pdf; jsessionid=C7F679E7A8793BAF9B0AFF5C5AC674E6?sequence=1 . [Google Scholar]
- 11.Ashiq U, Asad AZ. The rising old age problem in Pakistan. J Res Soc Pak. 2017;54:325–33. [Google Scholar]
- 12.The Liaquat National Hospital. [Last accessed on 2021 Mar 22]. Available from: https://www.lnh.edu.pk/
- 13.Walker S, Hill-Polerecky DM. Lincoln: Unpublished manuscript, University of Nebraska Medical Center, College of Nursing; 1997. [Last accessed on 2019 Nov 16]. Psychometric evaluation of health promoting lifestyle profile II. Available from; https://deepblue.lib.umich.edu/bitstream/handle/2027.42/85349/HPLP_IIDimensions.pdf?sequence=2 . [Google Scholar]
- 14.Lee MK, Oh J. Health-related quality of life in older adults: its association with health literacy, self-efficacy, social support, and health-promoting behavior? Healthcare (Basel) 2020;8(4):407. doi: 10.3390/healthcare8040407. Doi: 10.3390/healthcare8040407. [DOI] [PMC free article] [PubMed] [Google Scholar]
- 15.Golinowska S, Groot W, Baji P, Pavlova M. Health promotion targeting older people. BMC Health Serv Res. 2016;16(Suppl 5):345. doi: 10.1186/s12913-016-1514-3. [DOI] [PMC free article] [PubMed] [Google Scholar]
- 16.Perelli-Harris B, Hoherz S, Addo F, Lappegård T, Evans A, Sassler S, et al. Do marriage and cohabitation provide benefits to health in mid-life? The role of childhood selection mechanisms and partnership characteristics across countries. Popul Res Policy Rev. 2018;37:703–28. doi: 10.1007/s11113-018-9467-3. [DOI] [PMC free article] [PubMed] [Google Scholar]
- 17.Chen Y, Yang C, Feng S. The effect of social communication on life satisfaction among the rural elderly: A moderated mediation model? Int J Environ Res Public Health. 2019;16(20):3791. doi: 10.3390/ijerph16203791. Doi: 10.3390/ijerph 16203791. [DOI] [PMC free article] [PubMed] [Google Scholar]
- 18.Jackson BR, Bergeman CS. How does religiosity enhance well-being? The role of perceived control. Psycholog Relig Spiritual. 2011;3:149–61. doi: 10.1037/a0021597. [DOI] [PMC free article] [PubMed] [Google Scholar]
- 19.Duggal D, Sacks-Zimmerman A, Liberta T. The impact of hope and resilience on multiple factors in neurosurgical patients. Cureus. 2016;8:e849. doi: 10.7759/cureus.849. [DOI] [PMC free article] [PubMed] [Google Scholar]
- 20.MacLeod S, Musich S, Hawkins K, Alsgaard K, Wicker ER. The impact of resilience among older adults. Geriatr Nurs. 2016;37:266–72. doi: 10.1016/j.gerinurse.2016.02.014. [DOI] [PubMed] [Google Scholar]
- 21.Bukman AJ, Teuscher D, Feskens EJ, Baak MAV, Meershoek A, Renes RJ. Perceptions on healthy eating, physical activity and lifestyle advice: Opportunities for adapting lifestyle interventions to individuals with low socioeconomic status. BMC Public Health. 2014;14:1036. doi: 10.1186/1471-2458-14-1036. doi: 10.1186/1471-2458-14-1036. [DOI] [PMC free article] [PubMed] [Google Scholar]
- 22.Gomes M, Figueiredo D, Teixeira L, Poveda V, Paúl C, Santos-Silva A, et al. Physical inactivity among older adults across Europe based on the SHARE database. Age Ageing. 2017;46:71–7. doi: 10.1093/ageing/afw165. [DOI] [PMC free article] [PubMed] [Google Scholar]
- 23.Karimi N, Saadat-Gharin S, Tol A, Sadeghi R, Yaseri M, Mohebbi B. A problem-based learning health literacy intervention program on improving health-promoting behaviors among girl students. J Educ Health Promot. 2019;8:251. doi: 10.4103/jehp.jehp_476_19. [DOI] [PMC free article] [PubMed] [Google Scholar]
- 24.Guddal MH, Stensland SØ, Småstuen MC, Johnsen MB, Zwart JA, Storheim K. Physical activity and sport participation among adolescents: Associations with mental health in different age groups. Results from the Young-HUNT study: A cross-sectional survey. BMJ Open. 2019;9(9):E028555. doi: 10.1136/bmjopen-2018-028555. doi: 10.1136/bmjopen-2018-028555. [DOI] [PMC free article] [PubMed] [Google Scholar]
- 25.Saber F, Shanazi H, Sharifirad G, Hasanzadeh A. Checking the determinants of physical activity based on the theory of planned behavior in the housewives. J Educ Health Promot. 2014;3:94. doi: 10.4103/2277-9531.139674. [DOI] [PMC free article] [PubMed] [Google Scholar]
- 26.Gilford DM, editor. National Research Council (US) Panel on Statistics for an Aging Population. The Aging Population in the Twenty-First Century: Statistics for Health Policy. Washington (DC): National Academies Press (US); 1988. [Last accessed on 2021 May 07]. Available from: https://www.ncbi.nlm.nih.gov/books/NBK217737/doi: 10.17226/737 . [PubMed] [Google Scholar]