

Abstract
Rationale: A trial of four financial incentive programs, conducted at CVS Caremark, a large employer, documented their effectiveness in promoting sustained abstinence from smoking, but their cost-effectiveness is unknown, and the significant up-front cost of the incentives is a deterrent to their adoption.
Objectives: To determine the cost-effectiveness of these incentives from the healthcare sector and employer perspectives.
Methods: This study examines a decision model built with trial data, supplemented by data from the literature. Life-expectancy gains for quitters were projected on the basis of U.S. life tables. The two individual-oriented programs paid $800 for smoking cessation at 6 months; one required participants to deposit $150 at baseline. Payments in the two group-oriented programs varied with the group’s success; again, one required participants to deposit $150.
Results: Life-years, quality-adjusted life-years (QALYs), costs (2012 dollars), and cost-effectiveness ratios are described. From the healthcare sector perspective, costs ranged from $3,200 per life-year ($2,500 per QALY) for the competitive deposit program, compared with usual care, to $6,500 per life-year ($5,100 per QALY) for the individual reward program. From the employer perspective, costs ranged from $256,600 per life-year gained for the individual deposit program to $1,711,100 per life-year gained for the individual reward program; the cost per QALY ranged from $65,300 for the competitive deposit program to $128,800 for the individual reward program. Cost-effectiveness from the employer perspective improved with longer decision horizons. Including future medical costs reduced cost-effectiveness from both perspectives.
Conclusions: Four financial incentive programs that paid smokers to quit are very cost-effective from the healthcare sector perspective. They are more expensive from the employer perspective but may be cost-effective for employers with longer decision horizons.
Keywords: behavioral intervention, cost-effectiveness analysis, employer perspective, healthcare sector perspective, smoking cessation
Despite the decline in cigarette smoking, from 42% of adults in 1965 to 14% in 2019, smoking remains the leading cause of preventable death in the United States (1, 2). The gains in life expectancy from quitting are large: smokers who quit between the ages of 25 and 34 live 10 years longer than continuing smokers (3). The gains from smoking cessation are 9, 6, and 4 years for quitters aged 35–44, 45–54, and 55–64 years, respectively.
Paying smokers to quit is effective (4–7). In a randomized controlled trial that compared four actuarially equivalent ways of delivering financial incentives, all four had higher quit rates than control conditions at 6 months: 9.4–16.0% versus 6.0% (P < 0.05 for all comparisons) (5). The incentives were offered through an employer, CVS Caremark, reaching young and middle-aged smokers, when quitting is most beneficial. Payments to quitters ranged from $800 to $1,940 (see Table E1 in Reference 5). Given the life-expectancy increases from smoking cessation, the cost per year of life gained by these programs may be reasonable, but their cost-effectiveness is unknown, and the significant up-front costs of the incentives discourage employers and insurers from offering them.
This paper evaluates the cost-effectiveness of the financial incentive programs tested in the CVS trial from the healthcare sector perspective, and, for comparison, from the perspective of an employer. Together, the results can inform decisions about whether to adopt these programs more broadly and, if so, can indicate who might bear the cost.
Methods
The CVS Trial
During the period from February to October of 2012, 2,538 participants enrolled in the trial, including 1,636 employees of CVS Caremark and 902 relatives and friends who were not CVS employees. All participants received American Cancer Society cessation guides and information about local smoking-cessation resources. The 41% with health benefits through CVS had free access to a behavioral modification program and nicotine replacement therapy.
Participants chose quit dates that were within 90 days of enrollment and were tested for abstinence three times after their quit date: at 14 days, 30 days, and 6 months. Sustained abstinence was defined as having salivary samples with cotinine concentrations <10 ng/ml at all test dates for participants who did not use nicotine replacement therapy and as having urinary samples with anabasine concentrations <3 ng/ml for those who did. Participants who did not report quitting or who reported quitting but did not submit samples were coded as continuing smoking. If participants tested positive for smoking at 14 days, they could set a second quit date, which was again set at a point within 90 days.
Participants in the programs were eligible for incentives only as long as they tested negative for smoking. Incentives varied by trial arm as follows:
-
•
Individual reward. Participants received $200 at each test as long as they tested negative for smoking and received a $200 bonus if still abstinent at 6 months. The total individual reward was $800 per quitter.
-
•
Collaborative reward. Participants were assigned to groups of six, and payments at each test increased with the group’s success, ranging from $100 if only one member had a negative test result to $600 if all six did. Thus, quitters could receive as little as $300 for three negative test results, or as much as $1,800, plus a $200 bonus at 6 months.
-
•
Individual deposit. Participants deposited $150 at baseline toward the cost of incentives and then, like individual reward participants, received $200 for each negative test result. The $200 paid at 6 months included the return of their deposit, and they also received a bonus of $200, resulting in a net payment of $650.
-
•
Competitive deposit. Participants were assigned to groups of six and each deposited $150 at baseline, which was matched by $450 from CVS, resulting in a $3,600 total payment for the group. At each test, a third of the payment, $1,200, was distributed among those with negative test results. For example, if two participants had negative test results at 14 days, each received $600. If only one participant remained abstinent at 30 days and at 6 months, that one participant received $1,200 at 30 days and $1,200 at 6 months, in addition to a $200 bonus. Net gains, after deducting deposits, were $450 for the participant with a negative test result at 14 days and $3,050 for the 6-month quitter.
Cost-Effectiveness Analysis: Overview
The protocol for this study was deemed exempt from review by the University of Pennsylvania Institutional Review Board. We estimated life-years, quality-adjusted life-years (QALYs), and healthcare and employer costs. The healthcare perspective counts health gains and costs over participants’ remaining lifetimes and includes all costs regardless of payer. The base-case definition follows practice through 2016, which was to adopt the healthcare perspective, but state that the perspective was societal, as recommended by the First Panel on Cost-Effectiveness in Health and Medicine (8). In 2016, the Second Panel recommended that the healthcare perspective become a reference case perspective and that it include all future medical costs, both related and unrelated to the condition evaluated; this definition is presented in a sensitivity analysis (9). The employer perspective reflects employers’ typically short decision horizon (5 years in the base case, including the 6-month program); incorporates employee turnover, as employers lose the benefits when quitters leave; and includes only costs paid by employers (in the deposit programs, employers keep the deposits when participants fail to quit).
The analyses are based as much as possible on trial data. Trial participants randomized to a program could choose whether to participate. Many assigned to the deposit arms declined. Because employers would enroll only those who chose to enroll, we modeled only participants who accepted their assignments (Table 1).
Table 1.
Base-case parameters of the analysis
| Control | Individual Reward | Individual Deposit | Collaborative Reward | Competitive Deposit | |
|---|---|---|---|---|---|
| Trial* | |||||
| Randomized, N | 468 | 498 | 582 | 519 | 471 |
| Accepted, n (%) | 468 (100) | 472 (94.8) | 75 (12.9) | 442 (85.2) | 71 (15.1) |
| Quitters by test at 180 d, n (%) | 28 (6.0) | 76 (16.1) | 39 (52.0) | 80 (18.1) | 39 (54.9) |
| Quitters by test at 365 d, n (%) | 16 (3.4) | 37 (7.8) | 10 (13.3) | 43 (9.7) | 17 (23.9) |
| Model | |||||
| Conditional probability of quitting for participants who accepted assignment (by test date)† | |||||
| p_q1 (14 d) | 0.1410 | 0.2458 | 0.7200 | 0.2919 | 0.7606 |
| p_q2 (30 d) | 0.7424 | 0.8621 | 0.9444 | 0.8682 | 0.9444 |
| p_q3 (180 d) | 0.5714 | 0.7600 | 0.7647 | 0.7143 | 0.7647 |
| p_q4 (365 d) | 0.5714 | 0.4868 | 0.2564 | 0.5375 | 0.4359 |
| Life-expectancy gain from quitting, undiscounted‡ | |||||
| Healthcare sector | 6.39260 | 7.26322 | 6.09166 | 6.75860 | 7.13216 |
| Employer | 0.02088 | 0.01394 | 0.03738 | 0.02260 | 0.00932 |
| Life-expectancy gain from quitting, discounted at 3%/yr‡ | |||||
| Healthcare sector | 2.18135 | 2.07573 | 2.22328 | 2.18338 | 2.09348 |
| Employer | 0.01854 | 0.01237 | 0.03319 | 0.02007 | 0.00827 |
| Quality-adjusted life-year gain from quitting, discounted at 3%/yr‡ | |||||
| Healthcare sector | 2.43673 | 2.50116 | 2.42990 | 2.50023 | 2.57483 |
| Employer | 0.103163 | 0.101917 | 0.117387 | 0.107386 | 0.091806 |
| Future medical costs, discounted at 3%/yr, 2012 U.S.$‡ | |||||
| Healthcare sector | 153,157 | 155,673 | 147,527 | 143,809 | 142,967 |
| Employer |
18,143 |
13,856 |
20,849 |
16,192 |
12,187 |
| Annual Rates (%) | |||||
| Quitter relapse by time after baseline, yrठ| |||||
| 2–5 | 10 | ||||
| 6–10 | 5 | ||||
| >10 | 2 | ||||
| Retention by age group, yr‖ Full-time employees | |||||
| <20 | 39 | ||||
| 20–29 | 73 | ||||
| 30–-39 | 84 | ||||
| 40–49 | 88 | ||||
| 50–59 | 90 | ||||
| ⩾60 | 85 | ||||
| Part-time employees | |||||
| <20 | 21 | ||||
| 20–29 | 33 | ||||
| 30–39 | 41 | ||||
| 40–49 | 54 | ||||
| 50–59 | 64 | ||||
| ⩾60 | 71 | ||||
| Program Delivery Costs (2012 U.S.$)¶ | |||||
| Platform cost per participant | 81.34 | ||||
| Laboratory test cost, per test | 100 | ||||
| Recruitment cost per participant** | 21.08 | ||||
| Staff cost per participant-day†† | 1.72 | ||||
Definition of abbreviations: CVS = p_q1 = probability at quartile 1; p_q2 = probability at quartile 2; p_q3 = probability at quartile 3; p_q4 = probability at quartile 4.
Healthcare sector values are for a lifetime horizon. Employer values are for the base-case decision horizon: 5 years after baseline.
See Reference 5.
See the online supplement.
Each probability is the number of participants with negative test results at that test date divided by the number with negative test results at the previous test date (and thus still eligible for incentives). For example, p_q4 is the number of quitters by testing at 365 days divided by the number of quitters by testing at 180 days (e.g., 16/28 = 0.5714 for the control group). The data necessary to calculate p_q1, p_q2, and p_q3 are not shown in the table.
See Reference 35.
Data provided by CVS.
See Reference 14.
Calculated by using the following equation: (0.3 hours × [$30.61 × 1.62]) + 0.62/0.1.
Calculated by using the following equation: 0.0346 hours × ($30.61 × 1.62).
Figure 1 shows the model built in TreeAge (TreeAge Software Inc.). The structure is the same for all five arms, including a control arm and four intervention arms: participants were tested for smoking at 14 days, 30 days, 6 months (the end of the program), and 12 months, so quit rates at those times were available from the trial data. Program delivery costs accrued for up to 6 months after a run-in period, stopping when the participant tested positive for smoking; thus, delivery costs depended on how long the participant remained eligible and differ for each model pathway. Table 1 shows base-case parameter values.
Figure 1.
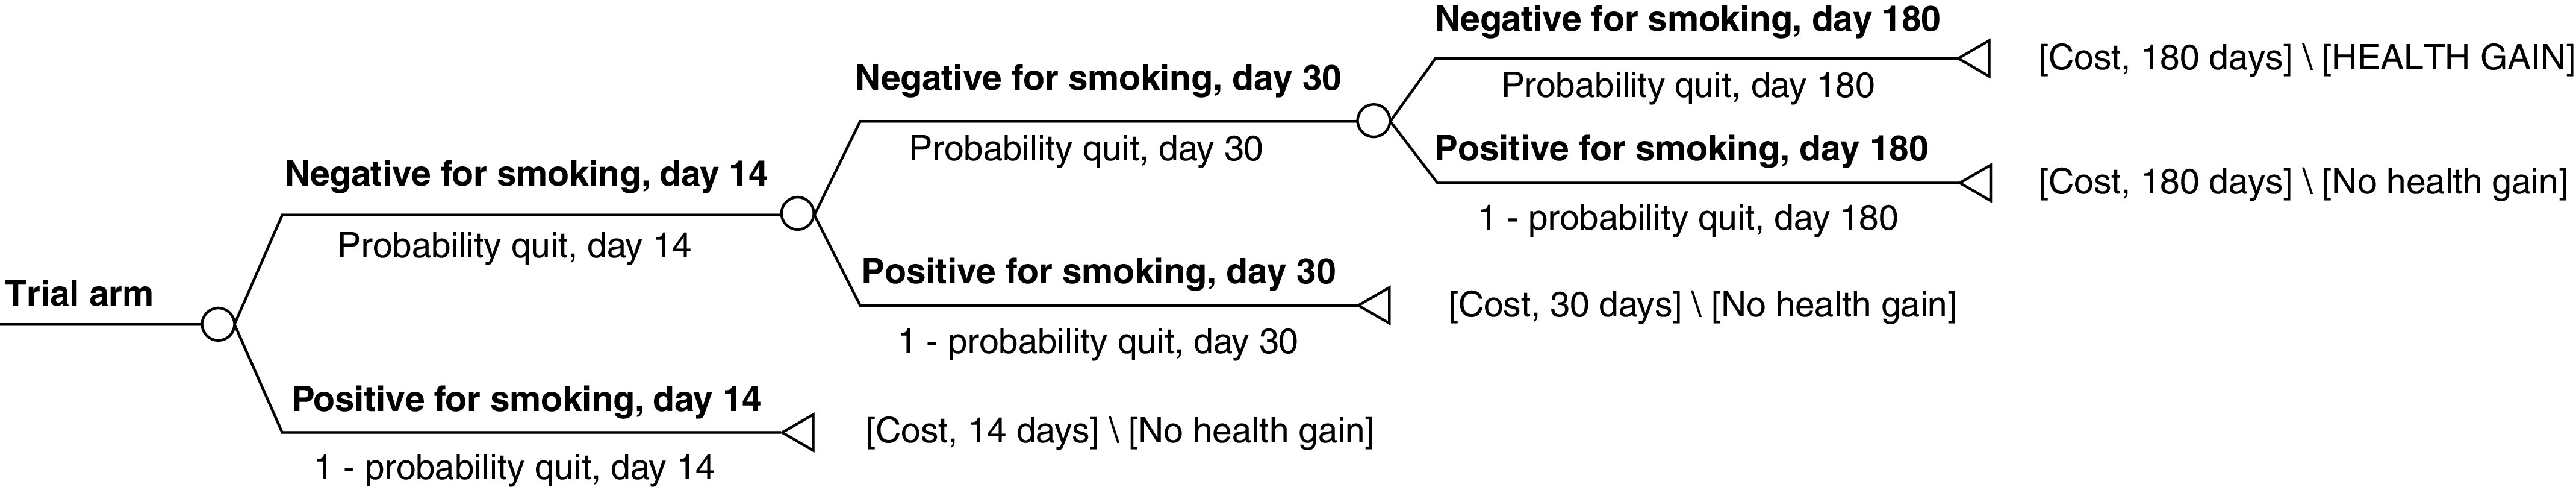
Model diagram. Each arm of the trial, and thus of the model, had the same structure. Participants were tested for smoking at 14, 30, and 180 days (the end of the intervention). Once they tested positive, they were no longer eligible for incentives and were dropped from the intervention. Costs were accumulated over the 60-day period leading up to the intervention plus the days they remained in the intervention; see the Methods for details. Health gains for successful quitters were projected over the employer or health sector time horizon as described in the Methods.
Life-Years and QALYs
Continuing smokers have no health gain, so model pathways that end with continuing smokers were assigned zeroes for life-year and QALY gains. For pathways that end with quitting, the mean life expectancy, or QALY gain, was calculated for the quitters in that trial arm. All quitters survived to 1 year after baseline. We used the method of Black and colleagues (10) to project each quitter’s life-year gain beyond that point as the difference between 1) the life expectancy if a person of that age, sex, and ethnicity (the characteristics available in the 2013 U.S. life tables [11], the tables closest in date to the trial) quit smoking and 2) the life expectancy if the same person continued to smoke. QALYs were derived by using published QALY weights (12, 13). Details on both life-year and QALY calculations are provided in the online supplement.
Analyses from the healthcare sector perspective used quitters’ life-year and QALY gains to the age of 100 years. For the base-case employer perspective (5-yr decision horizon), the first 4 years of life-year or QALY gains after the trial were counted and were further adjusted for the probability that the participant stayed at CVS by using CVS’s 2012 retention rates and assuming that as employees aged, their retention rates matched those of 2012 employees of that age.
For non-Hispanic White men and women—80% of participants—our methods yielded life-expectancy gains for quitters similar to those shown by Jha and colleagues (3): 10 years for quitters aged 25–34 years and 9, 6, and 4 years for quitters aged 35–44, 45–54, and 55–64 years. The 35–44-year age group was the exception, with our method yielding a gain of 6.5 years, compared with Jha and colleagues’ (3) 9 years.
Costs
Program costs included incentives and delivery costs (i.e., costs for tests, staff time, overhead, and a technology platform to track participants’ progress and pay incentives). Costs were adjusted to 2012 dollars, the trial year, by using the Consumer Price Index.
Incentive payments for each model pathway are the product of the incentives offered and the probability that a participant followed that pathway. Payments were straightforward for the individual reward and individual deposit programs. Payments for the collaborative reward and competitive deposit programs depended on how many other participants in a group of six quit; we calculated the expected payments for each pathway as the sum, over all possible payments, of the payment multiplied by the probability of that many quitters and used the binomial formula to derive the probabilities (see the online supplement).
In the trial, a test at Quest Diagnostics or a MinuteClinic cost $75; employee time brought the total to $100. Other delivery costs were not recorded during the trial. We used costs from more recent trials that also involved incentive payments and technology platforms to automate many tasks; costs were measured by using methods we have developed to separate the implementation costs of an intervention tested in a trial (i.e., the costs that would be incurred by adopters of the intervention) from the research costs of the trial (14). Participants incurred staff costs until they tested positive for smoking at 14 or 30 days or until they completed the trial at 180 days. For each model pathway, staff time was assigned a cost by using the assumption that, on average, participants set quit dates that fell 60 days after enrollment (the maximum allowed was 90 d), so staff costs were incurred for 74, 90, or 240 days for participants who tested positive for smoking at Day 14, participants who tested positive for smoking at Day 30, or participants who completed the trial, respectively.
We projected differences in future medical costs associated with quitting on the basis of a Congressional Budget Office (CBO) analysis of medical costs of smokers, former smokers, and nonsmokers (15) (see the online supplement). The differences for model pathways that ended with continuing smokers are zero.
Cost-Effectiveness Analysis
Cost-effectiveness ratios express the comparison of two alternatives as the additional cost of one over the other for each additional life-year or QALY gained. Health outcomes and costs were discounted at 3%/yr (9); although the discount rate for employers has conventionally been higher, based on the return on high-grade corporate bonds, that return has recently been around 3%, so we used the same rate for both perspectives. In the sensitivity analyses, we explored the impact of relapse rates, delivery costs, and future medical costs for both perspectives and explored the impact of employee turnover and the decision horizon for the employer perspective.
Results
We modeled participants who accepted their assigned program, rather than modeling all participants enrolled in the original trial, because only employees who accepted an offered program would contribute to its costs and benefits. Trial participants were randomized, but those who accepted the deposit programs were more likely to be male and full-time employees (Table 2).
Table 2.
Characteristics of trial participants who accepted their assigned program
| Control/Usual Care | Individual Reward | Individual Deposit | Collaborative Reward | Competitive Deposit | |
|---|---|---|---|---|---|
| Number who accepted assignment | 468 | 472 | 75 | 442 | 71 |
| Age (range), yr | 36.3 (18–71) | 35.7 (18–72) | 40.4 (19–64) | 35.4 (18–71) | 35.7 (18–59) |
| Male, % | 35.9 | 36.2 | 49.3 | 37.1 | 40.8 |
| Race/ethnicity, % | |||||
| Non-Hispanic White | 73.9 | 79.0 | 80.0 | 72.4 | 80.3 |
| Hispanic | 9.0 | 6.4 | 5.3 | 5.2 | 5.6 |
| Black | 9.0 | 8.9 | 6.7 | 11.5 | 4.2 |
| Other | 8.1 | 5.7 | 8.0 | 10.9 | 9.9 |
| Employment status, % | |||||
| Full-time | 43.6 | 48.7 | 58.7 | 46.8 | 53.5 |
| Part-time | 18.6 | 14.0 | 16.0 | 18.1 | 21.1 |
| Friend/relative | 37.8 | 37.3 | 25.3 | 35.1 | 25.4 |
These are the characteristics that were used to project life expectancy. See the Methods and the online supplement.
Healthcare Sector Perspective
The programs are seen as alternative ways to encourage smoking cessation rather than as stepped programs, so we compared each program with usual care/control conditions. From the healthcare sector perspective (Table 3), which considers lifetime health outcomes, cost-effectiveness ranges from $3,200 per life-year ($2,500 per QALY) for the competitive deposit program to $6,500 per life-year ($5,100 per QALY) for the individual reward program.
Table 3.
Four financial incentive programs, all compared with usual care/control, by perspective and health outcome
| Scenario/Program | Healthcare Sector Perspective |
Employer Perspective |
||
|---|---|---|---|---|
| Cost per Life-Year (2012 U.S.$) | Cost per QALY (2012 U.S.$) | Cost per Life-Year (2012 U.S.$) | Cost per QALY (2012 U.S.$) | |
| Base case | ||||
| Individual reward | 6,500 | 5,100 | 1,711,100 | 128,800 |
| Collaborative reward | 4,600 | 4,000 | 483,600 | 92,100 |
| Individual deposit | 5,000 | 4,600 | 256,600 | 80,200 |
| Competitive deposit | 3,200 | 2,500 | 894,900 | 65,300 |
| One-way sensitivity analyses (all other parameters set at base-case values) | ||||
| Effectiveness: Relapse rates doubled | ||||
| Individual reward | 6,700 | 5,200 | 1,923,600 | 141,200 |
| Collaborative reward | 4,700 | 4,100 | 544,200 | 101,200 |
| Individual deposit | 5,200 | 4,800 | 288,700 | 88,300 |
| Competitive deposit | 3,200 | 2,600 | 1,006,600 | 71,500 |
| Costs: No program delivery costs, incentive payments only | ||||
| Individual reward | 1,700 | 1,300 | 450,500 | 33,900 |
| Collaborative reward | 1,400 | 1,200 | 147,200 | 28,000 |
| Individual deposit | 2,100 | 2,000 | 86,600 | 27,100 |
| Competitive deposit | 1,600 | 1,300 | 402,400 | 29,400 |
| Costs: Incentive payments plus program delivery costs increased 50% | ||||
| Individual reward | 8,900 | 7,000 | 2,341,300 | 176,300 |
| Collaborative reward | 6,200 | 5,400 | 651,800 | 124,200 |
| Individual deposit | 6,500 | 6,000 | 341,700 | 106,800 |
| Competitive deposit | 3,900 | 3,200 | 1,141,100 | 83,200 |
| Costs: Future medical costs included | ||||
| Individual reward | 83,300 | 65,100 | 2,040,800 | 153,800 |
| Collaborative reward | 66,300 | 57,100 | 656,700 | 125,100 |
| Individual deposit | 68,200 | 62,900 | 392,700 | 122,800 |
| Competitive deposit | 69,100 | 55,300 | 1,302,300 | 95,000 |
Definition of abbreviations: Δ = change in; QALY = quality-adjusted life-year.
The components of the cost-effectiveness ratios (Δ cost, Δ life-years, and Δ QALYs) are available in the online supplement.
Employer Perspective
From the employer perspective (Table 3), when using the base-case 5-year decision horizon, costs range from $256,600 per life-year for the individual deposit program to $1,711,100 per life-year for the individual reward program. Quality-of-life gains are larger than life-expectancy gains in the early years (see the online supplement), so the cost per QALY is substantially lower, ranging from $65,300 for the competitive deposit program to $128,800 for the individual reward program.
Sensitivity Analysis
Relapse rates and costs
The results of the sensitivity analyses of relapse rates and costs are shown in Table 3. One-way sensitivity analysis shows that doubling relapse rates, which decreases effectiveness, increases the cost per life-year, or per QALY, very little for the healthcare sector and by about 10% for employers; the longer decision horizon of the healthcare perspective means that the lower relapse rates in later years play a larger part in the results. Two analyses explore the impact of program delivery costs: 1) when incentives are the only cost, the cost per life-year or QALY is half, or less, of the base-case cost per life-year or QALY for both perspectives, and 2) when program delivery costs are 50% higher than base-case costs, the cost per life-year or QALY increases by about a third.
Including future medical costs, as recommended by the Second Panel on Cost-Effectiveness in Health and Medicine (9), increases the cost per life-year or QALY. From the healthcare perspective, which includes all payers, the cost per life-year or QALY is much higher when future medical costs are included ($55,000–$83,000), depending on the program and the health outcome measure. For employers, the difference is modest, as only 41% of trial participants had employer-provided health coverage, which covered 60% of costs.
Employee retention and employer decision horizon
The sensitivity analyses for employee retention and the employer decision horizon are shown in Table 4. Employers retain greater health benefits from the programs when turnover is low. For the individual deposit program, the cost per life-year drops from $256,600 at CVS’s retention rates (shown in Table 1) to $210,200 when no employees leave and retention is 100%; the cost per QALY decreases from $80,200 to $61,700. The use of the competitive deposit program is again the best value when QALYs are used to measure health; its cost declines from $65,300 per QALY in the base-case scenario to $43,700 per QALY when employee retention is 100%.
Table 4.
Employer perspective, sensitivity analysis: four financial incentive programs, all compared with usual care/control, by health outcome
| Scenario and Program | Cost per Life-Year (2012 U.S.$) | Cost per QALY (2012 U.S.$) |
|---|---|---|
| Base case | ||
| Individual reward | 1,711,100 | 128,800 |
| Collaborative reward | 483,600 | 92,100 |
| Individual deposit | 256,600 | 80,200 |
| Competitive deposit | 894,900 | 65,300 |
| One-way sensitivity analyses (all other parameters held at base-case values) | ||
| No employee turnover | ||
| Individual reward | 1,370,200 | 94,800 |
| Collaborative reward | 376,800 | 69,300 |
| Individual deposit | 210,200 | 61,700 |
| Competitive deposit | 593,900 | 43,700 |
| Decision horizon of 10 yr | ||
| Individual reward | 373,600 | 61,900 |
| Collaborative reward | 106,300 | 39,400 |
| Individual deposit | 55,200 | 29,800 |
| Competitive deposit | 168,800 | 30,500 |
| Decision horizon of 15 yr | ||
| Individual reward | 157,700 | 40,000 |
| Collaborative reward | 45,600 | 23,200 |
| Individual deposit | 23,900 | 16,000 |
| Competitive deposit | 65,400 | 19,100 |
| Decision horizon of 20 yr | ||
| Individual reward | 88,500 | 25,100 |
| Collaborative reward | 26,300 | 14,500 |
| Individual deposit | 14,100 | 10,700 |
| Competitive deposit | 33,000 | 11,300 |
Definition of abbreviation: Δ = change in; QALY = quality-adjusted life-year.
The components of the cost-effectiveness ratios (Δ cost, Δ life-years, and Δ QALYs) are available in the online supplement.
The cost-effectiveness of all four programs improves from the employer perspective as the employer’s decision horizon lengthens, thus including more health gains. For example, the cost of the individual deposit program declines from $256,600 per life-year ($80,200 per QALY) at a 5-year decision horizon to $14,100 per life-year ($10,700 per QALY) at a 20-year decision horizon.
Discussion
We evaluated the cost-effectiveness of four ways of paying smokers to quit from the healthcare sector perspective, the perspective used in most cost-effectiveness analyses, and one of the two perspectives recommended by the Second Panel on Cost-Effectiveness in Health and Medicine (8, 9) to permit comparison of our results with those for other interventions. By any standard—comparison with other interventions or with proposed cost-effectiveness thresholds (8)—all four programs are very cost-effective from the healthcare sector perspective. In the base-case scenario, the cost ranged from $3,200 per life-year ($2,500 per QALY) for the competitive deposit program to $6,500 per life-year ($5,100 per QALY) for the individual reward program.
Although few interventions in pulmonary and critical care medicine have been formally evaluated for cost-effectiveness from the healthcare sector perspective, three other nonpharmacologic examples can help to put these results in context. First, lung cancer screening with low-dose computed tomography is recommended by the U.S. Preventive Services Taskforce and is reimbursed by most insurers on the basis, in part, of evidence that it costs $81,000 per additional QALY (10). More recently, we showed that prone positioning for patients with acute respiratory distress syndrome, which has surged in use during the coronavirus disease (COVID-19) pandemic, costs $38,648 per QALY (16). The present analysis shows that financial incentives for smoking cessation are more cost-effective than these interventions. By contrast, two studies suggest that pulmonary rehabilitation for patients with chronic obstructive pulmonary disease may increase QALYs while reducing costs (17, 18), although their methods do not align with modern cost-effectiveness analysis standards.
We also evaluated the programs from the perspective of an employer like CVS Caremark, which participated in the trial that documented their effectiveness. No thresholds have been proposed for employers, but all four programs are substantially more expensive from the employer’s perspective when evaluated at the 5-year decision horizon used for the base case: $256,600 per life-year ($80,200 per QALY) for the individual deposit program to $1,711,000 per life-year ($128,800 per QALY) for the individual reward program. The decision horizon is key to the difference between the two perspectives because longer decision horizons capture more of the health gains. For example, as the employer’s decision horizon increases from 5 years to 20 years, the cost for the individual deposit program drops from $256,600 per life-year ($80,200 per QALY) to $14,100 per life-year ($10,700 per QALY), and all four programs therefore become cost-effective by the standards used to judge healthcare sector results.
These findings may help explain why many employers have adopted programs that involve financial incentives for smoking cessation, in some cases charging employees who are smokers higher health insurance premiums to incentivize them to quit smoking without cost to the firm. There are important philosophical and pragmatic questions about the use of incentives as “carrots” (rewards) or “sticks” (penalties) (19), and it is likely that many employers have moved toward penalty-based programs because they do not require the employer to put money down up front. More broadly, although there is some evidence that health and wellness programs can be effective and cost-effective, there is a growing sense that they usually are not effective in improving health or reducing costs (20), and many employers offer them instead as fringe benefits to increase retention and meet employee expectations that the employer invest in employee health programs. Programs that use financial incentives to promote smoking cessation are different, as there is evidence of effectiveness from multiple randomized trials, and, as this study indicates, such programs may be highly cost-effective from the health sector perspective.
Employers and health policy-makers often expect future medical cost savings to offset the costs of preventive interventions and the Second Panel on Cost-Effectiveness in Health and Medicine recommended that future medical costs be included in the healthcare perspective (9, 21). The best evidence, a CBO study of the medical costs of smokers, former smokers, and nonsmokers (15), which was featured in the 2014 Surgeon General’s report (22, 23), controlled carefully for health-related characteristics (e.g., overweight and alcohol consumption) that differ between smokers and never-smokers and remain after smokers quit. The CBO’s analysis could not control for unmeasured characteristics, such as ill health, which often motivates smokers to quit. Ill health was less likely to be a factor in trial participants’ decisions to quit, as the introduction of the interventions was not related to their health, so the CBO’s estimates may overstate the future medical costs of former smokers in the trial. The qualitative conclusion, however, that former smokers have higher medical costs than current smokers and nonsmokers of the same age is likely correct; the differences decline the longer they remain former smokers. As a result, including future medical costs increased the cost per life-year or QALY in the sensitivity analysis (Table 3). The increase was lower for the employer perspective, as only 41% of trial participants had employer-provided coverage, which paid only 60% of medical costs, than for the healthcare perspective, which includes all payers’ costs. Employers who provide better health insurance coverage would experience higher costs per life-year or QALY. The large differences observed from the healthcare perspective highlight the limits of comparisons with earlier studies, which did not incorporate future medical costs, and the importance of comparisons with future studies that do.
Many workplace smoking-cessation interventions, including group and individual counseling and pharmacotherapies, have been proven effective in trials (24). More recently, trials have shown a variety of financial incentives to be effective (25). The cost-effectiveness of workplace interventions is not as well studied as their effectiveness, and the methods are less rigorous (4, 25). Costs are often underestimated, benefits are often overestimated (26), and estimates are often in forms (e.g., cost per quitter) that are not comparable with cost-effectiveness analyses of other health interventions. We know of one other trial-based cost-effectiveness analysis of smoking cessation, which enrolled 604 smokers at 61 employers in the Netherlands (27). At 12 months, 41.1% of intervention participants had quit versus 26.4% of control subjects (P < 0.001). That study also compared employer and healthcare perspectives. Rather than projecting trial participants’ outcomes, however, the study used published tables of cost-effectiveness ratios for smoking-cessation interventions in the general population (28). By contrast, we evaluated four programs that were compared head-to-head in a randomized controlled trial, allowing us to compare their cost-effectiveness, and we projected long-term outcomes for trial participants, which let us test the influence of relapse rates, delivery costs, employee retention, the employer decision horizon, and future medical costs in sensitivity analyses. Because we used methods recommended for the broad range of health interventions (9, 21, 29), our results can be compared with those of other cost-effectiveness analyses.
Strengths and Limitations
Strengths of our study include that it was based as much as possible on the trial results. Rather than applying the effectiveness estimates from the trial to a hypothetical cohort, we projected outcomes for the trial participants themselves, the people who generated the effectiveness estimates. We projected life expectancy and QALYs by using U.S. life tables, a more reliable method than is available to many cost-effectiveness analyses, which must use parametric survival models based on trial or observational data to project life expectancy beyond the trial (30, 31). Because smoking is so detrimental to health, the gains in life-years and QALYs from the four programs are also larger, and thus more reliable, than is true of most cost-effectiveness analyses. Our results are, however, modestly affected by differences in the age, sex, and ethnicity of the quitters in each program. For example, from the employer perspective, the individual deposit program costs the least amount per life-year, but the competitive deposit program costs the least amount per QALY, which is due to individual deposit quitters averaging 48 years of age and competitive deposit quitters averaging 37 years of age; near-term life-expectancy gains are larger for older quitters, whereas quitters of all ages benefit from better quality of life. We elected to model quit rates and costs among trial participants who accepted the interventions, even though they are not representative of all employed smokers, because the selection effects present in this pragmatic trial are also likely to manifest if these programs are implemented outside of trials.
This study’s findings should be interpreted in the context of several limitations. First, although the trial documented effectiveness in a population of employees of large employer, the participants are not fully representative of U.S. workers, nor is CVS Caremark representative of all employers. Retention rates differ across employers; one-way sensitivity analysis showed that increasing retention rates to 100% made relatively little difference to the programs’ cost-effectiveness, but employers with lower retention rates than CVS Caremark would experience higher costs per life-year or QALY. A second potential limitation on generalizability is that e-cigarettes, which are now commonly used, were not offered as part of the programs we tested. However, the evidence supporting e-cigarettes as a smoking-cessation intervention is mixed (6, 32), the long-term adverse health consequences of their use is uncertain (33), and we are not aware of any employer-based cessation programs that offer e-cigarettes to employees.
Third, program delivery costs were not measured during the trial but were taken from recent trials that used similar delivery methods by using methods we developed to separate implementation costs, the costs an adopter would incur, from the research costs of a trial (14). Employers may experience different costs; in particular, they may experience higher costs if they offer a program that attracts relatively few people, as the deposit programs did. We explored the effect of costs in two sensitivity analyses, one in which incentives are the only cost and one in which program delivery costs are 50% higher than those of the base case.
Finally, there is no uniformly agreed-on approach to calculating life-expectancy gains for people who quit smoking. Our approach differs somewhat from the excess mortality risk approach (34). However, as we show in the online supplement, use of the excess mortality risk method would magnify our conclusions that the interventions are very cost-effective from the health sector perspective, regardless of whether the outcome is life-years or QALYs, and that the interventions are very expensive from the employer perspective when the outcome is life-years but are possibly worth considering for employers with long decision horizons when the outcome is QALYs. Future work that directly compares these two approaches may be warranted.
Conclusions
In summary, four financial incentive programs that paid smokers to quit proved effective in a randomized controlled trial, but the costs of the incentives discourage their wider adoption. Our analysis shows that because smoking cessation is so beneficial, all four programs are highly cost-effective from the healthcare sector perspective. Although they are expensive for employers who consider only the short term, their cost-effectiveness from the employer perspective improves at longer decision horizons. These findings suggest that cost-sharing models, whereby both employers and insurers contribute to the costs of employer-based incentive programs for smoking cessation, may enable these highly effective interventions to reach broader populations of people who wish to stop smoking.
Footnotes
Supported by the Penn National Institute on Aging Roybal Center on Behavioral Economics and Health (P30AG034546) and internal Perelman School of Medicine funds. S.D.H. was supported by grant K24 HL143289 from the National Heart, Lung, and Blood Institute. The analysis is based on data from the trial registered with clinicaltrials.gov under identifier NCT 01526265. The trial was funded by the National Institutes of Health and CVS Caremark.
Author Contributions: L.B.R., K.G.V., and S.D.H. conceived and designed the study. L.B.R. and B.S.C. built the decision model, which was reviewed by all authors. L.B.R., P.L.K., and J.Z. prepared and programmed the data to derive the parameter values used in the decision model. The parameter values were reviewed by all authors. L.B.R. conducted the analyses. L.B.R. drafted the paper and, with help from P.L.K., the appendices in the online supplement. M.O.H. provided background about the trial data and reviewed the appendices in the online supplement. All authors reviewed the paper critically and provided feedback for revisions. All authors approved the final version to be published.
This article has an online supplement, which is accessible from this issue’s table of contents at www.atsjournals.org.
Author disclosures are available with the text of this article at www.atsjournals.org.
References
- 1.National Center for Health Statistics. Table 63: current cigarette smoking for adults 18 years of age and over according to sex, race, and age: United States, selected Years 1965–2003. In: Health, United States, 2005 with chartbook on trends in the health of Americans. Washington, DC: U.S. Government Printing Office; 2005. Library of Congress catalog number 76-641496. [Google Scholar]
- 2.Centers for Disease Control and Prevention Atlanta, GA: Centers for Disease Control and Prevention; 2019https://www.cdc.gov/tobacco/data_statistics/fact_sheets/adult_data/cig_smoking/index.htm. [Google Scholar]
- 3.Jha P, Ramasundarahettige C, Landsman V, Rostron B, Thun M, Anderson RN, et al. 21st-Century hazards of smoking and benefits of cessation in the United States N Engl J Med 2013368341–350.. [DOI] [PubMed] [Google Scholar]
- 4. Volpp KG, Troxel AB, Pauly MV, Glick HA, Puig A, Asch DA, et al. A randomized, controlled trial of financial incentives for smoking cessation. N Engl J Med. 2009;360:699–709. doi: 10.1056/NEJMsa0806819. [DOI] [PubMed] [Google Scholar]
- 5. Halpern SD, French B, Small DS, Saulsgiver K, Harhay MO, Audrain-McGovern J, et al. Randomized trial of four financial-incentive programs for smoking cessation. N Engl J Med. 2015;372:2108–2117. doi: 10.1056/NEJMoa1414293. [DOI] [PMC free article] [PubMed] [Google Scholar]
- 6. Halpern SD, Harhay MO, Saulsgiver K, Brophy C, Troxel AB, Volpp KG. A pragmatic trial of e-cigarettes, incentives, and drugs for smoking cessation. N Engl J Med. 2018;378:2302–2310. doi: 10.1056/NEJMsa1715757. [DOI] [PubMed] [Google Scholar]
- 7. Notley C, Gentry S, Livingstone-Banks J, Bauld L, Perera R, Hartmann-Boyce J. Incentives for smoking cessation. Cochrane Database Syst Rev. 2019:CD004307. doi: 10.1002/14651858.CD004307.pub6. [DOI] [PMC free article] [PubMed] [Google Scholar]
- 8.Neumann PJ, Russell LB, Siegel JE, Prosser LA, Krahn M, Mandelblatt JS, et al. Chapter 1: using cost-effectiveness analysis in health and medicine: experiences since the original panelNeumann PJ, Sanders GD, Russell LB, Siegel JE, Ganiats TG.2nd edNew York, NY: Oxford University Press; 2016. pp. 1–38. [Google Scholar]
- 9.Neumann PJ, Sanders GD, Basu A, Brock DW, Feeny D, Krahn M, et al. Chapter 3: recommendations on perspectives for the reference caseNeumann PJ, Sanders GD, Russell LB, Siegel JE, Ganiats TG.2nd edNew York, NY: Oxford University Press; 2016. pp. 67–74. [Google Scholar]
- 10. Black WC, Gareen IF, Soneji SS, Sicks JD, Keeler EB, Aberle DR, et al. National Lung Screening Trial Research Team. Cost-effectiveness of CT screening in the National Lung Screening Trial. N Engl J Med. 2014;371:1793–1802. doi: 10.1056/NEJMoa1312547. [DOI] [PMC free article] [PubMed] [Google Scholar]
- 11.Arias E, Heron M, Xu J.United States life tables, 2013 Natl Vital Stat Rep 2017661–64.. [PubMed] [Google Scholar]
- 12. Fiscella K, Franks P. Cost-effectiveness of the transdermal nicotine patch as an adjunct to physicians’ smoking cessation counseling. JAMA. 1996;275:1247–1251. [PubMed] [Google Scholar]
- 13. Tillmann M, Silcock J. A comparison of smokers’ and ex-smokers’ health-related quality of life. J Public Health Med. 1997;19:268–273. doi: 10.1093/oxfordjournals.pubmed.a024629. [DOI] [PubMed] [Google Scholar]
- 14.Russell LB, Norton LA, Pagnotti D, Sevinc C, Anderson S, Finnerty Bigelow Det al. Using clinical trial data to estimate the costs of behavioral interventions for potential adopters: a guide for trialists Med Decis Making 2021419–20.. [DOI] [PMC free article] [PubMed] [Google Scholar]
- 15.Howlett C, editor. Congressional Budget Office, Congress of the United States. Washington, DC: Congressional Budget Office, Congress of the United States; 2012. [Google Scholar]
- 16.Baston CM, Coe NB, Guerin C, Mancebo J, Halpern S.The cost-effectiveness of interventions to increase utilization of prone positioning for severe acute respiratory distress syndrome Crit Care Med 201947e198–e205.. [DOI] [PMC free article] [PubMed] [Google Scholar]
- 17. Griffiths TL, Phillips CJ, Davies S, Burr ML, Campbell IA. Cost effectiveness of an outpatient multidisciplinary pulmonary rehabilitation programme. Thorax. 2001;56:779–784. doi: 10.1136/thorax.56.10.779. [DOI] [PMC free article] [PubMed] [Google Scholar]
- 18. Mosher C, Nanna M, Jawitz O, Raman V, Farrow N, Aleem S, et al. Cost-effectiveness of pulmonary rehabilitation in US adults with COPD [abstract] Chest. 2020;158:A2059–A2060. doi: 10.1001/jamanetworkopen.2022.18189. [DOI] [PMC free article] [PubMed] [Google Scholar]
- 19. Volpp KG, Galvin R. Reward-based incentives for smoking cessation: how a carrot became a stick. JAMA. 2014;311:909–910. doi: 10.1001/jama.2014.418. [DOI] [PMC free article] [PubMed] [Google Scholar]
- 20. Song Z, Baicker K. Effect of a workplace wellness program on employee health and economic outcomes: a randomized clinical trial. JAMA. 2019;321:1491–1501. doi: 10.1001/jama.2019.3307. [DOI] [PMC free article] [PubMed] [Google Scholar]
- 21. Sanders GD, Neumann PJ, Basu A, Brock DW, Feeny D, Krahn M, et al. Recommendations for conduct, methodological practices, and reporting of cost-effectiveness analyses: second panel on cost-effectiveness in health and medicine. JAMA. 2016;316:1093–1103. doi: 10.1001/jama.2016.12195. [DOI] [PubMed] [Google Scholar]
- 22.Office on Smoking and Health, National Center for Chronic Disease Prevention and Health Promotion, Centers for Disease Control and Prevention, U.S. Department of Health and Human Services Chapter 11: General morbidity and all-cause mortality. In: The health consequences of smoking: 50 years of progress. A report of the Surgeon General. Rockville, MD: U.S. Department of Health and Human Services; 2014623–646. [Google Scholar]
- 23.Office on Smoking and Health, National Center for Chronic Disease Prevention and Health Promotion, Centers for Disease Control and Prevention, U.S. Department of Health and Human Services Table 11.10S: annual per capita spending on health care, by smoking status and age group (2008 dollars). In: The health consequences of smoking: 50 years of progress. A report of the Surgeon General. Rockville, MD: U.S. Department of Health and Human Services; 2014S-453. [Google Scholar]
- 24. Cahill K, Lancaster T. Workplace interventions for smoking cessation. Cochrane Database Syst Rev. 2014:CD003440. doi: 10.1002/14651858.CD003440.pub4. [DOI] [PMC free article] [PubMed] [Google Scholar]
- 25. Notley C, Gentry S, Livingstone-Banks J, Bauld L, Perera R, Hartmann-Boyce J. Incentives for smoking cessation. Cochrane Database Syst Rev. 2019:CD004307. doi: 10.1002/14651858.CD004307.pub6. [DOI] [PMC free article] [PubMed] [Google Scholar]
- 26. Ekpu VU, Brown AK. The economic impact of smoking and of reducing smoking prevalence: review of evidence. Tob Use Insights. 2015;8:1–35. doi: 10.4137/TUI.S15628. [DOI] [PMC free article] [PubMed] [Google Scholar]
- 27. van den Brand FA, Nagelhout GE, Winkens B, Chavannes NH, van Schayck OCP, Evers SMAA. Cost-effectiveness and cost-utility analysis of a work-place smoking cessation intervention with and without financial incentives. Addiction. 2020;115:534–545. doi: 10.1111/add.14861. [DOI] [PMC free article] [PubMed] [Google Scholar]
- 28. Stapleton JA, West R. A direct method and ICER tables for the estimation of the cost-effectiveness of smoking cessation interventions in general populations: application to a new cytisine trial and other examples. Nicotine Tob Res. 2012;14:463–471. doi: 10.1093/ntr/ntr236. [DOI] [PubMed] [Google Scholar]
- 29.Gold MR, Siegel JE, Russell LB, Weinstein MC, editors. New York, NY: Oxford University Press; 1996. [Google Scholar]
- 30. Latimer NR. Survival analysis for economic evaluations alongside clinical trials: extrapolation with patient-level data: inconsistencies, limitations, and a practical guide. Med Decis Making. 2013;33:743–754. doi: 10.1177/0272989X12472398. [DOI] [PubMed] [Google Scholar]
- 31. Grieve R, Hawkins N, Pennington M. Extrapolation of survival data in cost-effectiveness analyses: improving the current state of play. Med Decis Making. 2013;33:740–742. doi: 10.1177/0272989X13492018. [DOI] [PubMed] [Google Scholar]
- 32. Hajek P, Phillips-Waller A, Przulj D, Pesola F, Myers Smith K, Bisal N, et al. A randomized trial of e-cigarettes versus nicotine-replacement therapy. N Engl J Med. 2019;380:629–637. doi: 10.1056/NEJMoa1808779. [DOI] [PubMed] [Google Scholar]
- 33.National Academies of Sciences, Engineering, and Medicine. Washington, DC: National Academies Press; 2018. [Google Scholar]
- 34. Rosenberg MA, Feuer EJ, Yu B, Sun J, Henley SJ, Shanks TG, et al. Chapter 3: cohort life tables by smoking status, removing lung cancer as a cause of death. Risk Anal. 2012;32:S25–S38. doi: 10.1111/j.1539-6924.2011.01662.x. [DOI] [PMC free article] [PubMed] [Google Scholar]
- 35. Hughes JR, Peters EN, Naud S. Relapse to smoking after 1 year of abstinence: a meta-analysis. Addict Behav. 2008;33:1516–1520. doi: 10.1016/j.addbeh.2008.05.012. [DOI] [PMC free article] [PubMed] [Google Scholar]