

Abstract
Background
Firework‐related injuries cause significant morbidity to persons in the United States and globally. Prior studies have shown that hands and eyes are frequently injured, with loss of hand function and blindness being common after serious injury. Many jurisdictions in the United States have relaxed laws governing sales of consumer fireworks in recent years. Given the increased availability of consumer fireworks, we sought to determine the incidence of firework‐related injuries compared with historical controls.
Methods
Firework‐related injuries were identified in the National Emergency Department Sample (NEDS) using the corresponding International Classification of Disease codes for the years 2008–2017. Demographics, timing of presentation, and hospital characteristics were analyzed. Data were weighted to approximate population estimates of injury. Statistical analyses were completed using SAS. The National Electronic Surveillance System was also queried for firework‐related visits to check for consistency in observed trends.
Results
There were an estimated 7699 injuries attributed to fireworks in 2017 (2.37 per 100,000 population) compared with 5727 (1.88 per 100,000 population) in 2008. The majority of victims were male (74.6%), and injuries clustered in the pediatric and young adult age groups. The Midwest and South (both 38.1%) had more firework‐related injuries compared with the West (15.6%) and Northeast (8.2%) regions. Most visits occurred in July (71.4%) with smaller peaks in June (6.9%) and January (6.0%). Patients were disproportionately seen in trauma centers (34.0%) and teaching hospitals (49.6%).
Conclusion
Emergency department visits for firework injuries are increasing in the United States. Pediatric patients and young adult males comprise the majority of victims. Injuries are clustered around the Fourth of July and New Year's holidays. Public health interventions targeted at high‐risk groups may reduce the burden of injury.
Keywords: emergency department, fireworks, holiday injuries, injuries, United States
1. INTRODUCTION
1.1. Background
Around the world, consumer fireworks such as sparklers, Roman candles, bottle rockets, and small firecrackers are used to celebrate religious, cultural, and national holidays. 1 , 2 , 3 , 4 , 5 , 6 , 7 , 8 , 9 , 10 , 11 , 12 , 13 , 14 , 15 In the United States, firework‐related injuries cluster around the Independence Day and New Year's holidays. 16 , 17 Firework‐related injuries tend to occur in young patients and account for significant long‐term morbidity.
1.2. Importance
Firework injuries commonly affect children and adolescents with a marked male predominance; however, bystanders account for 40%–50% of those injured. 18 The distal upper extremity, eye, face, and head are the body parts that are most frequently injured. 17 Approximately 28% of injuries are considered severe. 19 A review by Wisse et al estimates that 1 in 6 persons with eye injuries will experience significant visual impairment. 18 Among hand injuries seen at a regional trauma center, 37% required at least a partial amputation. 20
In the United States, sales of consumer fireworks accounted for $1 billion in 2019, an increase of 57% over the past decade. 21 Multiple states have liberalized laws surrounding the use of consumer fireworks in the past decade, and some fireworks are legal in all states except Massachusetts. 22 The full account of the burden of firework‐related visits in the United States has not been studied since these changes took effect.
1.3. Goals of this investigation
We sought to evaluate trends in firework‐related injuries using the National Emergency Department Sample (NEDS) database from the years 2008 to 2017 given the changes in legislation governing sales and increased availability of consumer fireworks. Because prior work using a different database, the National Electronic Injury Surveillance System (NEISS), suggested that firework‐related injuries were decreasing, 23 , 24 we also queried the NEISS for the estimated number of injuries to determine if trends were consistent between databases. 25
2. METHODS
2.1. Data source and sample selection
We conducted a cross‐sectional study using the 2008–2017 Healthcare Cost and Utilization Project (HCUP) NEDS. The US Department of Health and Human Services Agency for Healthcare Research and Quality compiles and distributes information on healthcare use through the HCUP. The HCUP provides the hospital and discharge information necessary to calculate national estimates of emergency department (ED) visits, demographic information, and reasons for ED visits as well as charge information. The 2017 NEDS sample of the HCUP includes data from 33.5 million visits to 984 hospital‐owned EDs in 36 states and the District of Columbia. The NEDS sample is stratified by geographic region, trauma center designation, and urban–rural location of the hospital, teaching hospitals, and hospital ownership. The data approximates a 20% sample of all EDs in the United States.
Estimates of ED visits for firework injuries were also obtained from the NEISS. NEISS surveys ≈100 hospitals in the United States, also stratified by region and hospital characteristics.
2.2. Outcome variables
ED visits for firework injuries were identified from the survey records using International Classification of Diseases, Ninth Revision (ICD‐9) external cause of injury codes (E923.0 in 2008–2014 and quarters 1–3 of 2015) and International Classification of Diseases, Tenth Revision (ICD‐10; W39.xx in quarter 4 of 2015–2017) diagnosis codes. Estimates of ED visits for firework‐related injuries were computed from the survey data for each year and stratified by month of year. Rates of ED visits for firework‐related injuries were computed based on the estimated incidence and the estimated US population for each year (provided by the National Center of Health Statistics).
Injury patterns including types of injury and anatomical site injured were identified based on the ICD‐10 codes. The injury types identified were open wounds, burns, fractures, traumatic brain injury, and amputations. Anatomic site of injury was filtered by head, face, and neck; eye; and hand, including digits. The adoption of ICD‐10 prevents a direct comparison of current data to older literature that used ICD‐9 codes and was mapped to the Barell Injury Diagnosis Matrix.
The NEISS database was queried for firework injuries using the code 1313. 26
2.3. Predictor variables
Patient characteristics included age, sex, race, and median household income for the patient's zip code. Hospital characteristics included the census region where the hospital located, trauma center designation, teaching hospital status, and the urban–rural location of hospital.
2.4. Statistical analysis
The national estimate of ED visits for firework injuries was computed using the complex survey procedure according to the sampling design of NEDS, in which the patient visit weight, strata, and cluster variables were considered. Weighted analyses of patient and hospital characteristics between years of survey were conducted using the t test and Rao–Scott χ2 test, and P values were reported to demonstrate the degree of variability around the national estimates of these variables. We used the SAS software survey procedures (version 9.4; SAS Institute Inc, Cary, NC) for all analyses to account for the sampling design of NEDS to generate national estimates.
3. RESULTS
Between January 1, 2008, and December 31, 2017, there were a total of 11,982 ED visits having an ICD‐9 (code E923.0 years 2008–2014 and January–September 2015) or ICD‐10 (code W39 years final quarter 2015–2017) code indicating fireworks injury. This corresponds to a national estimate of 55,818 total injuries in the 10‐year period. There were 303,090,384 ED visits included in the NEDS database during that time frame, with firework injuries accounting for 41.2 per million ED visits (weighted percentage). Males accounted for 75.1% of all visits for firework injuries. Visits rose steadily throughout childhood, peaked in the age group of 15–19 year olds, and slowly declined with increasing age (Figure 1). More visits for firework injuries occurred in patients residing in neighborhoods from the 2 lower income quartiles (33.1% and 29.5%, respectively), with visits from patients in the highest income quartile neighborhoods being 14% of the total. ED visits for firework injuries were more likely to happen in the Midwest (39.2%) and the South (37.6%) regions compared with the West (14.9%) and Northeast (8.3%; Table 1).
FIGURE 1.
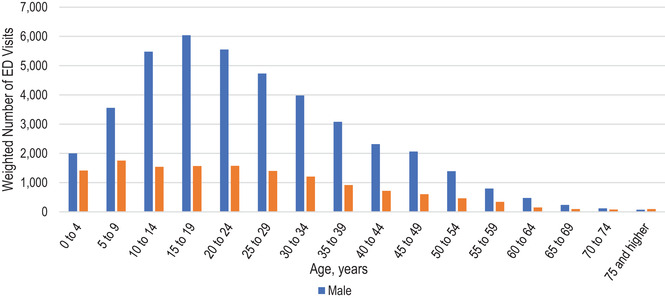
Firework‐related injuries by age and sex. ED, emergency department
TABLE 1.
Demographic and hospital characteristics for firework injuries
| Characteristic | n (%) | 95% CI of estimate |
|---|---|---|
| Age, years | ||
| ≤18 | 20,279 (36.3) | 18,723–21,835 |
| 19–34 | 21,518 (38.6) | 20,185–22,851 |
| 35–44 | 7033 (12.6) | 6527–7538 |
| 45–64 | 6285 (11.3) | 5777–6792 |
| 65 and older | 703 (1.3) | 575–831 |
| Sex | ||
| Male | 41,899 (75.1) | 39,514–44,284 |
| Female | 13,919 (24.9) | 12,915–14,922 |
| Median household income for patient's zip code in quartiles ($) | ||
| Quartile 1 | 18,182 (33.1) | 16,792–19,572 |
| Quartile 2 | 16,234 (29.5) | 15,057–17,412 |
| Quartile 3 | 12,831 (23.3) | 11,818–13,844 |
| Quartile 4 | 7722 (14.0) | 7041–8402 |
| Hospital region | ||
| Northeast | 4614 (8.3) | 3871–5357 |
| Midwest | 21,903 (39.2) | 19,490–24,317 |
| South | 20,991 (37.6) | 19,247–22,735 |
| West | 8310 (14.9) | 7494–9126 |
| Trauma center designation | ||
| Not a trauma center | 25,867 (46.3) | 24,287–27,447 |
| Level 1 | 11,433 (20.5) | 9121–13,744 |
| Level 2 | 6002 (10.8) | 5252–6753 |
| Level 3 | 6533 (11.7) | 5404–7662 |
| Unclassified | 5983 (10.7) | 5346–6619 |
Abbreviation: CI, confidence interval.
The Bottom Line.
Every year thousands of Americans are injured by fireworks. In this analysis of the National Emergency Department Sample, between 2008 and 2017 annual firework injuries increased from 5727 (1.88 per 100,000 population) to 7699 (2.37 per 100,000 population), with >70% occurring in July. Recent laws relaxing access to consumer fireworks may be linked with the higher injury rates.
The annual unweighted and weighted ED visits from both the NEDS and NEISS along with the total US population and the number of firework injuries per 100,000 populations are shown in Table 2 and Figure 2. Annual estimated ED visits from the NEDS ranged from a low of 4103 in 2009 to a high of 7699 in 2017. Table 3 stratifies firework‐related ED visits by month and weekend versus weekday status. ED visits for firework injuries are concentrated in June and July (7.6% and 70.7%, respectively) and December and January (3.1% and 6.2%), corresponding to the Independence Day and New Years’ Day holidays in the United States.
TABLE 2.
Emergency department visits for firework injuries by year, population, and data source
| Year | National population | NEDS unweighted n | NEDS weighted n | NEDS 95% CI | NEDS rate per 100,000 | NEISS unweighted n | NEISS weighted n | NEISS 95% CI | NEISS rate per 100,000 |
|---|---|---|---|---|---|---|---|---|---|
| 2008 | 304,093,966 | 1233 | 5727 | 4941–6512 | 1.8832 | 194 | 7044 | 5124–8963 | 2.316 |
| 2009 | 306,771,529 | 881 | 4103 | 3571–4636 | 1.3376 | 233 | 8813 | 6782–10,844 | 2.873 |
| 2010 | 309,321,666 | 1062 | 4877 | 4247–5507 | 1.5765 | 244 | 8631 | 6551–10,710 | 2.79 |
| 2011 | 311,556,874 | 1049 | 4999 | 4359–5639 | 1.6044 | 275 | 9599 | 7566–11,631 | 3.081 |
| 2012 | 313,830,990 | 919 | 4270 | 3550–4990 | 1.3606 | 256 | 8658 | 6720–10,595 | 2.759 |
| 2013 | 315,993,715 | 1045 | 4904 | 4192–5615 | 1.5519 | 275 | 11,361 | 8063–14,659 | 3.595 |
| 2014 | 318,301,008 | 1154 | 5502 | 4808–6196 | 1.7285 | 271 | 10,512 | 7618–13,407 | 3.302 |
| 2015 | 320,635,163 | 1314 | 6452 | 5649–7256 | 2.0123 | 296 | 12,011 | 9104–14,917 | 3.746 |
| 2016 | 322,941,311 | 1591 | 7286 | 6408–8164 | 2.256 | 268 | 11,133 | 8271–13,995 | 3.447 |
| 2017 | 324,985,539 | 1734 | 7699 | 6753–8646 | 2.3692 | 329 | 12884 | 9593–16,176 | 3.964 |
Abbreviations: CI, confidence interval; NEDS, National Emergency Department Sample; NEISS, National Electronic Injury Surveillance System.
FIGURE 2.
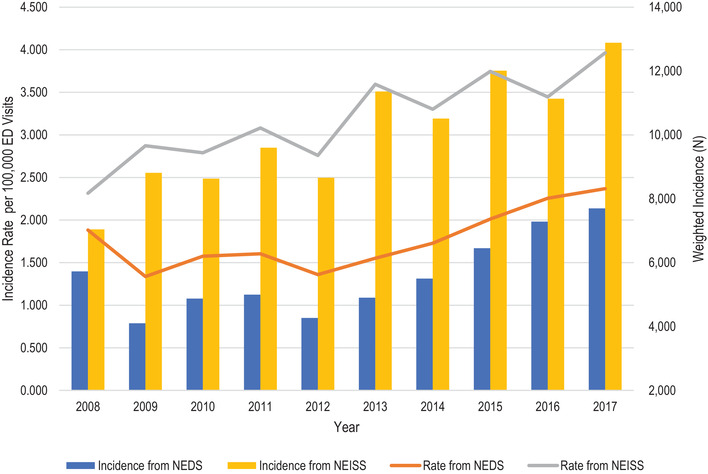
Emergency department (ED) visits for firework injuries by year, population, and data source. NEDS, National Emergency Department Sample; NEISS, National Electronic Injury Surveillance System
TABLE 3.
Emergency department visits by month and day of week
| Characteristic | n (%) | 95% CI of estimate |
|---|---|---|
| Month | ||
| January | 3111 (6.2) | 2608–3615 |
| February | 458 (0.9) | 363–554 |
| March | 472 (0.9) | 369–575 |
| April | 690 (1.4) | 568–812 |
| May | 987 (2.0) | 838–1136 |
| June | 3570 (7.1) | 3243–3898 |
| July | 35,670 (70.7) | 33,295–38,044 |
| August | 1608 (3.2) | 1396–1821 |
| September | 894 (1.8) | 737–1051 |
| October | 774 (1.5) | 638–911 |
| November | 668 (1.3) | 517–819 |
| December | 1552 (3.1) | 1309–1794 |
| Day of week | ||
| Weekday | 34,375 (61.6) | 32,137–36,614 |
| Weekend | 21,438 (38.4) | 20,221–22,655 |
Abbreviation: CI, confidence interval.
Visits to level 1 trauma hospitals comprised 20.5% of all firework injuries, with 10.8% of visits occurring at level 2 trauma centers and 58% occurring at level 3 or non‐trauma‐rated hospitals. Nearly half of all firework injuries are seen at teaching hospitals in metropolitan areas (49.6%) compared with nonteaching hospitals in metropolitan areas (28.5%) and hospitals in nonmetropolitan areas (21.9%).
Using ICD‐10 codes from visits during quarter 4 of 2015 through the end of 2017, injuries to the eyes, head and neck region, and hand comprised ≈70% of all firework‐related injuries. Injuries to the hand (46.6% of all injuries) included burns, open wounds, fractures, and amputations. Injuries to the head, face, and neck accounted for 17.3% of all injuries, including burns, open wounds, and skull or facial fractures. Injuries to the globe and burns of the eye accounted for 16.6% of all visits. Injuries to other parts of the body accounted for 28.9% of all visits combined (Table 4). Most ED visits coded for a single injury (62.4%), with 2 injuries coded for 7.7% of visits and 3 injuries coded for 0.9% of visits.
TABLE 4.
Anatomical site injured in firework‐related emergency department visits
| Injured body part | Weighted n (%) | 95% CI of estimate |
|---|---|---|
| Head | 2665 (17.3) | 2387–2943 |
| Eye | 2555 (16.6) | 2290–2820 |
| Hand | 7160 (46.6) | 6530–7791 |
Abbreviation: CI, confidence interval.
Most patients (81.4%) were able to be discharged after their ED visit. Patients were admitted to the hospital on the initial ED visit in 8.6% of cases and transferred to a higher level of care in 6.8% of cases. Deaths occurred in 0.05% of cases.
4. LIMITATIONS
This study uses the NEDS database, which is composed of administrative data that are used primarily for billing. Information regarding the mechanism of injury is not required for billing purposes and may not be accurately entered. 27 , 28 , 29 This may cause firework‐related injuries to be underestimated, as such injuries would not have been captured with our search strategy. To verify trends toward increasing firework injuries and to allow for easier comparisons with other studies, the NEISS was also queried. NEISS estimates are consistently higher than NEDS data, but the standard errors and confidence intervals of the NEISS estimates are large given the smaller sample.
5. DISCUSSION
ED visits for firework injuries in the United States have increased during the past 10 years. Consistent with prior literature, there is an ≈3:1 male predominance, and injuries cluster around the New Year's and Fourth of July holidays. Hands are the most frequently injured anatomic site, followed by facial/head/neck and ocular injuries. The distribution of injuries by anatomic site using ICD‐10 data is similar to injuries reported in a previous study that used ICD‐9 data. 17 Injuries are more common in urban areas and in the Midwest and South regions of the United States, and patients disproportionately come from lower income quartiles.
A large proportion of firework‐related visits occur in levels 1 and 2 trauma centers. This may reflect the severity of injuries or poor access to specialty care in referring hospitals. Our study found higher rates of admission (8.6% vs 6.3%) and transfer to a higher level of care (6.8% vs 5.1%) with a corresponding lower rate of discharge when compared with data from 2006 to 2010. 17 Myers et al found that the proportion of pediatric injuries that require admission and the length of stay nationwide have increased in association with the liberalization of firework laws. 30 Rudisill et al found that the number of injuries increased at their trauma center in West Virginia after regulations of consumer fireworks were relaxed in the state, but there was no increase in the severity of injuries. 19 An alternative explanation for the increased proportion of severe injuries seen in hospital EDs is that patients with less severe injuries may self‐triage to urgent care centers (UCCs), and access to UCCs is increasing. 31 , 32
Given the high rate of ocular and hand trauma, a lack of access to specialty care may also drive increased visits to tertiary hospitals. A survey from Florida indicated that only 7% of rural EDs and 61% of nonrural EDs have ophthalmology call coverage. 33 Likewise, many hospitals do not have access to emergency consultation by hand specialists, particularly hospitals in rural or less‐wealthy regions. 34 , 35 , 36
Multiple jurisdictions have relaxed laws concerning the sales of consumer fireworks in the past 10 years. 22 National data sets do not have the granularity required to evaluate the effects of local policy changes, but several studies have found that the liberalization of firework sales results in higher rates of injury at the state level. 19 , 37 Studies looking at the effects of laws limiting access to consumer fireworks in other countries support the fact that restrictions can reduce the incidence of firework‐related injuries. 38
The American Pyrotechnics Association provides data on the use of fireworks in the United States and states that the injury rate is decreasing; however, they use the pounds of fireworks sold as the denominator. As other authors have discussed, this may not be the best measure. 17 Sales of fireworks have increased rapidly with the liberalization of laws and have outpaced the rise in ED visits for injuries. We believe that the rate of ED visits per 100,000 provides a better measure of the impact of firework injuries than the rate of injuries per poundage sold.
Besides legal restrictions on consumer fireworks, public health interventions may be beneficial in reducing the burden of injuries. McMillan et al proposed graphic image warnings on firework packages and found that the population of the United Kingdom would find this an acceptable safety measure. 39 An educational intervention aimed at children was successful in reducing injuries among younger children and reducing disability‐associated life‐years associated with firework injuries during the Persian Festival of Fire. 40 Conversely, an educational intervention did not reduce risky fireworks behavior among schoolboys in Iran. 41
ED visits for firework‐related injuries are increasing, both in number and in rate per 100,000 population. This trend occurs in the setting of increased sales of consumer fireworks in the United States. Demographics and distribution of injuries appear similar to prior studies. More patients are being seen primarily at levels 1 and 2 trauma centers and being transferred for a higher level of care, but it is not clear whether this is a result of injuries being more severe or reduced access to specialty services at smaller facilities. EDs should consider supplementing on‐call specialty staff for high‐risk holidays. Public health interventions tailored to high‐risk populations in the United States should be implemented and assessed for effectiveness.
CONFLICT OF INTEREST
The authors have no conflicts of interest to disclose.
AUTHOR CONTRIBUTIONS
Cindy C. Bitter participated in the study concept and data interpretation and drafted the article. Zidong Zhang participated in data acquisition and statistical analysis. Andrew W. Talbert and Alizabeth K. Weber drafted the article. Leslie Hinyard participated in the study design, statistical expertise, and critical revision of the article.
Bitter CC, Zhang Z, Talbert AW, Weber AK, Hinyard L. Firework injuries are increasing in the United States: An analysis of the National Emergency Department Sample. JACEP Open. 2021;2:e12600. 10.1002/emp2.12600
Supervising Editor: Bernard Chang, MD, PhD.
Meetings: Preliminary data were presented at the Society for Academic Emergency Medicine virtual conference, May 2021.
This work was supported by a Spark Microgrant from the Office of the Vice President of Research, Saint Louis University.
REFERENCES
- 1. Van Yperen DT, Van der Vlies CH, De Faber JTHN, et al. Epidemiology, treatment, costs, and long‐term outcomes of patients with fireworks‐related injuries (ROCKET); a multicenter prospective observational case series. PLoS One. 2020;15(3):e0230382. [DOI] [PMC free article] [PubMed] [Google Scholar]
- 2. Li C, Lin Y, Xiao H, Lin H, Chen Y, Dai M. Epidemiology of pediatric eye injuries requiring hospitalization in rural areas of Wenzhou and Changsha, China: a 10‐year retrospective study. BMC Ophthalmol. 2020;20(1):100. [DOI] [PMC free article] [PubMed] [Google Scholar]
- 3. Apakama AI, Anajekwu CC. Ocular fireworks injuries in Eastern Nigeria: a 3‐year review. Niger J Surg. 2019;25:42‐44. [DOI] [PMC free article] [PubMed] [Google Scholar]
- 4. Nizamoglu M, Frew Q, Tan A, et al. The ten‐year experience of firework injuries treated at a UK burns & plastic surgery unit. Ann Burns Fire Disasters. 2018;31:13‐16. [PMC free article] [PubMed] [Google Scholar]
- 5. Chaparro‐Navaez P, Cotes‐Cantillo K, Castañeda‐Orjuela C, De la Hoz‐Restrepo F. Injuries due to fireworks use: a surveillance data analysis in Columbia, 2008–2013. Burns. 2017;43:149‐156. [DOI] [PubMed] [Google Scholar]
- 6. Read DJ, Bradbury R, Yeboah E. Firework‐related injury in the Top End: a 16‐year review. ANZ J Surg. 2017;87(12):1030‐1034. [DOI] [PubMed] [Google Scholar]
- 7. Venkatesh R, Gurav P, Tibrewal S, et al. Appraising the spectrum of firework trauma and the related laws during Diwali in North India. Indian J Ophthalol. 2017;65:140‐143. [DOI] [PMC free article] [PubMed] [Google Scholar]
- 8. Roca JB, de los Reyes VC, Racelis S, et al. Fireworks‐related injury surveillance in the Philippines: trends in 2010–2014. West Pac Surveill Response J. 2015;6(4):1‐6. [DOI] [PMC free article] [PubMed] [Google Scholar]
- 9. Wang C, Zhao R, Du WL, Ning FG, Zhang GA. Firework injuries at a major trauma and burn center: a five‐year prospective study. Burns. 2014;40(2):305‐310. [DOI] [PubMed] [Google Scholar]
- 10. Alinia S, Rezaei S, Daroudi R, Hadadi M, Akbari Sari A. Extent, nature and hospital costs of fireworks‐related injuries during the Wednesday Eve festival in Iran. J Inj Violence Res. 2013;5(1):11‐16. [DOI] [PMC free article] [PubMed] [Google Scholar]
- 11. Pallantzas A, Kourakos P, Stampolidis N, et al. Burns during Easter festivities in Greece. Ann Burns Fire Disasters. 2012;25:171‐177. [PMC free article] [PubMed] [Google Scholar]
- 12. Rashid RA, Heidary F, Hussein A, et al. Ocular burns and related injuries due to fireworks during the Aidil Fitri celebration on the East Coast of Peninsular Malaysia. Burns. 2011;37:170‐173. [DOI] [PubMed] [Google Scholar]
- 13. Tavakoli H, Khashayar P, Amoli HA, et al. Firework‐related injuries in Tehran's Persian Wednesday Eve Festival (Chaharshanbe Soori). J Emerg Med. 2011;40:340‐345. [DOI] [PubMed] [Google Scholar]
- 14. Smittenberg MN, Lungelow D, Rode H, van As AB, Millar JW. Can fireworks‐related injuries to children during festivities be prevented? S Afr Med J. 2010;100:525‐528. [DOI] [PubMed] [Google Scholar]
- 15. Puri V, Mahendru S, Rana R, Deshpande M. Firework injuries: a ten‐year study. J Plast Reconstr Aesthet Surg. 2009;62(9):1103‐1111. [DOI] [PubMed] [Google Scholar]
- 16. Shiuey EJ, Kolomeyer AM, Kolomeyer NN. Assessment of firework‐related ocular injury in the US. JAMA Ophthalmol. 2020;138:618‐623. [DOI] [PMC free article] [PubMed] [Google Scholar]
- 17. Canner JK, Haider AH, Selvarajah S, et al. US emergency department visits for fireworks injuries, 2006–2010. J Surg Res. 2014;190(1):305‐311. [DOI] [PubMed] [Google Scholar]
- 18. Wisse RP, Bijlsma WR, Stilma JS. Ocular firework trauma: a systematic review on incidence, severity, outcome and prevention. Br J Ophthalmol. 2010;94(12):1586‐1591. [DOI] [PubMed] [Google Scholar]
- 19. Rudisill TM, Preamble K, Pilkerton C. The liberalization of fireworks legislation and its effects on firework‐related injuries in West Virginia. BMC Public Health. 2020;20(1):137. [DOI] [PMC free article] [PubMed] [Google Scholar]
- 20. Sandvall BK, Jacobson L, Miller EA, et al. Fireworks type, injury pattern, and permanent impairment following severe fireworks‐related injuries. Am J Emerg Med. 2017;35:1369‐1373. [DOI] [PubMed] [Google Scholar]
- 21. American Pyrotechnics Association . U.S. Fireworks Industry Revenue Figures Breakdown by Industry Segment 1999–2019. American Pyrotechnics Association; 2021. [Google Scholar]
- 22. American Pyrotechnics Association . Fireworks‐Related Injury Rates Continue to Decline as States Liberalize Laws. American Pyrotechnics Association; 2020. [Google Scholar]
- 23. Moore JX, McGwin G, Griffin RL. The epidemiology of firework‐related injuries in the United States: 2000–2010. Injury. 2014;45:1704‐1709. [DOI] [PubMed] [Google Scholar]
- 24. Billock RM, Chounthirath T, Smith GA. Pediatric firework‐related injuries presenting to Unites States emergency departments, 1990–2014. Clin Pediatr. 2017;56(6):535‐544. [DOI] [PubMed] [Google Scholar]
- 25. US Product Safety Commission . National Electronic Injury Surveillance System Query Builder. US Product Safety Commission; 2021. [Google Scholar]
- 26. US Product Safety Commission . National Electronic Injury Surveillance System Coding Manual. Washington, DC: US Consumer Product Safety Commission; 2020. [Google Scholar]
- 27. Min J, Gurka KK, Kalesan B, Bian J, Prosperi M. Injury burden in the United States: accurate, reliable, and timely surveillance using electronic health care data. Am J Public Health. 2019;109(12):1702‐1706. [DOI] [PMC free article] [PubMed] [Google Scholar]
- 28. Samuel AM, Lukasiewicz AM, Webb ML, et al. ICD‐9 diagnosis codes have poor sensitivity for identification of preexisting comorbidities in traumatic fracture patients: a study of the National Trauma Data Bank. J Trauma Acute Care Surg. 2015;79(4):622‐630. [DOI] [PubMed] [Google Scholar]
- 29. McKenzie K, Enraght‐Moony EL, Walker SM, McClure RJ, Harrison JE. Accuracy of external cause‐of‐injury coding in hospital records. Inj Prev. 2009;15(1):60‐64. [DOI] [PubMed] [Google Scholar]
- 30. Myers J, Lehna C. Effect of fireworks laws on pediatric fireworks‐related burn injuries. J Burn Care Res. 2017;38(1):e79‐e82. [DOI] [PubMed] [Google Scholar]
- 31. Mukamel DB, Ladd H, Amin A, Sorkin DH. Patients’ preferences over care settings for minor illnesses and injuries. Health Serv Res. 2019;54:827‐838. [DOI] [PMC free article] [PubMed] [Google Scholar]
- 32. Llovera I, Loscalzo K, Gao J, et al. Increased access to urgent care centers decreases low acuity diagnoses in a nearby hospital emergency department. Am J Emerg Med. 2019;37(3):486‐488. [DOI] [PubMed] [Google Scholar]
- 33. Ayoub S, Tauber J, Tsui E, Shah P, Rathi S. Assessing the demand for teleophthalmology in Florida emergency departments. Investig Ophthalmol Vis Sci. 2019;60:5477. [DOI] [PubMed] [Google Scholar]
- 34. Whipple LA, Kelly T, Aliu O, Roth MZ, Patel A. The crisis of deficiency in emergency coverage for hand and facial trauma: exploring the discrepancy between availability of elective and emergency surgical coverage. Ann Plast Surg. 2017;79(4):354‐358. [DOI] [PubMed] [Google Scholar]
- 35. Chung SY, Sood A, Granick MS. Disproportionate availability between emergency and elective hand coverage: a National Trend? Eplasty. 2016;16:e28. [PMC free article] [PubMed] [Google Scholar]
- 36. Mueller MA, Zaydfudim V, Sexton KW, Shack RB, Thayer WP. Lack of emergency hand surgery: discrepancy between elective and emergency hand care. Ann Plast Surg. 2012;68(5):513‐517. [DOI] [PubMed] [Google Scholar]
- 37. Roesler JS, Day H. Sparklers, smoke bombs, and snakes, oh my! Effect of legislation on fireworks‐related injuries in Minnesota, 1999–2005. Minn Med. 2007;90(7):46‐47. [PubMed] [Google Scholar]
- 38. de Farber JT, Kivelä TT, Gabel‐Pfisterer A. Studies from the Netherlands and Finland and the impact of regulations on incidence of fireworks‐related eye injuries. Opthalmologe. 2020;117(supp 1):36‐42. [DOI] [PubMed] [Google Scholar]
- 39. McMillan A, Hassan S, Moorby J, Anwar MU, Muthayya P. The public's perception of firework safety and proposed use of graphic warning images on packaging. J Plast Reconstr Aesthet Surg. 2020;73:608‐620. [DOI] [PubMed] [Google Scholar]
- 40. Homaie Rad E, Kouchakinezhad‐Eramsadati L, Mohtsham‐Amiri Z, Davoudi‐Kiakalayeh A, Yousefzadeh‐Chabok S. Effectiveness of an educational program on decreasing burns and injuries in Persian festival of fire: a burden of diseases approach. Burns. 2019;45:466‐470. [DOI] [PubMed] [Google Scholar]
- 41. Naseripour M, Hamidian R, Smith GA, Saadat S. Effectiveness of educational interventions on fireworks‐related injuries among schoolboys. Am J Health Behav. 2017;41:223‐227. [DOI] [PubMed] [Google Scholar]