Abstract
Background and Objectives
To establish serum concentration of protein S100B as an objective biomarker surrogate for astroglial tissue damage after mechanical thrombectomy in patients with acute ischemic stroke.
Methods
This prospective 2-center study recruited patients with acute middle cerebral artery infarctions caused by large vessel occlusion treated with mechanical thrombectomy. Blood samples were collected at day 2 after intervention and analyzed for S100B serum concentrations using ELISA techniques. Infarct size was determined on follow-up brain imaging and functional outcome according to modified Rankin Scale (mRS) was assessed at 90 days.
Results
A total of 171 patients were included (mean age ± SD: 70 ± 14 years, 42% female). S100B levels correlated with infarct size. Median S100B concentrations at day 2 after intervention were lower in patients with favorable outcome (mRS score 0–1) at 90 days compared to patients with unfavorable outcome (mRS score 2–6) (median 0.10 µg/L [interquartile range 0.07–0.14] vs 0.20 µg/L [0.11–0.48], p < 0.001). Younger age (odds ratio [OR] 1.120 [confidence interval (CI) 1.068–1.174]; p < 0.001), lower National Institutes of Health Stroke Scale score 24 hours after symptom onset (OR 1.232 [CI 1.106–1.372]; p < 0.001), and lower S100B serum concentrations (OR 1.364 [CI 1.105–1.683]; p = 0.004) were independently associated with a favorable outcome. S100B was able to eliminate the lateralization bias associated with the use of mRS for functional outcome assessment at 90 days after stroke.
Discussion
S100B serum concentrations after mechanical thrombectomy indicate the extent of ischemic tissue damage. This can be assessed rapidly, independent of brain imaging and clinical outcome scales. Following prospective validation in further studies, this may provide an objective surrogate outcome measure both in clinical routine and interventional trials.
Classification of Evidence
This study provides Class I evidence that S100B 2 days following mechanical thrombectomy for acute ischemic stroke accurately distinguishes favorable from unfavorable functional outcome.
Mechanical thrombectomy (MT) is a highly effective treatment for patients with large artery occlusive stroke. Evidence was generated by randomized controlled trials evaluating both established and extended time windows.1,2 All of these studies used the modified Rankin scale (mRS) at 90 days for primary outcome assessment.3,4 However, the reliability of such crude outcome scales is frequently questioned in the literature, among others due to significant interrater variability5-7 and lateralization bias8,9 induced by hemispheric-specific occurrence of neurologic deficits. In the nondominant hemisphere, even larger supratentorial infarcts may not necessarily translate into measurable disability (in terms of the mRS), but subtle neuropsychological changes may persist, hampering patients' quality of life in the long run.10,11 In the dominant hemisphere, even smaller infarcts in eloquent locations may cause severe aphasia, hampering rehabilitation prognosis and increasing long-term disability.
A rapidly available and objective surrogate endpoint measure providing information on the extent of tissue damage following ischemic stroke and MT would be a valuable adjunct to the functional outcome determined by mRS.12 Notably, final infarct volume on follow-up brain imaging is not commonly used as a surrogate measure. Its reliable determination requires advanced imaging processing tools to cover the patchy infarct zones resulting from thrombus fragmentation and to deal with the subtle changes of signal intensity at the borders of the ischemic core on T2 and fluid-attenuated inversion recovery sequences.13
The astroglial protein S100B has been investigated in patients with ischemic stroke for many years. S100B serum concentrations measured 48–72 hours after symptom onset are highly correlated to final infarct volume (i.e., the ischemic core) and functional outcome.14-17 Moreover, studies demonstrated that successful recanalization of large vessel occlusion (LVO) (i.e., without evidence of demarcated infarcts on follow-up brain imaging) does not result in astroglial protein (S100B, GFAP) elevation in the bloodstream.18,19 In other words, S100B is an indicator of the extent of the ischemic core (i.e., astroglial tissue damage on a cellular level), but not of transient perfusion deficits, even in case of LVO. This makes S100B an ideal surrogate outcome biomarker for patients with ischemic stroke who undergo MT.
The aim of this study was to establish S100B serum concentrations at day 2 after mechanical recanalization as an objective surrogate indicating the amount of astroglial tissue damage. Potential applications comprise the prediction of functional outcome in individual stroke cases (separated for the left and right hemisphere) as well as its use as a monitoring measure for tissue outcome in clinical trials and in quality assurance processes.
Methods
Study Design and Study Centers
The Biomarker for Prediction of Outcome After Mechanical Thrombectomy in Acute Ischemic Stroke Study (BE PROMETHEUS) was designed as a 2-center prospective trial conducted at the Department of Neurology, Goethe-University Hospital, Frankfurt am Main, Germany, and the Department of Neurology, University Hospital, Augsburg, Germany. Both centers are members of IGNITE (Initiative for German NeuroIntensive Trial Engagement).20
Standard Protocol Approvals, Registrations, and Patient Consents
The institutional review boards of both centers approved the study protocol on human experimentation (242-17). The study has been performed in accordance with the ethical standards as laid down in the 1964 Declaration of Helsinki and its later amendments. It followed the guidelines for reporting observational studies (STROBE).21 Written informed consent for study participation was obtained from patients or their legal representatives (after MT, but before blood sampling).
Data Availability
Anonymized data used in this study are available on request from Dr. Luger.
Sample Size Calculation
Our study was designed to provide Class I evidence regarding the value of S100B on day 2 after MT in predicting functional outcome at 90 days. Based on previous investigations in patients with stroke with LVO receiving IV thrombolysis,18 we assumed S100B serum concentrations on day 2 after MT to be lower in patients with successful vessel recanalization as compared to patients with persistent vessel occlusion. Furthermore, based on randomized clinical trials, we assumed a ratio between patients with a favorable (mRS 0–1) and an unfavorable functional outcome at 90 days of 1:2.1 Thus, sample size calculation (clincalc.com) was based on the following measures: mean S100B in mRS 2–6: 1.0 + 1.2 µg/L, mean S100B in mRS 0–1: 0.4 µg/L, enrollment ratio 0.5, α 0.05, power 80%. This resulted in a sample size of at least 141 patients. In total, 171 patients were recruited.
Inclusion of Patients
All consecutive patients admitted to the study centers with an acute middle cerebral artery (MCA) infarction caused by LVO (i.e., carotid T, M1, or M2 branch) scheduled to undergo endovascular stroke treatment were screened (at Frankfurt University between January 2017 and October 2019; at Augsburg University between March 2019 and October 2019). The indication to perform MT was based on current clinical guidelines.22 MT was performed with a balloon guide catheter and stent retriever (Solitaire Revascularization Device). Alternatively, distal intermediate and aspiration catheters were used in combination with a stent retriever. Exclusion criteria were (1) age below 18 years, (2) any stroke or TIA within the last 3 months, (3) known malignant melanoma in medical history, (4) traumatic brain injury within the last 3 months (including head concussion at onset of symptoms). Traumatic brain injury and malignant melanoma increase serum concentrations of S100B.23,24
Clinical Measures
The following clinical baseline variables were collected: age, sex, mRS before admission, information on previous diseases and vascular risk factors, National Institutes of Health Stroke Scale (NIHSS) at admission and at 24 hours, the Alberta Stroke Program Early CT Score (ASPECTS) based on initial, pretreatment brain imaging, radiologic classification of vessel occlusion based on first diagnostic angiography (i.e., CT angiography [CTA] or magnetic resonance angiography [MRA] prior to any intervention), thrombolytic therapy, recanalization status after MT (modified Thrombolysis in Cerebral Infarction [mTICI] classification25), and stroke etiology according to TOAST (Trial of Org 10172 in Acute Stroke Treatment) classification.26 Three months after discharge from the acute hospital treatment, a standardized telephone interview was conducted with each patient or next of kin to determine the current mRS.27
Blood Sampling and S100B Measurement
Previous studies reported a steady increase of S100B values after ischemic stroke onset with maximum values observed between 48 and 72 hours. The timepoint 48 hours emerged as best predictive for final infarct volume and functional outcome.14-17 For our study, at day 2 after MT, a venous blood sample was drawn using serum tubes with clot activator (S-Monovette, 4.7 mL, Sarstedt). Blood samples were delivered to the laboratory at the respective study center for centrifugation within 2 hours after collection. Serum was pipetted in 0.5 mL aliquots and frozen down, first at −20°C and then moved to −80°C for long-term storage until analysis. A temperature-controlled transport on dry ice was later used for shipment for the samples from Augsburg to Frankfurt am Main, where all samples were measured at a single time point.
The determination of the biomarker S100B was performed at the central laboratory of the University Hospital Frankfurt am Main via an approved and commercially available electrochemiluminescence S100B immunoassay (ECLIA; Elecsys S100, Roche Diagnostics Deutschland GmbH).28 This ECLIA works as a sandwich immunoassay with Ruthenium-(II)-tris (bipyridyl) conjugated antibodies. The targeted protein S100B forms a complex with free and fixed antibodies so that the serum concentration correlates with the number of Ruthenium complexes. In a following redox reaction, photons are emitted under consumption of tripropylamine. The emerging light with a wavelength of 620 nm is registered and summated. Serum samples were processed and assayed by laboratory technicians who were blinded to all clinical information. The technical details are as follows: lower limit of detection 0.005 µg/L, measuring range 0.005–39 µg/L, repeatability 0.7%–2.1%, reproducibility 1.7%–3.1%, 95% percentile of normal controls 0.105 µg/L.29
Infarct Size Quantification
Infarct size was determined semiquantitatively by experienced neuroradiologists (E.H., C.J.M.) based on the follow-up brain imaging (mostly cranial CT) performed the day after MT (day 1 after intervention) according to a common 3-tiered scale: infarct size <1/3 MCA territory, 1/3–2/3 MCA territory, or >2/3 MCA territory or multiple vascular territories (e.g., MCA and anterior cerebral artery).30 Hemorrhagic transformation was also assessed as present or not present according National Institute of Neurological Disorders and Stroke trial criteria.31
Statistical Analysis
Statistical analyses were performed using IBM SPSS Statistics, version 22 (Statistical Package for the Social Sciences). Baseline variables and S100B values were compared between outcome groups using the t test, the Mann-Whitney U test, or the χ2 test, depending on level of measurement. Binary logistic regression analysis was used to identify independent predictors of functional outcome. Here, mRS at 90 days (0–1 vs 4–6) was included as the dependent variable, and S100B, age, sex, NIHSS at admission, NIHSS at 24 hours, mTICI, and ASPECTS were included as independent variables (see different models in the supplemental files: eTable 1a/b/c/d, links.lww.com/WNL/B604). A significance level of α = 0.05 was chosen for all tests.
Results
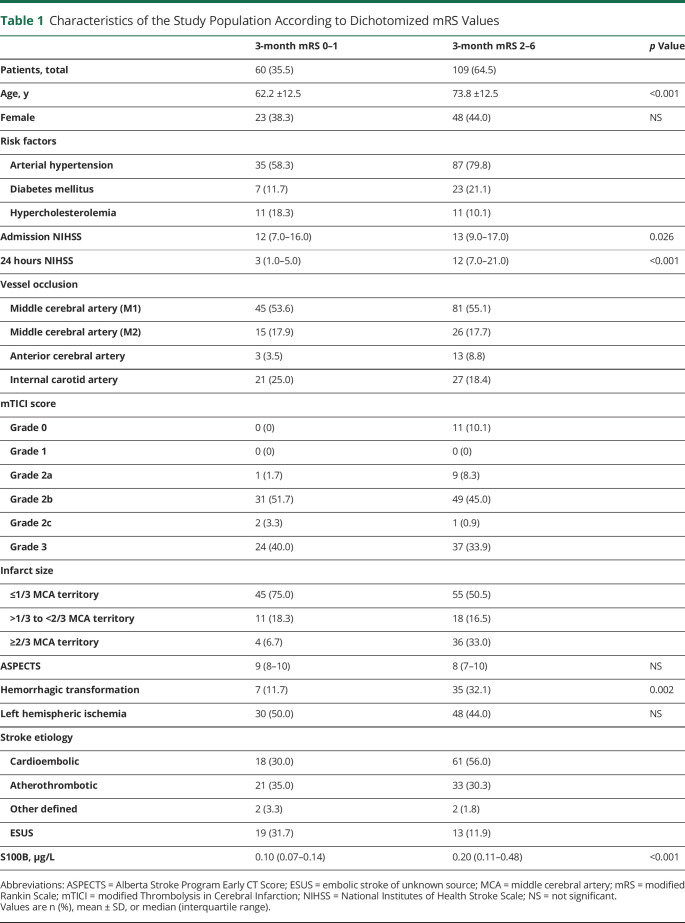
A total of 171 patients with acute ischemic with stroke were included in this study. Mean age (±SD) was 70 ± 14 years, and 42% were female. On initial diagnostic angiography (CTA or MRA), MCA-M1 occlusion was documented in 128 patients, MCA-M2 occlusion in 41, anterior cerebral artery occlusion in 16, and carotid occlusion in 49 (multiple occlusions were possible). Fifty-seven percent of patients were treated with thrombolysis. Following MT, no recanalization or minimal recanalization (TICI 0–1) was achieved in 7%, partial filling of the territory <50% (TICI 2a) in 6%, partial filling ≥50% (TICI 2b) in 48%, near complete reperfusion (TICI 2c) in 2%, and complete reperfusion in 37%. When dichotomizing the functional outcome 3 months after MT, 60 patients (36%) had a favorable outcome (mRS score 0–1) and 109 patients (65%) had an unfavorable outcome (mRS score 2–6). Two patients were unavailable for outcome assessment. Table 1 depicts further baseline variables of the study population stratified according to outcome groups.
Table 1.
Characteristics of the Study Population According to Dichotomized mRS Values
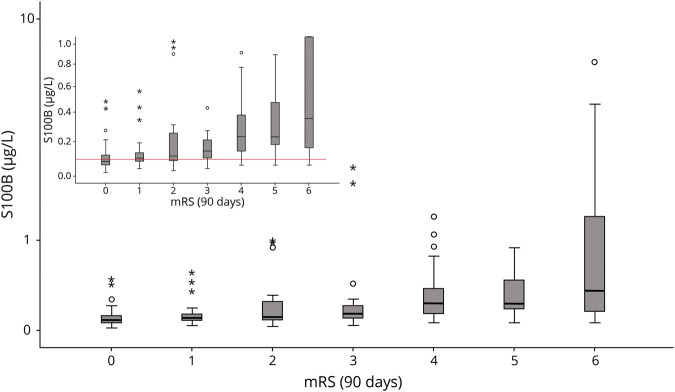
Median S100B concentrations at day 2 after MT were lower in patients having a favorable outcome (mRS score 0–1) at 90 days compared to patients with an unfavorable outcome (median 0.10 µg/L [interquartile range (IQR) 0.07–0.14] vs 0.20 µg/L [0.11–0.48], p < 0.001). Figure 1 depicts the steady increase of S100B values on day 2 in parallel with poorer functional outcomes at 3 months. When stratifying for the affected side, it was apparent that in right-sided MCA infarction even larger tissue damage (in terms of S100B values) may still result in favorable mRS outcomes. In contrast, in left-sided MCA infarction, S100B values in the highest tertile predicted unfavorable outcome in 100% of cases. The distribution of mRS outcomes stratified according to S100B values and the affected side are displayed in Figure 2.
Figure 1. Distribution of S100B Values Stratified According to mRS Categories at 3 Months.
Boxplots depicting the distribution of the S100B values on day 2 stratified according to modified Rankin Scale (mRS) categories at 3 months. The box boundaries depict the 25th and 75th percentile, the line within the box indicates the median. Whiskers above and below the box mark the 90th and 10th percentiles. Outliers (1.5 − 3 × interquartile range) are marked with circles; extreme values (>3 × interquartile range) are marked with asterisks. The inset shows an enlarged section of Figure 1 with a different S100B scale on the y-axis. The thin horizontal red line in the inset marks the upper normal range of S100B in healthy individuals.
Figure 2. Functional Outcome at 3 Months Depending on S100B Concentrations.
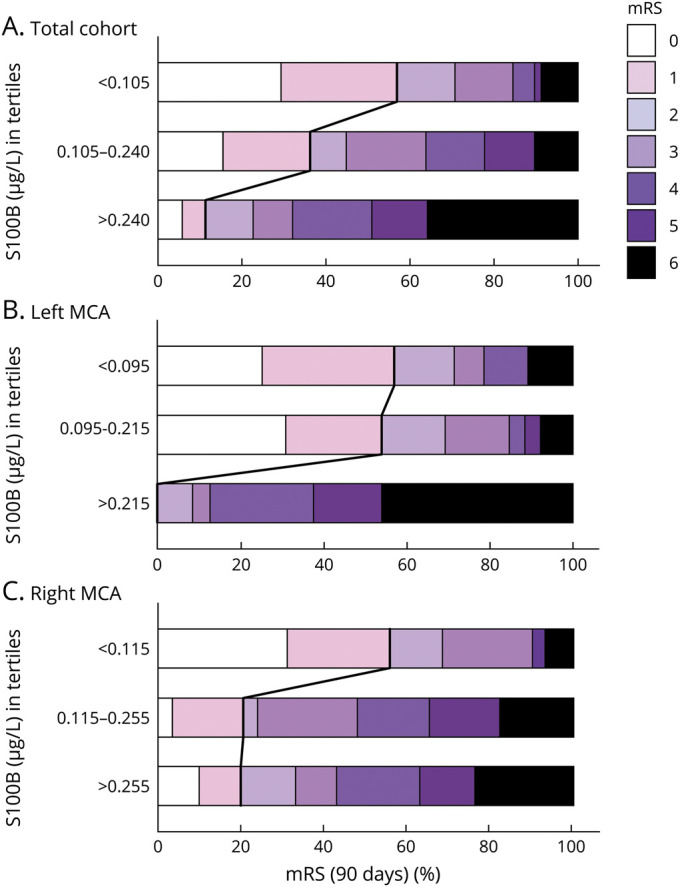
Horizontal bar graphs displaying modified Rankin Scale (mRS) grades at 3 months depending on S100B concentrations (in tertiles) for the whole cohort (A) and stratified for the left (B) and right hemisphere (C). The bold lines separate the favorable (mRS 0–1) from the unfavorable (mRS 2–6) outcome groups. An S100B value >0.240 μg/L predicted an unfavorable outcome with a positive predictive value of 0.89 (sensitivity 0.43, specificity 0.90, negative predictive value 0.47, overall accuracy 0.60). Respective values for left-sided infarctions (with S100B >0.215 μg/L) were 1.00, 0.50, 1.00, 0.44, and 0.69 and for right-sided infarctions (with S100B > 0.255 μg/L) 0.80, 0.39, 0.80, 0.39, and 0.53. MCA = middle cerebral artery.
Assuming that all patients had a comparable clinical condition at study inclusion (i.e., acute ischemic stroke with LVO), as shown in Figure 3, unsuccessful recanalization always resulted in substantially elevated S100B values (in parallel with the loss of astroglial tissue). In contrast, partial (TICI 2a-c) or complete recanalization (TICI 3) resulted in both low S100B values (indicating successful recanalization with little tissue damage) and higher S100B values (indicating tissue loss despite recanalization). Similarly, Figure 4 depicts the strong correlation between S100B values and infarct size. More than 90% of patients with low S100B values have infarction size <1/3 of the MCA territory, whereas almost 90% of patients with high S100B values have at least 1/3 of the MCA territory being affected. Patients with hemorrhagic transformation on follow-up imaging had higher S100B values compared to patients without hemorrhagic transformation (median 0.27 µg/L [IQR 0.11–0.66] vs 0.12 µg/L [0.08–0.24], p = 0.001).
Figure 3. S100B Concentrations Depending on mTICI Grades.
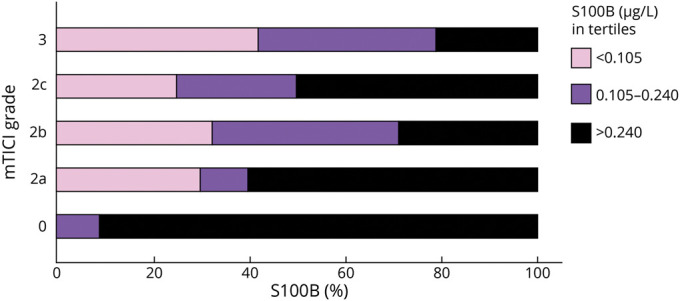
Horizontal bar graph displaying S100B concentrations (in tertiles) depending on modified Thrombolysis in Cerebral Infarction (mTICI) grades.
Figure 4. Infarct Size Depending on S100B Concentrations.
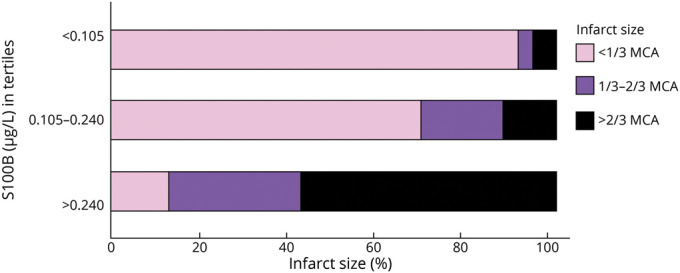
Horizontal bar graph displaying infarct size (<1/3 middle cerebral artery [MCA]; 1/3–2/3 MCA; >2/3 MCA and multiple territories) depending on S100B concentrations (in tertiles).
In a multivariate logistic regression analysis, younger age (odds ratio [OR] 1.120 [confidence interval (CI) 1.068–1.175]; p < 0.001), lower NIHSS 24 hours after symptom onset (OR 1.233 [CI 1.107–1.374]; p < 0.001), and lower S100B serum concentrations (OR 1.364 [CI 1.105–1.683]; p = 0.004) were independently associated with a favorable outcome after 3 months (mRS 0–1). In this model, sex, NIHSS at admission, pretreatment ASPECTS, and mTICI scores after intervention provided nonsignificant results (see supplemental files: eTable 1a–d, links.lww.com/WNL/B604). When adding infarct size to this model, S100B serum concentrations did not remain an independent predictor of functional outcome (OR 1.271 [CI 1.000–1.616]; p = 0.050).
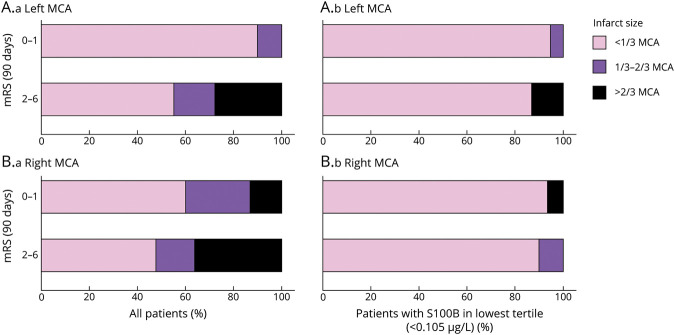
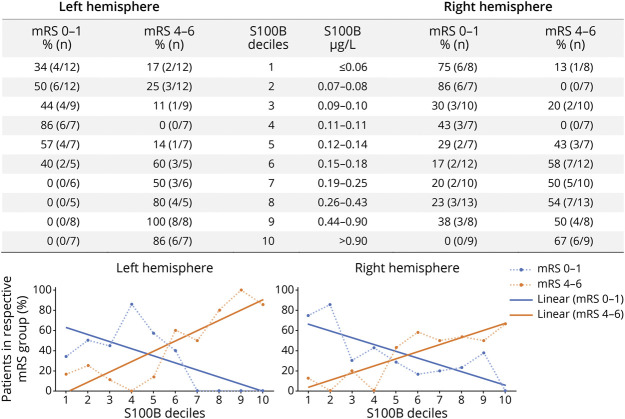
Figure 5 shows that patients with right-sided infarction have significant infarct sizes (in 40% of cases between 1/3 and 2/3 of the dependent vascular territory) despite favorable outcomes in terms of mRS. This was not observed in patients with left-sided infarctions. Here, mRS is biased due to its insensitivity for subtle right-hemispheric functional deficits and worse prognosis in patients with severe aphasia. In contrast, patients having both a favorable clinical outcome (in terms of mRS) and a favorable biomarker outcome do not reveal side-different infarct sizes. In this respect, based on the distribution of S100B values at day 2, we provide the PROMETHEUS deciles (Figure 6). In individual patients, the risk for having favorable or poor functional outcome at 90 days can easily be obtained for ischemic strokes in the left and the right hemisphere.
Figure 5. Infarct Size Depending on Dichotomized mRS at 3 Months.
Four horizontal bar graphs displaying infarct size (<1/3 middle cerebral artery [MCA]; 1/3–2/3 MCA; >2/3 MCA and multiple territories) depending on dichotomized modified Rankin Scale (mRS) at 3 months, stratified for the left (A) and the right (B) hemisphere, for all patients (A.a and B.a) and for the patients with S100B in the lowest tertile (<0.105 μg/L) (A.b and B.b).
Figure 6. BE PROMETHEUS Deciles for Tissue Outcome After Mechanical Recanalization.
The table provides the percentage and absolute number of patients reaching a favorable and a poor outcome at 90 days (modified Rankin Scale [mRS] 0–1; mRS 4–6) in the respective S100B decile group stratified for the left and the right hemisphere. These odds were then transferred into graphs for the left and the right hemisphere (dotted lines). Interpolation lines were then added for use in clinical practice. As an example, a patient with a left middle cerebral artery (MCA) infarction having an S100B value in the 9th decile at day 2 after thrombectomy has a risk of 80% for reaching a poor functional outcome at 90 days.
Ultimately, we performed internal validation of our dataset. The parallel increase of S100B levels with mRS values could be observed throughout each study year and each study center (supplemental files: eFigure 1, links.lww.com/WNL/B604).
Discussion
Our study characterized the astroglial protein S100B as a surrogate endpoint measure in patients with ischemic stroke who underwent MT. On day 2 after MT, serum concentrations of S100B provide a reliable assessment of ischemic tissue injury following LVO and subsequent therapeutic intervention. This measure is rapidly available and does not underlie biases resulting from functional hemispheric differences and other limitations that are typical for clinical outcome scales.5-9
For many years, the kinetics of S100B serum concentrations in ischemic stroke have been studied. A steady increase of S100B levels after vessel occlusion is observed, with maximum values reached 48–72 hours after symptom onset.14-17 These kinetics parallel the development of astroglial tissue damage on a cellular level (i.e., enlargement of the ischemic core).32 Associations of S100B serum elevation with malignant edema formation and blood–brain barrier damage have also been described.33 Conversely, transient ischemia (not leading to substantial tissue injury) does not increase astroglial protein levels in serum.18,19 Thus, S100B constitutes a surrogate of the total amount of astroglial tissue involved in the ischemic core. This qualifies S100B as an interesting biomarker candidate in the context of mechanical recanalization.
According to the pathophysiology of S100B release as outlined above, we found a correlation to infarct size as determined semiquantitatively using a 3-tiered scale. Moreover, when including both infarct size and S100B into the multivariate models, the predictive value of S100B was reduced towards nonsignificance (p = 0.05). This underlines the strong dependency of these 2 measures from each other. The correlation with vessel status after mechanical recanalization in terms of angiographic measures (mTICI grade) requires further reflection. On the one hand, futile recanalization always resulted in high S100B values (in parallel with the development of a significant infarct core). On the other hand, successful recanalization (mTICI 2 and below) resulted both in low S100B values (in those patients in whom the intervention prevented the development of a final infarct) and in high S100B values (in those patients who developed infarcts despite recanalization). In the latter cases, infarcts occurred due to low collateral flow or rapid growth of infarct core or significant infarct size already at the beginning of the intervention.34
Our data underline previous findings that infarct sizes are larger in mRS 0–1 if the stroke occurred on the right as compared to the left side.35 In the left (dominant) hemisphere, the development of infarcts frequently transfers into significant disability.36 Moreover, persisting aphasia is associated with a worse rehabilitation prognosis, limiting quality of life and reducing disability. In the right hemisphere, however, the correlation between infarct size and disability in terms of mRS is not as strong.36 We demonstrated that the application of a biomarker stratum (i.e., defining favorable outcome as mRS 0–1 and S100B in the lowest tertile) eliminates this bias, thus providing an unbiased surrogate outcome.
Serum concentrations of S100B can be determined on routine laboratory equipment. In fact, the S100B test used here is standardized and approved for malignant melanoma diagnostics in Europe and the United States.29 Thus, the success of the endovascular intervention in terms of tissue outcome can be determined easily and rapidly. Notably, routine brain imaging after MT must not be replaced by this measure, as hemorrhagic complications cannot be reliably uncovered. S100B allows outcome prediction in individual patients independent of the current clinical condition, which might be difficult to assess in early stages of disease due to ongoing functional recovery or intercurrent complications. For this reason, we provide the PROMETHEUS deciles, whose graphical presentation is designed for easy and quick application in clinical practice, to estimate the expected long-term outcome. Furthermore, S100B can be used as a surrogate endpoint measure in clinical trials. It is robust in terms of handling of blood samples, allows reliable quantification, and is much less resource-consuming in contrast to quantitative MRI analysis of infarct volumes. In addition, it allows outcome assessment independent of raters and functional scales. Nevertheless, a surrogate cannot replace patient-centered outcomes in clinical trials. Finally, in view of the internal validation of the data, it became obvious that S100B might be used as a quality assurance measure. The tissue outcome values obtained for individual patients over time can easily compared between years and between thrombectomy centers. It may help to identify factors (either prehospital or in-hospital) that potentially could be optimized for better patient outcome.
As a limitation, blood samples were not taken exactly 48 hours after MT, but on day 2 after thrombectomy, which has caused some degree of heterogeneity in the time window of blood withdrawal. However, blood collection in the morning on day 2 after intervention best matches routine clinical practice. Given that the predictability of S100B in earlier time windows is limited, its use within the first hours or the first day after EVT is likely not practicable.14-17 Here, the future combination with other brain damage markers (GFAP, neurofilament light) comes into play. At present, data quality is insufficient to draw a conclusion on any panel test. It has to be noted that only patients treated with MT were included in this study. Thus, the results are not applicable to patients with ischemic stroke in general. However, it is likely that S100B functions as an outcome indicator in a similar way. Here, future studies may evaluate broader S100B time windows, especially in patients who are not candidates for recanalizing therapies. Another limitation is the lack of an optimal gold standard of tissue damage. MRI volumetry at later time points may be one possibility, but subtle changes of brain tissue integrity after ischemic stroke (“tissue outcome”) may be overlooked. Moreover, quantitative stroke volumetry was not performed within this study. Rather, infarct size was categorized on an ordinal scale by experienced radiologists on short-term follow-up imaging. The strong correlation between infarct volume and S100B serum levels has been confirmed in several studies.14-17
S100B serum concentrations at day 2 after MT indicate the extent of ischemic tissue damage. It can be rapidly assessed independent of raters and outcome scales, thereby providing an objective surrogate outcome measure both in clinical routine and in interventional trials.
Glossary
- ASPECTS
Alberta Stroke Program Early CT Score
- CI
confidence interval
- CTA
CT angiography
- IQR
interquartile range
- LVO
large vessel occlusion
- MCA
middle cerebral artery
- MRA
magnetic resonance angiography
- mRS
modified Rankin Scale
- MT
mechanical thrombectomy
- mTICI
modified Thrombolysis in Cerebral Infarction
- NIHSS
National Institutes of Health Stroke Scale
- OR
odds ratio
Appendix. Authors
Footnotes
Class of Evidence: NPub.org/coe
Study Funding
The authors report no targeted funding.
Disclosure
S. Luger, K. Koerbel, A. Martinez Oeckel, H. Schneider, C.J. Maurer, G. Hintereder, M. Wagner, E. Hattingen, and C. Foerch report no disclosures relevant to the manuscript. Outside the submitted work, C. Foerch reports personal fees from Boehringer Ingelheim and Prediction Bioscience and has a patent “Use of GFAP for identification of intracerebral hemorrhage” US20150247867 licensed to Banyan Biomarkers. Outside the submitted work, S. Luger reports consultancy fees from Sonovum GmbH. Go to Neurology.org/N for full disclosures.
References
- 1.Goyal M, Menon BK, van Zwam WH, et al. Endovascular thrombectomy after large-vessel ischaemic stroke: a meta-analysis of individual patient data from five randomised trials. Lancet. 2016;387(10029):1723-1731. [DOI] [PubMed] [Google Scholar]
- 2.Schellinger PD, Demaerschalk BM. Endovascular stroke therapy in the late time window. Stroke. 2018;49(10):2559-2561. [DOI] [PubMed] [Google Scholar]
- 3.Duncan PW, Jorgensen HS, Wade DT. Outcome measures in acute stroke trials: a systematic review and some recommendations to improve practice. Stroke. 2000;31(6):1429-1438. [DOI] [PubMed] [Google Scholar]
- 4.Rankin J. Cerebral vascular accidents in patients over the age of 60: II: prognosis. Scott Med J. 1957;2(5):200-215. [DOI] [PubMed] [Google Scholar]
- 5.Quinn TJ, Dawson J, Walters MR, Lees KR. Exploring the reliability of the modified Rankin Scale. Stroke. 2009;40(3):762-766. [DOI] [PubMed] [Google Scholar]
- 6.Saver JL, Filip B, Hamilton S, et al. Improving the reliability of stroke disability grading in clinical trials and clinical practice: the Rankin Focused Assessment (RFA). Stroke. 2010;41(5):992-995. [DOI] [PMC free article] [PubMed] [Google Scholar]
- 7.Wilson JT, Hareendran A, Grant M, et al. Improving the assessment of outcomes in stroke: use of a structured interview to assign grades on the modified Rankin Scale. Stroke. 2002;33(9):2243-2246. [DOI] [PubMed] [Google Scholar]
- 8.Cheng B, Forkert ND, Zavaglia M, et al. Influence of stroke infarct location on functional outcome measured by the modified Rankin Scale. Stroke. 2014;45(6):1695-1702. [DOI] [PubMed] [Google Scholar]
- 9.Ernst M, Boers AMM, Forkert ND, et al. Impact of ischemic lesion location on the mRS score in patients with ischemic stroke: a voxel-based approach. AJNR Am J Neuroradiol. 2018;39(11):1989-1994. [DOI] [PMC free article] [PubMed] [Google Scholar]
- 10.Di Monaco M, Schintu S, Dotta M, Barba S, Tappero R, Gindri P. Severity of unilateral spatial neglect is an independent predictor of functional outcome after acute inpatient rehabilitation in individuals with right hemispheric stroke. Arch Phys Med Rehabil. 2011;92(8):1250-1256. [DOI] [PubMed] [Google Scholar]
- 11.Stein MS, Kilbride C, Reynolds FA. What are the functional outcomes of right hemisphere stroke patients with or without hemi-inattention complications? A critical narrative review and suggestions for further research. Disabil Rehabil. 2016;38(4):315-328. [DOI] [PMC free article] [PubMed] [Google Scholar]
- 12.Saver JL. Optimal end points for acute stroke therapy trials: best ways to measure treatment effects of drugs and devices. Stroke. 2011;42(8):2356-2362. [DOI] [PMC free article] [PubMed] [Google Scholar]
- 13.Puntonet J, Richard ME, Edjlali M, et al. Imaging findings after mechanical thrombectomy in acute ischemic stroke. Stroke. 2019;50(6):1618-1625. [DOI] [PubMed] [Google Scholar]
- 14.Buttner T, Weyers S, Postert T, Sprengelmeyer R, Kuhn W. S-100 protein: serum marker of focal brain damage after ischemic territorial MCA infarction. Stroke. 1997;28(10):1961-1965. [DOI] [PubMed] [Google Scholar]
- 15.Foerch C, Singer OC, Neumann-Haefelin T, du Mesnil de Rochemont R, Steinmetz H, Sitzer M. Evaluation of serum S100B as a surrogate marker for long-term outcome and infarct volume in acute middle cerebral artery infarction. Arch Neurol. 2005;62(7):1130-1134. [DOI] [PubMed] [Google Scholar]
- 16.Herrmann M, Vos P, Wunderlich MT, de Bruijn CH, Lamers KJ. Release of glial tissue-specific proteins after acute stroke: a comparative analysis of serum concentrations of protein S-100B and glial fibrillary acidic protein. Stroke. 2000;31(11):2670-2677. [DOI] [PubMed] [Google Scholar]
- 17.Missler U, Wiesmann M, Friedrich C, Kaps M. S-100 protein and neuron-specific enolase concentrations in blood as indicators of infarction volume and prognosis in acute ischemic stroke. Stroke. 1997;28(10):1956-1960. [DOI] [PubMed] [Google Scholar]
- 18.Foerch C, du Mesnil de Rochemont R, Singer O, et al. S100B as a surrogate marker for successful clot lysis in hyperacute middle cerebral artery occlusion. J Neurol Neurosurg Psychiatry. 2003;74(3):322-325. [DOI] [PMC free article] [PubMed] [Google Scholar]
- 19.Wunderlich MT, Wallesch CW, Goertler M. Release of glial fibrillary acidic protein is related to the neurovascular status in acute ischemic stroke. Eur J Neurol. 2006;13(10):1118-1123. [DOI] [PubMed] [Google Scholar]
- 20.Kowoll CM, Dohmen C, Kahmann J, et al. Standards of scoring, monitoring, and parameter targeting in German neurocritical care units: a national survey. Neurocrit Care. 2014;20(2):176-186. [DOI] [PubMed] [Google Scholar]
- 21.von Elm E, Altman DG, Egger M, et al. The Strengthening the Reporting of Observational Studies in Epidemiology (STROBE) statement: guidelines for reporting observational studies. PLoS Med. 2007;4(10):e296. [DOI] [PMC free article] [PubMed] [Google Scholar]
- 22.Powers WJ, Rabinstein AA, Ackerson T, et al. Guidelines for the early management of patients with acute ischemic stroke: 2019 update to the 2018 guidelines for the early management of acute ischemic stroke: a guideline for Healthcare Professionals from the American Heart Association/American Stroke Association. Stroke. 2019;50(12):e344–e418. [DOI] [PubMed] [Google Scholar]
- 23.Goyal A, Failla MD, Niyonkuru C, et al. S100b as a prognostic biomarker in outcome prediction for patients with severe traumatic brain injury. J Neurotrauma. 2013;30(11):946-957. [DOI] [PMC free article] [PubMed] [Google Scholar]
- 24.Harpio R, Einarsson R. S100 proteins as cancer biomarkers with focus on S100B in malignant melanoma. Clin Biochem. 2004;37(7):512-518. [DOI] [PubMed] [Google Scholar]
- 25.Zaidat OO, Yoo AJ, Khatri P, et al. Recommendations on angiographic revascularization grading standards for acute ischemic stroke: a consensus statement. Stroke. 2013;44(9):2650-2663. [DOI] [PMC free article] [PubMed] [Google Scholar]
- 26.Adams HP Jr, Bendixen BH, Kappelle LJ, et al. Classification of subtype of acute ischemic stroke: definitions for use in a multicenter clinical trial: TOAST: Trial of Org 10172 in Acute Stroke Treatment. Stroke. 1993;24(1):35-41. [DOI] [PubMed] [Google Scholar]
- 27.Janssen PM, Visser NA, Dorhout Mees SM, Klijn CJ, Algra A, Rinkel GJ. Comparison of telephone and face-to-face assessment of the modified Rankin Scale. Cerebrovasc Dis. 2010;29(2):137-139. [DOI] [PubMed] [Google Scholar]
- 28.Mussack T, Kirchhoff C, Buhmann S, et al. Significance of Elecsys S100 immunoassay for real-time assessment of traumatic brain damage in multiple trauma patients. Clin Chem Lab Med. 2006;44(9):1140-1145. [DOI] [PubMed] [Google Scholar]
- 29.Roche. diagnostics.roche.com.
- 30.Kalafut MA, Schriger DL, Saver JL, Starkman S. Detection of early CT signs of >1/3 middle cerebral artery infarctions: interrater reliability and sensitivity of CT interpretation by physicians involved in acute stroke care. Stroke. 2000;31(7):1667-1671. [DOI] [PubMed] [Google Scholar]
- 31.Yaghi S, Willey JZ, Cucchiara B, et al. Treatment and outcome of hemorrhagic transformation after intravenous alteplase in acute ischemic stroke: a scientific statement for Healthcare Professionals from the American Heart Association/American Stroke Association. Stroke. 2017;48(12):e343-e361. [DOI] [PubMed] [Google Scholar]
- 32.Brunkhorst R, Pfeilschifter W, Foerch C. Astroglial proteins as diagnostic markers of acute intracerebral hemorrhage-pathophysiological background and clinical findings. Transl Stroke Res. 2010;1(4):246-251. [DOI] [PubMed] [Google Scholar]
- 33.Foerch C, Otto B, Singer OC, et al. Serum S100B predicts a malignant course of infarction in patients with acute middle cerebral artery occlusion. Stroke. 2004;35(9):2160-2164. [DOI] [PubMed] [Google Scholar]
- 34.Liebeskind DS. Recanalization and reperfusion in acute ischemic stroke. F1000 Med Rep. 2010;2:71. [DOI] [PMC free article] [PubMed] [Google Scholar]
- 35.Foerch C, Misselwitz B, Sitzer M, et al. Difference in recognition of right and left hemispheric stroke. Lancet. 2005;366(9483):392-393. [DOI] [PubMed] [Google Scholar]
- 36.Etherton MR, Rost NS, Wu O. Infarct topography and functional outcomes. J Cereb Blood Flow Metab. 2018;38(9):1517-1532. [DOI] [PMC free article] [PubMed] [Google Scholar]
Associated Data
This section collects any data citations, data availability statements, or supplementary materials included in this article.
Data Availability Statement
Anonymized data used in this study are available on request from Dr. Luger.


