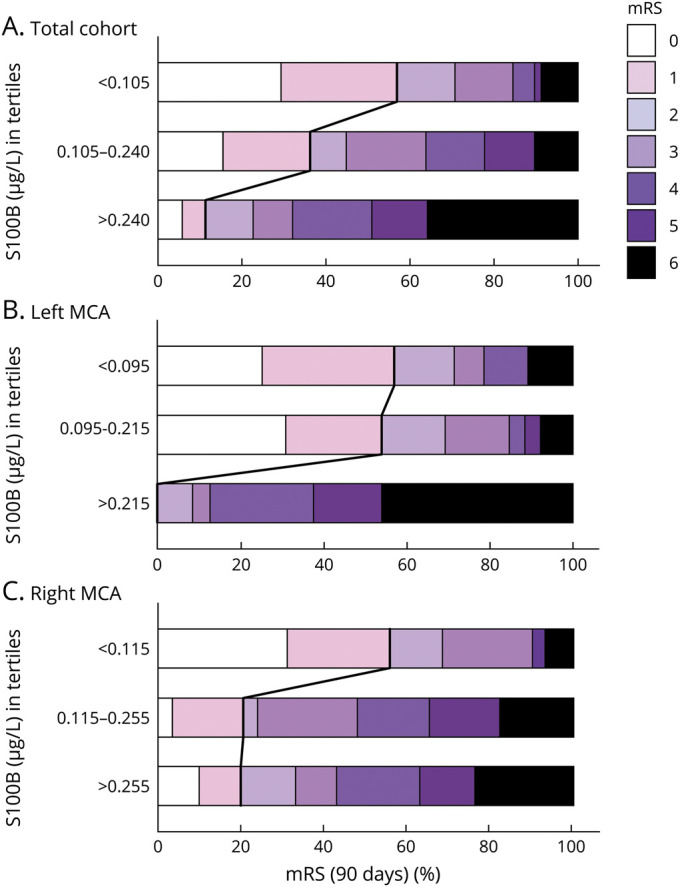
Figure 2. Functional Outcome at 3 Months Depending on S100B Concentrations.

Horizontal bar graphs displaying modified Rankin Scale (mRS) grades at 3 months depending on S100B concentrations (in tertiles) for the whole cohort (A) and stratified for the left (B) and right hemisphere (C). The bold lines separate the favorable (mRS 0–1) from the unfavorable (mRS 2–6) outcome groups. An S100B value >0.240 μg/L predicted an unfavorable outcome with a positive predictive value of 0.89 (sensitivity 0.43, specificity 0.90, negative predictive value 0.47, overall accuracy 0.60). Respective values for left-sided infarctions (with S100B >0.215 μg/L) were 1.00, 0.50, 1.00, 0.44, and 0.69 and for right-sided infarctions (with S100B > 0.255 μg/L) 0.80, 0.39, 0.80, 0.39, and 0.53. MCA = middle cerebral artery.
