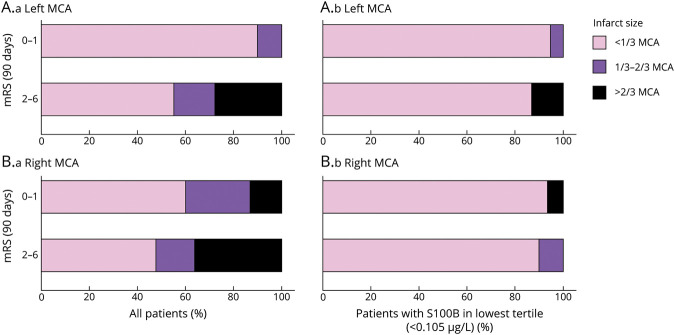
Figure 5. Infarct Size Depending on Dichotomized mRS at 3 Months.
Four horizontal bar graphs displaying infarct size (<1/3 middle cerebral artery [MCA]; 1/3–2/3 MCA; >2/3 MCA and multiple territories) depending on dichotomized modified Rankin Scale (mRS) at 3 months, stratified for the left (A) and the right (B) hemisphere, for all patients (A.a and B.a) and for the patients with S100B in the lowest tertile (<0.105 μg/L) (A.b and B.b).

