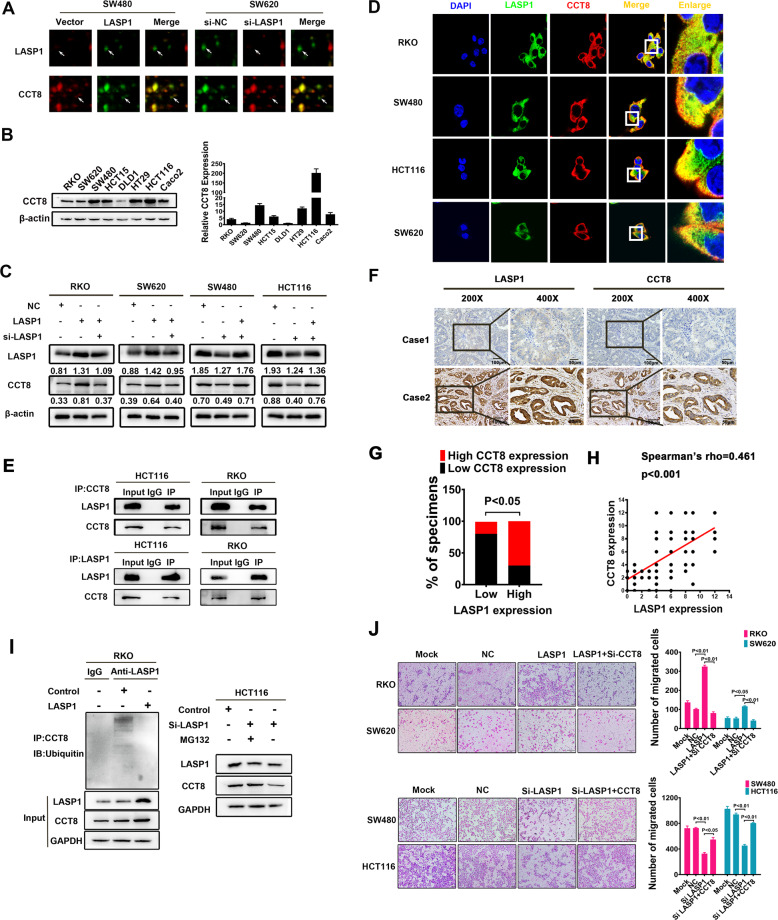
Fig. 1. LASP1 positively regulates CCT8 expression by protein interactions.
A The differentially expressed proteins in SW480/LASP1 cells or SW620/si-LASP1 and control cells were screened by 2-D DIGE. The enlarged images of two differentially expressed protein spots in DIGE analysis were shown. The protein spots were indicated by white arrows. B Western Blot analysis was performed to detect the expression of CCT8 in CRC cell lines(left). Real-time qPCR was used to detect the express of CCT8 in CRC cells at transcriptional level(right). C Western Blot was performed to detect the expression of CCT8 and LASP1 protein in indicated cells. D The immunofluorescence staining was performed to assess the subcellular localization of CCT8 and LASP1 in indicated cells (original magnification ×2400). The box areas highlighted the co-localization between CCT8 and LASP1. E The Co-IP was performed to analyze the endogenous interaction between CCT8 and LASP1 in CRC cells. Cells were lysed and purified by anti-CCT8 or anti-LASP1 affinity gel; protein pellets were analyzed by Western Blot with anti-LASP1 and anti-CCT8 antibodies. F Paraffin-embedded CRC sections were stained with anti-CCT8 or anti-LASP1 antibodies. Visualization of two representative cases was shown. G Graphical illustration of statistical LASP1 and CCT8 distribution in CRC tissues. The high expression of CCT8 is more frequently accompanied with high expression of LASP1 (p < 0.05). H Scatter plot display of the correlation between LASP1 and CCT8. I LASP1 suppressed the ubiquitination of CCT8 and the following degradation of CCT8. Left panel: Cells were lysed and purified by anti-CCT8 affinity gel and protein pellets were analyzed by Western Blot with anti-ubiquitin. Right panel: MG132 recovered the si-LASP1 increased degradation of CCT8. J Representative figures and data of Transwell assay in indicated cells. Bars of the right panel represented the number of invaded cells.

