

Summary
Severe acute respiratory syndrome coronavirus 2 (SARS-CoV-2) nucleocapsid (N) protein is essential for viral replication, making it a promising target for antiviral drug and vaccine development. SARS-CoV-2 infected patients exhibit an uncoordinated immune response; however, the underlying mechanistic details of this imbalance remain obscure. Here, starting from a functional proteomics workflow, we cataloged the protein–protein interactions of SARS-CoV-2 proteins, including an evolutionarily conserved specific interaction of N with the stress granule resident proteins G3BP1 and G3BP2. N localizes to stress granules and sequesters G3BPs away from their typical interaction partners, thus attenuating stress granule formation. We found that N binds directly to host mRNAs in cells, with a preference for 3′ UTRs, and modulates target mRNA stability. We show that the N protein rewires the G3BP1 mRNA-binding profile and suppresses the physiological stress response of host cells, which may explain the imbalanced immune response observed in SARS-CoV-2 infected patients.
Subject areas: Molecular biology, Virology, Cell biology, Proteomics
Graphical abstract
Highlights
-
•
AP-MS identifies 753 viral-host protein–protein interactions for 27 SARS-CoV-2 proteins
-
•
SARS-CoV-2 N protein sequesters G3BP1/2 and attenuates stress granule formation
-
•
N binds directly to mRNAs, rewires G3BP1 mRNA targets, and modulates mRNA stability
-
•
SARS-CoV-2 N dampens host stress response via altering posttranscriptional programs
Molecular biology; Virology; Cell biology; Proteomics;
Introduction
SARS-CoV-2, the causative agent of the ongoing global pandemic of coronavirus disease 2019 (COVID-19), is an enveloped, positive-strand, single-stranded RNA virus (Zhou et al., 2020). The SARS-CoV-2 virion includes ∼30 kb of genomic RNA (gRNA) and four structural proteins, the crown-like spike (S) glycoprotein that binds to the human ACE2 receptor (Wang et al., 2020b), the membrane (M) protein responsible for viral assembly in the ER, the ion channel envelope (E) protein, and the N protein that assembles with the viral RNA to form the nucleocapsid (Saikatendu et al., 2007; Zhou et al., 2020).
The N protein is a multifunctional RNA-binding protein that is involved in several aspects of the viral life cycle, including viral genomic RNA replication and virion assembly (Chang et al., 2014; Liu et al., 2020; McBride et al., 2014). Furthermore, the N protein is produced at high levels in infected cells (Liu et al., 2020), where it appears to enhance the efficiency of sub-genomic viral RNA transcription and modulate host cell metabolism (McBride et al., 2014). Recently, it was found that long-term N expression drives the differentiation of iPSCs to fibroblasts (Lin et al., 2020), highlighting one of many potential adverse impacts of SARS-CoV-2 infection. The SARS-CoV-2 N protein has two distinct RNA-binding domains, an N-terminal domain [NTD] and a C-terminal domain [CTD], connected by a linker region (LKR) containing a serine/arginine-rich (SR-rich) domain (SRD) (Kang et al., 2020; Ye et al., 2020; Zeng et al., 2020). Several critical residues of the N protein have been shown to bind viral genomic RNA and modulate infectivity (Zeng et al., 2020). Recent studies show that SARS-Cov-2 N protein can undergo RNA-induced liquid–liquid phase separation (LLPS) (Perdikari et al., 2020; Savastano et al., 2020). The LLPS of N promotes the cooperative association of the RNA-dependent RNA polymerase complex with viral RNA, thus maximizing viral replication (Savastano et al., 2020).
Recent proteomic studies have indicated that SARS-CoV-2 N associates with the host stress granule (SG)-nucleating proteins Ras-GTPase-activating protein SH3-domain-binding protein 1 and 2 (G3BP1 and G3BP2) (Gordon et al., 2020a; Li et al., 2020; Stukalov et al., 2021). SGs are membrane-less protein–mRNA aggregates that form in the cytoplasm in response to a variety of environmental stressors, such as oxidative stress, osmotic stress, UV irradiation, and viral infection (Alam and Kennedy, 2019; White and Lloyd, 2012). Assembly of SGs correlates with translation initiation arrest followed by polysome disassembly, resulting in an increase of uncoated mRNAs in the cytoplasm (Buchan and Parker, 2009). Therefore, SGs are thought to protect endogenous mRNA from stress-mediated degradation (Buchan and Parker, 2009). G3BP1 and G3BP2 are considered “essential” for SG formation (Kedersha et al., 2016; Panas et al., 2019), and overexpression of these proteins results in SG formation even in the absence of stress (Tourrière et al., 2003). Many RNA-binding proteins (RBPs), including G3BP1/2, TIA1, PRRC2C, and UBAP2L, have been identified to be important for SG formation via LLPS (Yang et al., 2020b). SGs are generally believed to have an antiviral role upon viral infection (White and Lloyd, 2012), and many viruses manipulate SGs to evade host responses (Kim et al., 2016). For example, it has been found that the Zika virus hijacks key SG proteins, including G3BP1 and CAPRIN-1, via an interaction with the capsid protein (Hou et al., 2017). This inhibits the formation of SGs and benefits viral replication (Hou et al., 2017). Currently, however, the functional significance of SARS-CoV-2 N protein’s interaction with G3BPs remains unknown (Cascarina and Ross, 2020).
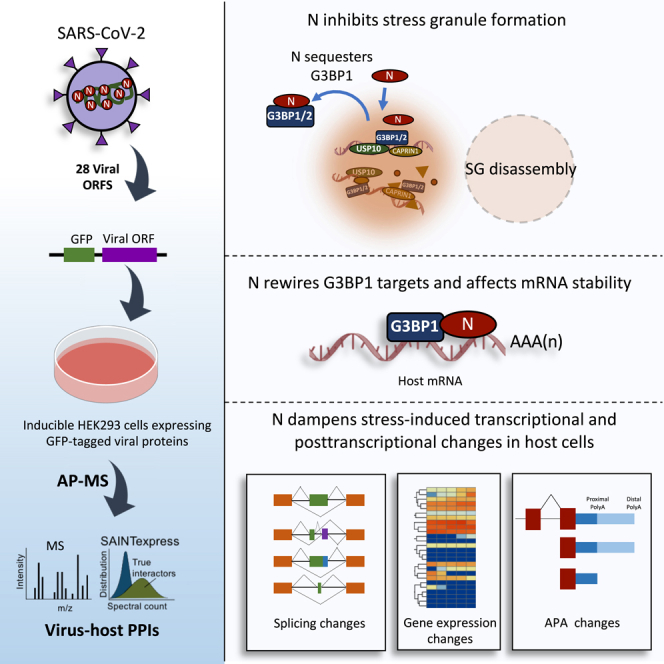
SARS-CoV-2 N protein has been described as a promising target for vaccine and antiviral drug development (Liu et al., 2006, 2020). Despite the urgent need to investigate molecular mechanisms through which N protein affects cellular pathways in infected cells, there has been a lack of information regarding its impact on the host metabolism and transcriptome. Here, we report that SARS-CoV-2 N attenuates host SGs by sequestering G3BP1 and G3BP2 through its interaction with these proteins. We demonstrate that N binds directly to host mRNAs, with a preference toward 3′UTRs, and alters the levels of G3BP1 mRNA targets. RNA-sequencing experiments revealed that N affects multiple posttranscriptional processes and blocks almost all such responses to cellular stress. We suggest that N protein dampens the host stress response through SG attenuation, altering G3BP1 RNA-binding, and direct interaction with mRNAs.
Results
Overview of the SARS-CoV-2 interactome
To examine the potential impact of SARS-CoV-2 proteins on host cell metabolism, we generated inducible HEK293 cell lines expressing EGFP-tagged variants of 28 full-length SARS-CoV-2 proteins (Figure 1A; Table S1). Each EGFP-tagged protein was subjected to affinity purification with anti-GFP antibodies followed by Orbitrap-based precision mass spectrometry analysis (AP-MS). To remove possible indirect associations mediated by DNA or RNA, cell extracts were treated with a promiscuous nuclease (Benzonase) prior to the affinity pull-downs. We scored specific protein interactions against GFP control purifications using “Significance Analysis of INTeractome” (SAINTexpress) analysis (Teo et al., 2014) with a statistical cut-off of ≤0.01 Bayesian false discovery rate (FDR). The number of significant interaction partners varied across the examined baits. For example, NSP10 did not yield any significant interaction partners, whereas Orf7b had 58 high-confidence prey proteins (FDR ≤ 0.01; Table S2). In total, we identified 753 protein–protein interactions (PPIs) involving 267 unique cellular proteins for 27 SARS-CoV-2 baits (Figure 1B; Table S2). Gene Ontology (GO) and KEGG (Kyoto Encyclopedia of Genes and Genomes) pathway enrichment analysis identified major biological processes to be significantly enriched among the prey proteins, including neutrophil activation involved in immune responses, metabolic pathways, RNA transport, regulation of mRNA stability, protein processing in the ER and ribosomes (FDR < 0.05; Figures S1A and S1B).
Figure 1.

Overview of SARS-CoV-2 interactome in HEK293 cells
(A) Schematic representation of SARS-CoV-2 open reading frames (ORFs).
(B) Network representation of protein-protein interactions of 27 SARS-CoV-2 bait proteins. Baits (highlighted in red) were expressed in HEK293 cells and subjected to AP-MS analysis (see Table S2 for details). Network legend is provided.
(C) Venn diagram showing the overlap among three different AP-MS studies. Processed AP-MS data from Li et al. (2020) and Gordon et al. (2020a, 2020b) were downloaded from the supplemental files as published with each study. Overlapping proteins across all three datasets are listed in the box.
(D) Heatmap illustration of SARS-CoV-2 proteins’ interaction with G3BP1 and G3BP2 across three different studies.
(E) Left, Heatmap depiction of SARS-CoV-2 N protein–protein interactions as detected in this study (FDR ≤ 0.01). Right, Interaction of SARS-CoV-2 N protein with G3BP1 detected by reciprocal co-immunoprecipitation experiments. Top, IPs were performed with GFP antibodies using whole-cell lysates prepared from HEK293 cells expressing GFP or GFP-N (EGFP: 30kDa + N:45kDa). Bottom, IPs were performed with G3BP1 antibody using whole-cell lysates prepared from HEK293 cells expressing GFP or GFP-N. Cell lysates were treated with nuclease prior to IPs. Blots were probed with the indicated antibodies.
(F) Top, Domain organization of full-length N and truncation mutants that were generated. Bottom, Interaction of N protein truncation mutants with G3BP1 detected by AP-MS (left) and co-immunoprecipitation experiments (right). AP-MS data are represented as a dot plot where the inner circle color represents the average spectral count, the circle size maps to the relative prey abundance across samples shown, and the circle outer edge represents the SAINT FDR. Legend is provided below the plot. IPs were performed with anti-GFP and blots were probed with the indicated antibodies. See also Figures S1 and S2A–S2D and Tables S2 and S5.
Our AP-MS analysis revealed that many SARS-CoV-2 proteins interact with specific host proteins and/or protein complexes (Table S3). For example, the endosomal trafficking-associated CCC–Wash complex (Bartuzi et al., 2016) copurified with NSP16 (Figure S1C, top). CLCC1 (Chloride Channel CLIC Like 1) protein, which has a role in ER stress and protein folding (Jia et al., 2015), specifically co-purified with Orf3a (Table S3). Similarly, subunits of respiratory chain complex 1 co-purified with NSP5 (FDR ≤ 0.01) (Figure S1C, bottom). These observations suggest that, in infected cells, SARS-CoV-2 might manipulate host cell metabolic pathways to its own advantage.
Stress granule proteins G3BP1 and G3BP2 specifically co-purify with nucleocapsid
We next compared our protein interaction data with two previously published AP-MS studies that were also performed in HEK293 cells (Gordon et al., 2020b; Li et al., 2020). We observed that there is little interaction partner overlap among the different reports, highlighting the variability of the experimental set-ups and/or statistical analyses employed in the various studies to catalog the virus–host PPIs (Figure 1C). The only shared interaction partners among all 3 studies were ERC1, VPS39, CLCC1, STOML2, and stress granule (SG) nucleating proteins G3BP1 and G3BP2 (Figure 1C). Considering that SGs are thought to be involved in host antiviral responses (Wang et al., 2020a), and G3BP1 and G3BP2 are essential for SG formation (Kedersha et al., 2016; Panas et al., 2019), we focused our attention on further characterizing their interactions with the viral proteins. Comparative proteomics analysis using all examined viral bait proteins indicated that G3BP1 and G3BP2 co-purified exclusively with SARS-CoV-2 N (Figure 1D). By taking advantage of recently published AP-MS datasets (Gao et al., 2019; Gordon et al., 2020a, 2020b; Li et al., 2020; Stukalov et al., 2021), we also found that the N-G3BP1/2 interaction is evolutionarily conserved across related coronaviruses, including SARS-CoV-1 and middle east respiratory syndrome (MERS)-CoV (Figure S2A). These observations suggest that the N-G3BP1/2 interaction is highly specific and potentially important for coronaviral processes in infected cells.
To further validate this interaction, whole-cell extracts (WCEs) from either control GFP- or GFP-N-expressing cells were treated with nuclease, and reciprocal co-immunoprecipitation (co-IP) experiments were performed. Consistent with our AP-MS analysis, these experiments showed that SARS-CoV-2 N co-immunoprecipitated with endogenous G3BP1, and vice versa (Figure 1E, right). Furthermore, N also successfully pulled down G3BP2 (Figure S2B), demonstrating that N interacts with both G3BPs. Since the structures for both SARS-CoV-2 N and G3BP1 are available (Kang et al., 2020; Vognsen et al., 2013), we performed protein docking studies to predict their interaction surface. We observed that the N-terminal domain (NTD) of N and the nuclear transport factor 2-like (NTF2-like) domain of G3BP1 had 23 residues predicted to be ≤ 6Å distance from each other (see STAR Methods; Figure S2C; Table S4). These observations suggested that the NTD might be responsible for N’s interaction with G3BP1. We thus generated inducible HEK293 cell lines expressing N protein truncation mutants (Figure 1F, top) and performed AP-MS as well as co-IP experiments. While we cannot rule out a possible role of the N-terminal intrinsically disordered region 1 (IDR1) of N, the NTD fragment successfully pulled down G3BP1, whereas the CTD did not (Figure 1F; Table S5). We conclude that N interacts with G3BPs through its NTD and that this interaction is highly specific, as no other SARS-CoV-2 protein was observed to pull-down G3BP1 or G3BP2.
Expression of nucleocapsid reduces stress granule formation
Several viruses, including MERS-CoV, have been shown to manipulate host stress granules (Nakagawa et al., 2018; White and Lloyd, 2012). Since SARS-CoV-2 N interacted with the stress granule resident proteins, G3BP1 and G3BP2, we examined its possible role in SG formation. Our AP-MS analysis using G3BP1 and G3BP2 as baits identified at least 45 overlapping proteins as high-confidence interaction partners (FDR ≤ 0.01; Figure 2A, left). Among these interaction partners were multiple SG-nucleating proteins, including CAPRIN1 and USP10 (FDR ≤ 0.01; Figure 2A, right; Table S5), which have been previously shown to be important for SG formation (Kaehler et al., 2012; Kedersha et al., 2016; Yang et al., 2020b). Notably, these SG resident proteins were depleted from the SARS-CoV-2 N interactome (FDR ≤ 0.01; Figure 2A), suggesting that N might affect SG formation by sequestering G3BP1 and G3BP2 away from their interaction partners. G3BP1 and G3BP2 are highly homologous to each other (Figure S2D) and, given their functional redundancy in SG nucleation (Aulas et al., 2015; Matsuki et al., 2013), we only focused on G3BP1 for further analyses.
Figure 2.

SARS-CoV-2 N protein attenuates stress granule formation
(A) Left, Venn diagram showing the overlap of significant interaction partners of G3BP1 and G3BP2 (FDR ≤ 0.01). Right, Heatmap representation of high confidence (FDR ≤ 0.01) protein-protein interactions of N, N in NaAsO2-treated cells, and overlapping G3BP1 and G3BP2 interaction partners. Additionally, G3BP1 co-purifying SG-related protein DDX3X, NUFIP2, and EIF2AK2 are also shown. Box 1 and box 2 provide an enlarged view of certain interacting proteins. SG-nucleating proteins are indicated by blue squares. A figure legend is provided.
(B) Top panels- Immunofluorescence (IF) analysis to examine the localization of N and G3BP1 in HEK293 cells without NaAsO2 treatment. Bottom panels: IF was performed in HEK293 cells treated with NaAsO2 to quantify stress granule formation in GFP- and GFP-N-expressing cells. Stress granules were identified by staining with anti-G3BP1 antibody. The box plot shows the average number of stress granules per cell. Experiment was performed in biological replicates (n = 2, total cells 50) and a student’s t test was used to examine the statistical significance (∗∗∗p ≤ 0.001; n.s.: non-significant). For nuclear counterstaining, DAPI was used. Scale bar indicates 10 μm.
(C) Co-immunoprecipitation analysis using G3BP1 as the bait in NaAsO2-treated cells. G3BP1 was immunoprecipitated with anti-G3BP1 antibody using cell extracts prepared either from N-expressing or wild-type cells. Cell lysates were treated with nuclease prior to IPs. Blots were probed with the indicated antibodies. See also Figures S2E and S2F and Table S5.
To test the hypothesis that N attenuates SG formation, we performed immunofluorescence studies in cells expressing either GFP-N or GFP alone. To model the stressed state of SARS-CoV-2 infected cells, we subjected the cells to oxidative stress using sodium arsenite (NaAsO2) for one hour. As identified by G3BP1 staining, SG punctae were readily observable in both GFP- and GFP-N-expressing cells (Figure 2B). Remarkably, we found that, in comparison with GFP-expressing cells, the number of detectable SGs was significantly reduced in GFP-N-expressing cells (Figure 2B), indicating that N inhibits SG formation. Both G3BP1 and N co-localized to the remaining SGs in NaAsO2 treated cells (Figure 2B). Importantly, the protein levels of G3BP1 remained unaltered in N-expressing cells (Figure S2E), confirming that SG attenuation is not due to the degradation of G3BP1. Next, we examined whether this phenotype could be rescued through the over-expression of G3BP1 in N-expressing cells. G3BP1 was transiently overexpressed in N-expressing cells followed by the induction of oxidative stress using NaAsO2 (Figure S2F). Consistent with the idea that N attenuates SG formation by sequestering G3BP1 (and G3BP2), we observed that the overexpression of G3BP1 rescued the SG attenuation phenotype (Figure 2B). As expected, N localized to the SGs in G3BP1 over-expressing cells (Figure 2B, bottom left) (see discussion).
Since N localized to SGs, we also performed AP-MS analysis of N in NaAsO2-treated cells (Table S5). Both G3BP1 and G3BP2 were identified as high-confidence interaction partners, whereas other SG proteins were depleted from the N interactome in oxidatively stressed cells (FDR≤0.01; Figure 2A; Table S5). To further test the hypothesis that N sequesters G3BPs away from their cellular interaction partners, we performed co-IP experiments using G3BP1 as the bait in either wild-type or N-expressing HEK293 cells treated with NaAsO2. Our results indicated that N expression abrogates G3BP1 interaction with the SG proteins CAPRIN1 and USP10 (Figure 2C), reinforcing the idea that N inhibits the formation of SGs in host cells by sequestering G3BPs away from their interacting SG-nucleating proteins.
SARS-CoV-2 N protein directly binds cellular mRNAs with a preference for 3′UTRs
Since N protein contains RNA-binding domains (Kang et al., 2020), we examined whether N interacts directly with host mRNAs. We initially performed cross-linking and immunoprecipitation (CLIP) followed by gel electrophoresis and autoradiography to detect cross-linked RNA and observed that GFP-N cross-links robustly to RNA in UV-irradiated cells (Figure 3A). In contrast, GFP alone did not yield any observable radioactive signal, and the N-dependent radioactive smear disappeared upon over-digestion with RNase I (Figures 3A and S3A), indicating that N directly binds to RNA. Next, to identify mRNAs bound directly by N, we carried out individual-nucleotide resolution UV cross-linking and immunoprecipitation followed by high throughput sequencing (iCLIP-seq) experiments in biological replicates along with size-matched inputs (SMI) as controls. Considering the role of N in SG attenuation, we also included NaAsO2-treated cells in our iCLIP-seq analysis (Figure S3A).
Figure 3.

SARS-CoV-2 N directly binds to host mRNAs
(A) Autoradiographs of immunopurified 32P-labeled N-RNA complexes after partial RNase I digestion. HEK293 cells were UV-crosslinked and GFP-N was immunoprecipitated using anti-GFP antibody. Purified RNA-protein complexes were resolved on 4–12% Bis-Tris gels after radiolabeling the RNA and transferred to nitrocellulose membranes. Cells expressing only GFP were used as a negative control.
(B) Venn diagram indicating the overlap of N bound transcripts in non-NaAsO2- and NaAsO2-treated cells. p value was calculated using the hypergeometric test.
(C) Pie charts representing the distribution of N iCLIP peaks across mRNA features in non-NaAsO2- and NaAsO2-treated cells. Note, the biological replicates highly correlated with each other (not shown) and reproducible iCLIP peaks were considered for further analyses.
(D) Standardized metaplot profiles showing the normalized peak density of N iCLIP in non-NaAsO2- and NaAsO2-treated cells. CDS represents the coding sequence.
(E) Enriched sequence motifs found in N iCLIP-seq peaks. E-value represents the significance of the motif against randomly assorted control sequences. Centrino output plot shown below the motifs indicates the distribution of the top two motifs around N’s cross-linking sites. Motifs were found to be centrally enriched.
(F) GO enrichment analysis related to biological processes using identified N target genes. Plot legend indicating the p values and gene count for each GO term is provided.
(G) KEGG pathway enrichment analysis using N target genes (Q ≤ 0.05). Darker nodes are more significantly enriched gene sets. Bigger nodes represent larger gene sets. Edge thickness represents the overlap of genes. See also Figure S3 and Tables S6 and S7.
Through peak calling in comparison with the SMI controls, we identified ∼22,000 reproducible peaks in non-NaAsO2 samples, encompassing ∼3500 unique mRNAs from human protein-coding genes (Figure S3B, left; Table S6). For NaAsO2-treated samples, 5387 reproducible peaks covering ∼1600 protein-coding genes were identified (Figure S3B, right; Table S7). Approximately 88% of the N-bound mRNAs in the NaAsO2-treated samples were also present in the non-NaAsO2-treated cells (Figure 3B). Peak distribution analysis indicated that the majority of the N iCLIP peaks (>70% of the total peaks in both NaAsO2-treated and non-NaAsO2-treated cells) are found within the annotated 3′UTRs of the target transcripts (Figures 3C and 3D). Motif analysis identified A/U-rich sequences as the most significantly enriched motifs in N-binding sites (Figure 3E). This is consistent with a recent study that showed that N condenses with the SARS-CoV-2 RNA genome through binding A/U-rich unstructured regions flanked by strong stem-loop structures (Iserman et al., 2020).
Since these N motifs shared similarity with AU-rich destabilizing elements (ARE) found in the 3′ UTRs of mRNAs that code for many proto-oncogenes and cytokines (Chen and Shyu, 1995), we examined whether the N-bound genes were enriched for any specific biological processes. Processes related to mRNA processing, RNA catabolic processes, posttranscriptional regulation of gene expression, and protein localization to ER were significantly enriched (Figure 3F). KEGG analysis indicated that N-bound genes were significantly enriched for several cancer-related pathways, including viral carcinogenesis, colorectal cancer, renal cell carcinoma, chronic myeloid leukemia, and pancreatic cancer (FDR < 0.05; Figure 3G). These observations suggested that N might target growth-related genes in infected cells.
SARS-CoV-2 N protein alters the G3BP1 RNA-binding profile
Since N interacted with G3BP1, we asked how N might impact G3BP1's RNA-binding capacity. We performed G3BP1 iCLIP-seq experiments in biological replicates, along with control SMIs, in wild-type GFP-expressing and N-expressing HEK293 cells with or without NaAsO2 treatment (Figure S3C; Tables S8, S9, S10, and S11). In wild-type cells, G3BP1 localized to both coding regions and 3′UTRs, with slightly more enrichment toward the 3′UTRs in NaAsO2-treated cells (Figure S3D). Consistent with previous studies (Edupuganti et al., 2017; Martin et al., 2016; Tourrière et al., 2001), the most predominant G3BP1 RNA-binding motifs consisted of C/U-rich sequences (Figure S3E). Furthermore, the central part of the known methyl-6-adenosine (m6A) consensus sequence (ACU) was also present in an identified G3BP1 RNA-binding motif (Figure S3E), as reported previously (Edupuganti et al., 2017).
To assess the effect of N on the G3BP1 RNA-binding profile, we examined its average RNA-binding density along target transcripts in N-expressing cells. In comparison with the wild-type cells, we observed a shift in G3BP1 RNA-binding density toward the 5′ and 3′ UTRs in N-expressing cells (Figure 4A). This trend was particularly evident under oxidatively stressed conditions (Figure S3F). By overlapping the bound transcripts (i.e., transcripts with reproducible significant peaks, FDR ≤ 0.05), we observed that ∼67% of G3BP1 targets identified in wild-type cells were also bound in N-expressing cells (Figure 4B). In contrast, there were many additional G3BP1 targets in N-expressing cells, suggesting that N indeed rewired G3BP1 target preferences. Of the 637 mRNAs uniquely bound by G3BP1 in N-expressing cells (Figure 4B), ∼57% (referred to as N-specific G3BP1 targets hereafter) were also recognized as N targets (p value < 1.724 × 10−41, hypergeometric test; Table S6). Consistently, in oxidatively stressed conditions, ∼56.7% of the G3BP1 bound transcripts in N-expressing cells overlapped with those identified as N targets (Table S11; p value < 1.933 × 10−49, hypergeometric test). These G3BP1 peaks in N-expressing cells were concentrated around the N-binding sites (Figures 4C and S3G), indicating that N might recruit G3BP1 to a subset of host mRNAs that are typically not targeted by G3BP1 in wild-type cells. To assess the biological impact of reshaping G3BP1 RNA-binding, GO analysis was performed using N-specific G3BP1 targets. These genes were found to be enriched for many major biological processes, including posttranscriptional regulation of gene expression, viral processes, chromosome organization, organelle organization, and cellular protein localization (Figure S3H).
Figure 4.

N affects G3BP1 RNA-binding targets
(A) Standardized metaplots showing the G3BP1 RNA-binding profiles. Different conditions used to perform G3BP1 iCLIP-seq are color coded. Color legend is provided in top-right corner of the plot. CDS represents the coding sequence.
(B) Venn diagram representing the overlap of G3BP1 targets in wild-type and N-expressing cells. p value was calculated using the hypergeometric test.
(C) Left, Average iCLIP peak density of G3BP1 around N-binding sites. iCLIP-seq samples across different conditions are color coded, and a legend is provided. Right, genome browser shots of HDGF and RPS16 gene tracks show the location of significant iCLIP peaks for the indicated samples. Significant N peaks (FDR ≤ 0.05) are shown as blue lines.
(D) Left, Bar graph representation of G3BP1 mRNA targets in different conditions. Right, Venn diagram showing the overlap of G3BP1 mRNA targets under different conditions.
(E) Bar graph representation of G3BP1 RIP-qPCR experiments in NaAsO2-treated cells expressing either GFP-N or GFP showing the G3BP1 RNA-binding to MATR3 transcript. The experiments were performed in biological triplicates, and p values were calculated using the student’s t test (∗∗∗p ≤ 0.001, ∗∗p ≤ 0.01). Error bars represent a standard error of mean (SEM). See also Figure S3 and Tables S8, S9, S10, and S11.
Since RNA-dependent LLPS is thought to be critical for G3BP1-mediated SG assembly (Sanders et al., 2020; Yang et al., 2020b), we examined the G3BP1 mRNA binding propensity in the presence and absence of oxidative stress. We observed that, in comparison with the non-stressed cells, the number of G3BP1 bound mRNAs nearly doubled in stressed cells (Figure 4D, left). This finding is consistent with the role of mRNA in enhancing LLPS of G3BP1 (Yang et al., 2020b). Remarkably, when N is expressed, the number of G3BP1 iCLIP peaks (and associated mRNAs) was drastically reduced in stressed conditions in comparison to non-stressed conditions (Figure 4D, left; Tables S10 and S11; ∼3.9 and ∼3.6 million uniquely mapped reads (replicates combined) for untreated and NaAsO2-treated samples, respectively). These results indicate that N reduces G3BP1 access to host mRNAs under stressed conditions and suggest a negative impact of N on the LLPS of G3BP1 in the context of SG formation (see discussion). Although 161 mRNAs remained associated with G3BP1 in N expressing cells under both stressed and non-stressed conditions (Figure 4D, right), 58% of these mRNAs were also directly bound by N in stressed cells (p < 2.179 × 10−36, hypergeometric test). This observation is consistent with the notion that N modulates G3BP1 mRNA target preferences. Moreover, whereas stress caused G3BP1 to associate with 542 new mRNAs in the absence of N, it caused G3BP1 to associate with only 63 new mRNAs in the presence of N (Figure 4D, right). We then performed G3BP1 RNA-immunoprecipitation (RIP) followed by RT-qPCR experiments to validate the observed reduced RNA-binding of G3BP1 in N-expressing stressed cells. Consistently, G3BP1 exhibited substantially reduced RNA-binding for the two target transcripts we examined, MATR3 and CPSF6 (Figures 4E and S3I). We conclude that N rewires the G3BP1 RNA-binding preferences, sequesters it away from many of its wild-type targets, and likely negatively impacts RNA-mediated LLPS of G3BP1 in the context of SG formation by reducing its access to mRNAs in stressed cells.
SARS-CoV-2 N alters host gene expression and suppresses host response to stress
To examine the effect of SARS-CoV-2 N on host gene expression, we performed RNA-seq analysis in HEK293 cells expressing either GFP-N or GFP alone, in the presence or absence of oxidative stress. The RNA-seq replicates highly correlated with each other, indicating the reproducibility of our data (Figure S4A). Differential expression analysis indicated that, in comparison with the control cells, 2495 genes were significantly differentially expressed in N-expressing cells (Q < 0.05; Figure 5A, left). Of these, 1303 were upregulated, whereas 1192 were downregulated (Table S12). By comparing with oxidatively stressed GFP cells, we identified 1028 and 882 genes that were significantly up and downregulated, respectively, in NaAsO2-treated, N-expressing samples (Q < 0.05; Figure 5A, right; Table S13). Notably, ∼87% of the differential genes in the NaAsO2-treated N samples (1667/1910 genes) were the same as those that were also significantly differentially expressed in the untreated N-expressing cells (Figure 5B). These results indicated that N affected a large core set of genes under both conditions. We validated the differential expression of 3 up and 3 downregulated genes by RT-qPCR experiments (Figure 5C). GO analysis indicated that the significantly upregulated genes were enriched in terms related to viral transcription, protein targeting to ER, mRNA surveillance, and nonsense-mediated decay (Figure 5D). The downregulated genes, on the other hand, were enriched in chromatin modification and cell cycle regulation-related pathways (Figures S4B and S4C). Furthermore, disease enrichment analysis indicated that differentially expressed genes were enriched for various cancer types (Figure 5E). These data suggest that the expression of N results in the deregulation of many functionally important host genes.
Figure 5.

Expression of N alters host gene expression
(A) Volcano plot representation of genes differentially expressed in the presence of N in untreated (left) and NaAsO2 treated cells (right). Differential gene expression in N-expressing untreated (left) and NaAsO2 treated cells (right) was calculated against GFP-expressing untreated and NaAsO2 treated cells, respectively. Each dot represents a single gene. Genes with FDR ≤ 0.05 were considered significant. Vertical dotted lines represent log2fold change of 2, and highly significant genes are shown as red dots with labels indicating the gene name. Gray dots represent genes that are considered insignificant in this representation. Legend is provided.
(B) Venn diagrams showing the overlap of significantly differentially expressed genes in N-expressing untreated and NaAsO2-treated cells. p values were calculated using the hypergeometric test.
(C) Bar graphs representing RT-qPCR results to examine the differential expression of selected targets in N-expressing cells. The experiments were performed in biological triplicates, and p values were calculated using the student’s t-test (∗∗∗p ≤ 0.001, ∗∗p ≤ 0.01, ∗p ≤ 0.05, n.s.: non-significant). Error bars represent standard error of mean (SEM).
(D) GO enrichment analysis using genes that were significantly upregulated in N cells in comparison to the GFP cells. Plot legend indicating the p values and gene counts for each GO term is provided.
(E) Disease enrichment analysis using differentially expressed genes across indicated comparisons. p values and gene counts for each GO term are provided. See also Figure S4 and Tables S12, S13, S14, and S15.
Since viral infection induces a stress response in host cells (Jindal and Malkovsky, 1994), we also examined the impact of N on gene expression changes that occur due to cellular stress. We utilized our RNA-seq datasets from samples treated with or without NaAsO2 and identified 1073 genes that were differentially expressed in GFP-expressing stressed cells in comparison with the non-stressed samples (Table S14). Of these, 368 were upregulated, whereas 705 genes were downregulated in stressed cells (Q < 0.05; Figure 6A). Remarkably, the number of stress-induced differential genes was drastically reduced in N-expressing cells with only 124 and 132 genes being up and downregulated, respectively (Figure 6A; Table S15). The majority of these differential genes in stressed N cells overlapped with those identified in GFP stressed cells (Figure 6A). These results imply an inhibitory role of N in cellular response to stress. To understand the underlying mechanism, we utilized our iCLIP-seq data and overlapped N targets with those genes that were differentially expressed in stressed GFP cells. We found that 53% of these stress-related differentially expressed genes in GFP cells were indeed directly bound by N (p value < 6.362 × 10−53, hypergeometric test). In particular, 64% of the downregulated genes in stressed GFP cells were targeted by N (p value < 1.10 × 10−53; Figure S5A). We validated the expression changes for two target genes, ZNF121 and DDX3X, using RT-qPCR experiments, and consistently found that N affected their expression levels in stressed cells (Figures 6B and S5B). We conclude that N reverses the effects of stress on gene expression by directly binding host mRNAs (see discussion).
Figure 6.

Expression of N affects multiple posttranscriptional processes
(A) Left, Bar graph depiction of stress-induced differentially expressed genes in GFP- and N-expressing cells. Differentially expressed genes in stressed cells with Q < 0.05 were considered significant. Note: Depicted % of significantly differential genes is relative to the total genes with coverage sufficient for calculating the differential expression. Right, Venn diagrams show the overlap of differentially expressed genes in NaAsO2-treated N-expressing and GFP-expressing cells (in comparison with non-stressed cells). p values were calculated using the hypergeometric test. Note: ‘Ar’ stands for arsenite (NaAsO2) treatment.
(B) Top, Bar graphs representing RT-qPCR results to examine the differential expression of ZnF121 in NaAsO2-treated N-expressing and wild-type GFP cells. The experiments were performed in biological triplicates, and p value were calculated using the student’s t-test (∗p ≤ 0.05). Error bars represent SEM. Bottom, close-up view of ZNF121 gene track showing the location of significant iCLIP peaks for N in non-NaAsO2- and NaAsO2-treated cells. Significant N peaks (FDR ≤ 0.05) are shown as blue lines.
(C) Schematic representation of various alternative splicing events that were analyzed using RNA-seq data. Bar graphs show the increased or decreased inclusion levels for various splicing categories. Events with ΔPSI > 10 are shown.
(D) Cumulative plots show the APA distribution of the transcripts identified in RNA-seq data by QAPA. The x axis represents the value of proximal PAU (%), whereas the y axis indicates the percentage of the transcripts. p values are indicated.
(E) Left, cumulative distribution analysis in the abundance of N and G3BP1 target mRNAs after expression of N in HEK293 cells. Right, cumulative distribution analysis of N targeted mRNA’s abundance in iAT2 cells infected with SARS-CoV-2 (24 hpi). p values are indicated (Kruskal–Wallis test).
(F) RT-qPCR analysis of selected targets after treating GFP or N-expressing cells with Actinomycin D for the indicated times. Statistical significance was assessed using student’s t test (∗∗∗p ≤ 0.001, ∗∗p ≤ 0.01, ∗p ≤ 0.05, n.s.: non-significant). Error bars represent SEM. See also Figures S5 and S6, and Tables S16, S17, and S18.
Nucleocapsid expression affects multiple posttranscriptional processes
We next examined whether N could, directly or indirectly, alter various posttranscriptional regulatory programs of the host. We utilized RNA-seq datasets from control and N-expressing cells to assess alternative splicing (AS) as well as alternative cleavage and polyadenylation (APA) profiles. AS levels were quantified by calculating the percentage of transcripts with the exon spliced in “PSI” values. N expression in HEK293 cells altered splicing (ΔPSI > 10) of 264 cassette exons, of which 96 and 168 exhibited increased and decreased inclusion levels, respectively (Figure 6C, top left). In NaAsO2-treated cells, 425 retained introns and 597 cassette exons were detected with significant changes upon N expression (ΔPSI > 10). Among the cassette exons, 219 and 378 exhibited increased and decreased inclusion levels, respectively (Figure 6C, top right; Table S16). Remarkably, as was the case for gene expression, most of the effects of NaAsO2 on splicing disappeared in the presence of N (Figure 6C, bottom panels).
To examine APA, we analyzed our RNA-seq data using “Quantification of APA” (QAPA) (Ha et al., 2018). Application of QAPA to the RNA-seq datasets revealed that N expression resulted in significant and reproducible shifts in the percent of poly(A) usage (PAU) of 176 mRNA transcripts (Figure 6D; p value < 0.05; cut-off |ΔPAU|>20). Among these transcripts, 116 had decreased proximal PAU, resulting in 3′UTR lengthening, whereas 60 exhibited 3′UTR shortening (Table S17). In NaAsO2-treated cells, QAPA identified 216 transcripts with significant APA alterations (p value < 0.05), with 57 of them exhibiting 3′UTR lengthening and 159 transcripts showing significant 3′UTR shortening (Figure 6D; Table S18). Again, nearly all the effects of NaAsO2 on APA disappeared in the presence of N (Figure 6D, bottom panels). Since N is predominantly cytoplasmic, whereas splicing and cleavage/polyadenylation are co-transcriptionally regulated (Elkon et al., 2013; Herzel et al., 2017), the alterations in AS and APA profiles implied that these host nuclear functions might be indirectly impacted by N. Consistent with this idea, genes whose AS and APA effects of NaAsO2 disappear in the presence of N were significantly under-represented in N targets (hypergeometric p values 1.24 × 10⁻⁹ and 2.77 × 10⁻⁹ for AS and APA genes, respectively; Figure S5C).
G3BPs are thought to affect the stability and translation of mRNAs (Aulas et al., 2015; Edupuganti et al., 2017; Laver et al., 2020) and, given that N sequestered G3BP1, we correlated N-binding to the global change in the abundance of its target mRNAs. By comparing our RNA-seq datasets in N-expressing cells against GFP controls, we observed that, in contrast to the non-targets, N-bound transcripts had significantly more stable expression levels in both non-NaAsO2 (Figure 6E, left) and NaAsO2 conditions (p value < 0.001; Figure S6A). Likewise, when G3BP1 targets were considered, N-specific G3BP1 targets generally had more stable expression levels compared to the wild-type targets of G3BP1 (p value < 0.001; Figure S6B). These observations support a role for N in modulating target mRNA stability. Consistently, differentially expressed genes were significantly over-represented in N-bound mRNAs (p value < 2.9 e−30, hypergeometric test, Figure S6C). To corroborate these findings in infected cells, we utilized previously reported RNA-seq data generated in SARS-CoV-2 infected iAT2 cells (24 h postinfection). Consistently, N-targeted mRNAs were observed to be significantly more stable in their overall abundance compared to the non-targets (p value < 0.001; Figure 6E, right).
To further examine the role of N in mRNA stability, we conducted a time course study in which pre-mRNA synthesis was blocked by treating cells with the transcription inhibitor Actinomycin D. Total RNA was collected at 0, 2, 4, and 6 h after Actinomycin D treatment, and relative expression levels of selected target mRNAs were quantified by RT-qPCR. In comparison with the GFP-expressing control cells, CREBBP and NRIP1 transcripts were significantly stabilized whereas ZNF121 transcripts were destabilized in N-expressing cells (Figure 6F). In contrast, no significant difference in stability was observed for the non-target SLIT1 mRNA and 18S rRNA (Figures 6F and S6D). These results reinforce the idea that N posttranscriptionally affects host gene expression by modulating the stability of at least some of its target mRNAs.
Discussion
Given that the ongoing COVID-19 pandemic has globally caused more than three million deaths (World health organization data; April 28, 2021), there is an urgent need to better understand the SARS-CoV-2 life cycle for effective antiviral drug development. Starting from a functional proteomics workflow, we found that there is little overlap across studies that recently reported virus–host PPIs for SARS-CoV-2 proteins (Gordon et al., 2020b; Li et al., 2020). This observation is presumably due to varying experimental procedures and statistical analyses employed across the different AP-MS studies. Nevertheless, several of the PPIs identified in our study were recently recovered in human alveolar basal epithelial cells (A549) using AP-MS and proximity-dependent biotinylation approaches (Samavarchi-Tehrani et al., 2020; Stukalov et al., 2021). Since SARS-CoV-2 affects respiratory epithelial cells, the overlap between these studies supports the idea that information about virus–host PPIs can be gained through using simpler cell model systems (Lum and Cristea, 2016).
Our study shows that SARS-CoV-2 N can attenuate SG formation by localizing to SGs and sequestering G3BP1 and G3BP2 away from their interaction partners. The NTF2-like domain of G3BP1 has been shown to be a hub of protein–protein interactions (Sanders et al., 2020; Yang et al., 2020b). Since our docking studies implicated the NTF2-like domain in mediating the G3BP1 interaction with N, it is likely that N outcompetes host proteins for interaction with the NTF2-like domain of G3BP1. Although our preprint was the first to document the role of N in SG inhibition (Nabeel-Shah et al., 2020), subsequent studies independently reported that SARS-CoV-2 N inhibits SG formation while this manuscript was in preparation (Cai et al., 2021; Lu et al., 2021; Luo et al., 2021; Samavarchi-Tehrani et al., 2020). Furthermore, a recent study showed that SGs were inhibited upon NaAsO2 treatment in SARS-CoV-2 infected cells (Zheng et al., 2021), consistent with our results. SGs are typically formed upon viral infection as a cellular antiviral response (White and Lloyd, 2012; Yang et al., 2019; Zhang et al., 2019). Viruses, however, have evolved multiple counter-measures to manipulate and exploit SGs (Alam and Kennedy, 2019; Gao et al., 2021; White and Lloyd, 2012). For example, Zika virus hijacks host G3BPs to inhibit SG formation and to benefit its own replication (Wang et al., 2020a). Although MERS-CoV has also been shown to inhibit SG formation, which facilitates viral replication and translation (Nakagawa et al., 2018; Rabouw et al., 2016), it remains to be seen whether SG inhibition by N similarly enhances SARS-CoV-2 replication in infected cells.
SG induction after viral infection coincides with translational shutdown through the phosphorylation of eukaryotic initiation factor 2 subunit α (eIF2α) (de Breyne et al., 2020). Four kinases, specifically PERK, PKR, HRI, and GCN2, have been shown to be activated by stress conditions (de Breyne et al., 2020). During viral infection PKR is activated such that it undergoes structural rearrangements, dimerization, and auto-phosphorylation (Dauber and Wolff, 2009). Exposure to NaAsO2, on the other hand, activates HRI, and hence the eIF2α phosphorylation is PKR-independent under these conditions (Lu et al., 2001). Remarkably, a recent report showed that in infected cells SARS-CoV-2 N inhibited the phosphorylation of eIF2α by preventing PKR autophosphorylation (Zheng et al., 2021). Consistently, our preliminary experiments indicate that N expression had minimal effect on eIF2α phosphorylation upon NaAsO2 treatment (Figure S7). Further studies are required to fully investigate the inhibitory role of N on the PKR-eIF2α pathway and host mRNA translation.
In certain viruses, sequestration of G3BPs has been documented to impact the interferon (IFN) response by inhibiting the translation of interferon-stimulated genes (ISGs). Bidet et al. (2014) demonstrated that G3BP1, G3BP2, and CAPRIN1 are required for efficient translation of several ISGs in Dengue virus (DENV-2) infection (Bidet et al., 2014). Remarkably, it was found that a DENV-2 non-coding subgenomic flaviviral RNA (sfRNA) acted as an RNA sponge for G3BP1, G3BP2, and CAPRIN1, and binding of these RBPs to sfRNA prevented their antiviral activity resulting in downregulation of ISG mRNA translation (Bidet et al., 2014). Considering our finding that N sequestered G3BPs, it is conceivable that this sequestration might also adversely impact the translation of certain ISG mRNAs in SARS-CoV-2 infected cells. Further studies are required to examine this possible mechanism of host antiviral response evasion in SARS-CoV-2 infected cells.
SG assembly is driven by LLPS that occurs through the interaction of SG-nucleating proteins with RNA (Yang et al., 2020b). G3BP1 has been shown to be essential for SG formation, with its dimerization and RNA-binding being critical for SG condensation (Sanders et al., 2020; Yang et al., 2020b). Our finding that G3BP1 target mRNAs are greatly increased in stressed cells versus non-stressed wild-type cells is consistent with the reported enhanced G3BP1-mRNA interactions in response to stress (Yang et al., 2020b). SG assembly correlates with an increase in the number of uncoated mRNAs present in the cytoplasm of stressed cells (Panas et al., 2016). Since the mRNA-binding affinity of G3BP1 does not significantly change upon stress (Yang et al., 2020b), it has been suggested that this enhanced G3BP1-mRNA interaction is due to increased mRNA availability in the cytoplasm of stressed cells. We found that stress causes G3BP1 to bind to far fewer new mRNAs in the presence of N, likely due to the loss of G3BP1’s critical interactions with other SG proteins. This suggests that the increased number of G3BP1-mRNA interactions in stressed cells might be a tightly coordinated process involving G3BP1-interacting SG proteins rather than simply a passive one. Since RNA-mediated LLPS of G3BP1 is critical for SG formation, the observed reduction in new G3BP1 mRNA-targets in the presence of N likely provides a mechanism through which N attenuates host SGs, in addition to its role in the abrogation of G3BP1’s normal protein interactions.
LLPS provides an effective mechanism to locally enrich proteins and nucleic acids (Alberti et al., 2019; Forman-Kay et al., 2018), and RNA viruses that replicate in the cytoplasm are thought to utilize this mechanism to concentrate their replication machinery (Novoa et al., 2005). Since N inhibits G3BP1’s interactions with other SG proteins, and the two proteins nevertheless co-localize to SG-like foci, this suggests that N might sequester G3BP1 to form condensates distinct from stress granules. This notion is supported by two recent studies suggesting that N-G3BP1 forms condensates in the presence of RNA (Lu et al., 2021; Wang et al., 2021). SARS-CoV-2 N undergoes phase separation in the presence of RNA (Chen et al., 2020; Iserman et al., 2020; Jack et al., 2021; Savastano et al., 2020), which also appears to concentrate the viral replication machinery (Savastano et al., 2020). While the role of G3BPs in SARS-CoV-2 replication remains to be explored, these proteins have been shown to bind gRNA in infected cells (Flynn et al., 2021; Garcia-Moreno et al., 2019; Lee et al., 2021; Schmidt et al., 2020). Thus, it is conceivable that, by limiting G3BP1’s interaction with host mRNAs in stressed cells, N undergoes LLPS with G3BP1 when forming the condensates that contain viral gRNA.
Viral infection has been shown to result in changes in host cell steady-state mRNA levels (Guo et al., 2018b; Wada et al., 2018). For example, certain adenovirus and hepatitis C virus (HCV) proteins stabilize host mRNAs via binding to U- or A/U-rich elements present within 3′UTRs of target transcripts (Guo et al., 2018a; Kuroshima et al., 2011). AU-rich elements are present in many proto-oncogene, growth factor, and cytokine mRNAs, and they target mRNAs for degradation (Chen and Shyu, 1995; Vlasova et al., 2008; von Roretz et al., 2011). Although many of the mechanistic details of N-mediated modulation of mRNA stability remain unknown, we found that SARS-CoV-2 N sequesters G3BP1 away from its typical target transcripts and co-localizes with G3BP1 on many other mRNAs. Our finding that N impairs the host cell’s stress-induced gene expression changes through stabilization and/or destabilization of its target transcripts aligns with previous RNA-seq studies revealing that host antiviral and inflammatory responses are imbalanced upon SARS-CoV-2 infection (Blanco-Melo et al., 2020). The effects of N on AS and APA, as well as its ability to suppress the effects of stress on AS and APA, are likely to be indirect outcomes of its direct posttranscriptional effects on gene expression. We suggest that SARS-CoV-2 suppresses host antiviral responses through N protein-mediated SG inhibition and modulation of mRNA stability. Given that our initial finding of SG inhibition in N-expressing HEK293 cells (Nabeel-Shah et al., 2020) has been replicated in SARS-CoV-2 infected cells (Zheng et al., 2021), we envision that our results regarding N-mediated suppression of host anti-viral responses are physiologically relevant to patients infected with SARS-CoV-2.
Processing bodies (PBs) share several proteins with SGs and are active sites of mRNA decay (Corbet and Parker, 2019; Hubstenberger et al., 2017; Youn et al., 2019). Our results parallel a recent report showing that PBs are targeted for disassembly by human coronaviruses (Robinson et al., 2020). In that study, the expression of SARS-CoV-2 N alone was also found to be sufficient for disassembling PBs (Robinson et al., 2020). Thus, it is conceivable that N-mediated SG inhibition and modulation of mRNA stability are also coordinated with the disassembly of PBs. We suggest that SARS-CoV-2 N exerts multiple impacts on cellular processes by sequestering G3BP1 (and G3BP2) upon infection, altering host gene expression by rewiring RNA-binding of G3BP1, attenuating antiviral SG formation, and undergoing LLPS with G3BPs to facilitate viral gRNA replication and packaging (Luo et al., 2021; Savastano et al., 2020; Wang et al., 2021) (Figure 7).
Figure 7.

Proposed model for SARS-CoV-2 N in infected cells
The model highlights multi-level impacts of N in infected cells.
N is a promising target for antiviral drug and vaccine development. Given that SARS-CoV-2 N is highly abundant in infected cells, targeting the SG formation pathway through G3BPs might be a suitable alternative strategy for antiviral drug development (Wang et al., 2020a). Several existing chemotherapy drugs could be re-purposed to enhance SG formation during viral infection (Fournier et al., 2010; Gao et al., 2019; Wang et al., 2020a). Casein kinase 2 (CK2) inhibitors might be useful as antiviral drugs, since CK2 interferes with SG assembly by phosphorylation of G3BP1 (Reineke et al., 2017). Given the evolutionary conservation of their interaction, small molecules that disrupt the N-G3BP1 interaction might have broad applications as novel antiviral drugs. Collectively, our findings provide novel insights into mechanisms through which SARS-CoV-2 might reduce the host antiviral responses and identify G3BP1/2 as promising alternative drug targets for treating COVID-19.
Limitations of the study
Our use of a simplified model system might not represent the full extent of N’s role within infected cells. N binds to viral gRNA in infected cells, which might affect its ability to target host mRNAs. Furthermore, the observed rescue of SG formation upon G3BP1 overexpression in N-expressing cells requires further investigation in the context of infected cells. However, considering that several concurrent reports have provided complementary evidence for at least some of our findings (Carlson et al., 2020; Luo et al., 2021; Samavarchi-Tehrani et al., 2020; Savastano et al., 2020; Wang et al., 2021), we believe that our results reflect N’s impact on cellular pathways in cells infected by SARS-CoV-2. Given the roles of SGs and G3BPs (Alam and Kennedy, 2019), further studies should explore the impact of N on host mRNA translation.
STAR★Methods
Key resources table
| REAGENT or RESOURCE | SOURCE | IDENTIFIER |
|---|---|---|
| Antibodies | ||
| Rabbit polyclonal Anti-GFP | Abcam | ab290; RRID:AB_303395 |
| Mouse monoclonal Anti-GFP |
Life Technologies | G10362; RRID:AB_2536526 |
| Mouse monoclonal Anti-G3BP1 |
Santa Cruz | sc-365338; RRID:AB_10846950 |
| Mouse monoclonal Anti-GAPDH | Abcam | ab8245; RRID:AB_2107448 |
| Mouse monoclonal Anti-Flag M2 | Sigma-Aldrich | F3165; RRID:AB_262044 |
| Mouse monoclonal Anti-USP10 |
Santa Cruz | sc-365828; RRID:AB_10846854 |
| Rabbit polyclonal Anti-G3BP2 | Abcam | ab86135; RRID:AB_1925011 |
| Rabbit polyclonal Anti-Caprin 1 | Bethyl | A303-881A; RRID:AB_2620231 |
| Bacterial and virus strains | ||
| Subcloning Efficiency DH5a Competent Cells | Thermo Fisher Scientific | 18265017 |
| Chemicals, peptides, and recombinant proteins | ||
| 4% Paraformaldehyde | VWR | 102091-906 |
| Benzonase Nuclease | Sigma-Aldrich | E826 |
| BSA | NEB | B9000S |
| DAPI | Sigma-Aldrich | D9542-5MG |
| DMEM (high glucose) | Sigma-Aldrich | D5796 |
| Doxycycline hyclate | Sigma-Aldrich | D9891 |
| FastAP | Thermo Fisher Scientific | EF0651 |
| FBS | GIBCO | 12483-020 |
| Hygromycin B | Sigma-Aldrich | 10843555001 |
| IGEPAL CA-630 | Sigma-Aldrich | I8896-100ML |
| Lipofectamine 2000 | Thermo Fisher Scientific | 11668019 |
| Opti-MEM I Reduced Serum Medium | GIBCO | 31985070 |
| Proteinase K | Thermo Fisher Scientific | 25530049 |
| Poly-D-Lysine | Sigma-Aldrich | 6407 |
| Puromycin | Sigma-Aldrich | P8833 |
| RNAiMAX | Thermo Fisher Scientific | 13778150 |
| RNase I | Thermo Fisher Scientific | AM2295 |
| RNaseOUT Recombinant Ribonuclease Inhibitor | Invitrogen | 10777019 |
| Sodium pyruvate | GIBCO | 11360-070 |
| SUPERase In RNase Inhibitor | Ambion | AM2696 |
| Triton X-100 | Sigma-Aldrich | T8787-100ML |
| Turbo DNase | Thermo Fisher Scientific | AM2238 |
| T4 polynucleotide kinase | NEB | M0201L |
| FastAP Thermosensitive Alkaline Phosphatase | Thermo Fisher Scientific | EF0651 |
| Sodium arsenite | Sigma-Aldrich | N/A |
| Actinomycin D | Sigma-Aldrich | A1410 |
| TRIzol Reagent | Invitrogen | 15596018 |
| β-mercaptoethanol | Sigma-Aldrich | M6250 |
| Critical commercial assays | ||
| AccuPrime SuperMix I | Thermo Fisher Scientific | 12344040 |
| AllPrep DNA/RNA Mini Kit | QIAGEN | 80204 |
| Dynabeads protein G | Thermo Fisher Scientific | 10004D |
| Maxima First Strand cDNA Synthesis Kit for RT-qPCR | Thermo Fisher Scientific | K1671 |
| NEBNext High-Fidelity 2X PCR Master Mix | NEB | M0541L |
| SuperScript VILO Kit | Invitrogen | 11754 |
| SYBR Green Master qPCR mix | Applied Bioscience | 4385617 |
| RNeasy Mini Kit | QIAGEN | 74106 |
| Select-a-Size DNA Clean & Concentrator | Zymo | D4080 |
| CircLigase™ II ssDNA Ligase | Lucigen | CL9025K |
| Deposited data | ||
| Affinity-Purification Mass-Spectrometry SARS-CoV-2 |
This study | ftp://massive.ucsd.edu/MSV000086704/ |
| AP-MS G3BP1,2 | This study | ftp://massive.ucsd.edu/MSV000088232/ |
| iCLIP-Seq | This study | GEO: GSE171010 |
| RNA-Seq | This study | GEO: GSE171010 |
| Experimental models: Cell lines | ||
| Human: Flp-In 293 T-REx cell lines | Invitrogen | R780-07 |
| Oligonucleotides | ||
| Primers: Table S19 | This study | N/A |
| Software and algorithms | ||
| MetaPlotR | Olarerin-George and Jaffrey (2017) | https://github.com/olarerin/metaPlotR |
| ShinyGO (v0.66) | Ge et al. (2020) | http://bioinformatics.sdstate.edu/go/ |
| ClusterProfiler 3.16.1 | Yu et al. (2012) | https://bioconductor.org/packages/release/bioc/html/clusterProfiler.html |
| EnhancedVolcanoplot | Unpublished | https://github.com/kevinblighe/EnhancedVolcano |
| DESeq2 3.11 | Love et al. (2014) | https://www.bioconductor.org/packages/release/bioc/html/DESeq2.html |
| Cytoscape | Cline et al. (2007) | Version: 3.4.0 |
| QAPA | Ha et al. (2018) | https://github.com/morrislab/qapa |
| GOplotTools | Unpublished | https://github.com/UBrau/GOplotTools |
| ImageJ | NIH | https://imagej.nih.gov/ij/ |
| MS Data Significance Analysis of INTeractome analysis: SAINT | Teo et al. (2014) | Version exp3.3 |
| Maxquant | Tyanova et al. (2016) | Version: 1.6.6.0 |
| ProHits-viz | Knight et al. (2017) | https://prohits-viz.org/ |
| Cutadapt 2.10 | Martin (2011) | http://code.google.com/p/cutadapt/ |
| Pureclip | Krakau et al. (2017) | https://github.com/skrakau/PureCLIP |
| STAR 2.7.1 | Dobin et al. (2013) | https://anaconda.org/bioconda/star/files?version=2.7.1a |
| vast-tools 1.0 | Tapial et al. (2017) | https://github.com/vastgroup/vast-tools |
| UMI-tools 1.0.1 | Smith et al. (2017) | https://github.com/CGATOxford/UMI-tools |
| MEGA7 | Kumar et al. (2016) | https://www.megasoftware.net/ |
Resource availability
Lead contact
Further information and requests for resources, reagents, and materials should be directed to and will be fulfilled by the lead contact, Jack F. Greenblatt (jack.greenblatt@utoronto.ca).
Materials availability
Flp-In HEK293 T-REx cell lines inducibly expressing SARS-CoV-2 proteins fused to GFP were generated in this study and are available upon request from the lead contact.
Experimental model and subject details
Cell cultures
HEK293 cells (Flp-In 293 T-REx cell lines) were obtained from Life Technologies (Invitrogen catalogue number R780-07). Cell cultures were maintained in Dulbecco's modified Eagle's medium (DMEM) (Wisent Bioproducts catalogue number 319-005-CL), which was supplemented with 10% FBS (Wisent Bioproducts catalogue number 080-705), sodium pyruvate, non-essential amino acids, and penicillin/streptomycin as described (Marcon et al., 2014).
Method details
Epitope tagging in HEK293 cells
GatewayTM-compatible entry clones for 28 viral ORFs (Kim et al., 2020) (kindly provided by Dr. Frederick P. Roth) were cloned into the pDEST pcDNA5/FRT/TO-eGFP vector according to the manufacturer's instructions to create fusions between eGFP and viral proteins. The vectors were co-transfected into Flp-In T-REx 293 cells with the pOG44 Flp recombinase expression plasmid. Cells were selected with hygromycin (Life Technologies, 10687010) at 200 μg/ml for FRT site-specific recombination into the genome. Doxycycline (1 μg/ml) was added to the culture medium 24 hours before harvesting to induce the expression of the various viral genes of interest.
Antibodies
The following antibodies were used in this work: Flag (Sigma monoclonal antibody catalogue number F1804); GFP (Abcam polyclonal antibody catalogue number 290); GFP monoclonal antibody (Life Technologies G10362); G3BP1 (Santa Cruz monoclonal antibody catalogue number sc-365338); Caprin 1 (Bethyl A303-881A); and USP10 (Santa Cruz monoclonal antibody catalogue number 365828).
Immunoprecipitation (IP) and western blots
To perform Co-IP experiments, cell pellets were lysed in 1 mL of lysis buffer (140 mM NaCl, 10 mM Tris pH 7.6–8.0, 1% Triton X-100, 0.1% sodium deoxycholate, 1 mM EDTA) containing protease inhibitors (Roche catalogue number 05892791001). Cell extracts were incubated with 75 units of Benzonase (Sigma E1014) for 30 minutes in a cold room with end-to-end rotation. The cell lysates were cleared in a microcentrifuge at 15,000 g for 30 minutes at 4°C. The supernatant was transferred to a new tube and incubated with 1μg of GFP antibody for 2 hours, and subsequently 10 μL protein G Dynabeads were added and incubated for an additional 2 hours (Invitrogen catalogue number 10003D). The samples were washed three times with lysis buffer containing an additional 1% NP40 and 2% Triton X-100 for 5 minutes each in a cold room with end-to-end rotation. The samples were then boiled in SDS gel sample buffer. Samples were resolved using 4–12% BisTris–PAGE and transferred to a PVDF membrane (Bio-Rad catalogue number 162-0177) using a Gel Transfer Cell (BioRad catalogue number 1703930). Primary antibodies were used at 1:5000 dilution, and horseradish peroxidase-conjugated goat anti-mouse (Thermo Fisher 31430) or anti-rabbit secondary (Thermo Fisher 31460) antibodies were used at 1:10,000. Blots were developed using Pierce ECL Western Blotting Substrate (Thermo Scientific catalogue number 32106).
iCLIP-seq experiments
Individual nucleotide resolution UV crosslinking and immunoprecipitation (iCLIP) (Huppertz et al., 2014) was performed with the modifications detailed in our previous report (Han et al., 2017), as well as described below. Briefly, cells were grown in 15 cm culture plates and were UV cross-linked with 0.15 J/cm2 at 254 nm in a Stratalinker 1800 after induction with Doxycycline (1 μg/ml) for 24 hours. To model stressed condition, cells were treated with 0.5 mM sodium arsenite (NaAsO2) for one hour prior to UV crosslinking. Cells were lysed in 2.2 mL of iCLIP lysis buffer. 1 mL of lysate was incubated with Turbo DNase (Life Technologies catalogue number AM2238) and RNase I (1:250; Ambion catalogue number AM2294) for 5 minutes at 37°C to digest the genomic DNA and obtain RNA fragments of an optimal size range. GFP-N was immunoprecipitated using 5 μg of anti-GFP antibody (Life Technologies G10362), whereas G3BP1 was immunoprecipitated using 5 μg of anti-G3BP1 antibody (Santa Cruz monoclonal antibody catalogue number sc-365338). A total of 2% input material was set aside for size-matched control libraries (SMI) prior to the IPs. Following stringent washes with iCLIP high salt buffer and dephosphorylation with FastAP and T4 polynucleotide kinase, on-bead-ligation of pre-adenylated adaptors to the 3′-ends of RNAs was performed using the enhanced CLIP ligation method (Nostrand et al., 2016). The immunoprecipitated RNA was 5′-end-labeled with 32P using T4 polynucleotide kinase (New England Biolabs catalogue number M0201L), separated using 4–12% BisTris–PAGE and transferred to a nitrocellulose membrane (Protran). For the input sample, resolved on 4–12% BisTris–PAGE and transferred to a nitrocellulose membrane alongside the immunoprecipitated RNA, the membrane was cut to match the size of the IP material. RNA was recovered by digesting proteins using proteinase K (Thermo Fisher catalogue number 25530049) and subsequently reverse transcribed into cDNA using barcoded primers. The cDNA was size-selected (low: 70 to 85 nt, middle: 85 to 110 nt, and high: 110 to 180 nt), and circularized using CircLigase™ II ssDNA ligase to add the adaptor to the 5-end. We used Betaine in the CircLigase reaction at a final concentration of 1 M, and the reaction mixture was incubated for 2 hours at 60°C. Circularize cDNA was digested at the internal BamHI site for linearization, and PCR amplified using AccuPrime SuperMix I (Thermo Fisher catalog number 12344040) or Phusion High-Fidelity PCR Master Mix (NEB, M0531S). The final PCR libraries were agarose gel purified on purification columns (QIAGEN), and the eluted DNA was mixed at a ratio of 1:5:5 from the low, middle, and high fractions and submitted for sequencing on Illumina NextSeq 500 platform using a full High-Output v2.5 flow cell to generate single-end 51 nucleotide reads with 40M read depth per sample.
The barcoded primers used for iCLIP-seq are listed in Table S19.
RNA immunoprecipitation (RIP)
To analyze G3BP1 binding to target mRNAs, RNA immunoprecipitation experiments were performed in wild-type and N-expressing HEK293 cells treated with NaAsO2 for one hour. Briefly, cells grown in 10-cm plates were harvested and resuspended in 1 mL lysis buffer containing 25 mM Tris HCl pH 7.5, 150 mM NaCl, 0.5% (v/v) NP-40, 1 mM AEBSF and 1 mM DTT, supplemented with RNase and protease/phosphatase inhibitors. Lysed cells were incubated on ice for 30 minutes. Cell lysates were clarified by centrifugation (30 min, 20000 g, 4°C), and 5% of the lysate was taken as input sample. RNA immunoprecipitation was performed using 5 μg of anti-G3BP1 antibody (Santa Cruz monoclonal antibody catalogue number sc-365338) conjugated with Protein G Dynabeads (Invitrogen). For control IPs, 5 μg of IgG (Santa Cruz Biotechnology, catalog number: sc-2025) was used. The IPs were performed for 2–3 hours at 4°C while rotating. The beads were washed three times with wash buffer containing 25 mM Tris HCl pH 7.5, 150 mM NaCl, 0.05% (v/v) NP-40, 1 mM AEBSF and 1 mM DTT, with 5 minutes of rotation at 4°C for each wash. RNA from the input and IP samples was extracted using Trizol Reagent (Invitrogen catalogue number 15596018) as per the manufacturer’s instructions. cDNA was synthesized using the First-strand cDNA synthesis kit (Thermo Fisher Scientific) with random hexameric primers.
Affinity purification followed by mass spectrometry
To perform AP-MS procedure, ∼20 × 106 HEK293 cells were grown in two independent batches, representing biological replicates. After 24 hours of induction of protein expression using Doxycycline (1 μg/ml), cells were harvested. Cell pellets were lysed in high-salt NP-40 lysis buffer (10 mM Tris-HCl pH 8.0, 420 mM NaCl, 0.1% NP-40, plus protease/phosphatase inhibitors) with three freeze-thaw cycles. The lysate was sonicated as described in our previous reports (Marcon et al., 2014; Schmitges et al., 2016). To remove genomic DNA and RNA, we treated cell lysates with Benzonase for 30 minutes at 4°C with end-to-end rotation. The resulting whole-cell extract was centrifuged to pellet cellular debris. GFP-tagged viral proteins were immunoprecipitated with 1 μg of GFP antibody (G10362, Life Technologies) overnight in the cold room followed by a 2-hour incubation with Protein G Dynabeads (Invitrogen). The beads were washed 3 times with high-salt buffer (10mM TRIS-HCl, pH7.9, 300mM NaCl, 0.1% NP-40) with end-to-end rotation in the cold room and twice with buffer without detergent (10mM TRIS-HCl, pH7.9, 100 mM NaCl). The immunoprecipitated proteins were eluted with 0.5M NH4OH and lyophilized.
Sample preparation and proteomic analysis
Each purified eluate was digested in-solution with trypsin for MS analysis. Briefly, each sample was resuspended in 44 uL of 50mM NH4HCO3, reduced with 100mM TCEP-HCL, alkylated with 500mM iodoacetamide for 45 min in a dark room, and digested with 1 μg of trypsin overnight at 37°C. Samples were desalted using ZipTip Pipette tips (EMD Millipore) using standard procedures. The desalted samples were analyzed with an LTQ-Orbitrap Velos mass spectrometer (ThermoFisher Scientific) utilizing a 90-minute HPLC gradient and top 15 data-dependent acquisition.
Experimental design for mass spectrometry
We processed independently at least two biological replicates for each bait along with negative controls in each batch of samples. Material from HEK293 cells expressing only GFP was used as control. We performed extensive washes between samples to minimize carry-over. Furthermore, the order of sample acquisition on the mass spectrometer was reversed for the second replicate to avoid systematic bias.
Mass spectrometry data analysis
AP-MS datasets were searched with Maxquant (v.1.6.6.0) (Tyanova et al., 2016). Human protein reference sequences from the UniProt Swiss-Prot database were downloaded on 18-06-2020. SARS-CoV-2 protein reference sequences (GenBank accession NC_045512.2, isolate=Wuhan-Hu-1) were downloaded from https://www.ncbi.nlm.nih.gov/datasets/coronavirus/proteins on 14-09-2020, supplemented by isolate 2019-nCoV/USA-WA1/2020 (GenBank Accession MN985325) for ORF3b, ORF9b and ORF9c. Spectral counts as well as MS intensities for each identified protein were extracted from Maxquant protein Groups file. The resulting data were filtered using SAINTexpress (Teo et al., 2014) to obtain confidence values utilizing our two biological replicates. SAINTexpress Bayesian false discovery rate [FDR] ≤ 0.01 was chosen as cut-off. The AP-MS data generated from HEK293 cells expressing GFP alone were used as a negative control for SAINTexpress analysis.
MS data visualization, functional enrichment, and archiving
We used Cytoscape (V3.4.0; (Cline et al., 2007)) to generate protein-protein interaction networks. For better illustration, individual nodes were manually arranged. Heatmaps were generated using ProHits-viz (Knight et al., 2017). Functional enrichment of PPI data was performed using ShinyGO (v0.66) (Ge et al., 2020), which utilizes a hypergeometric distribution, followed by FDR correction (FDR cutoff was 0.05). All MS files used in this study were deposited at MassIVE (http://massive.ucsd.edu).
Sodium arsenite (NaAsO2) treatment
HEK293 cells were treated with 0.5 mM Sodium Arsenite (NaAsO2) for one hour. Briefly, we used HEK293 cells expressing SARS-CoV-2 N protein tagged with GFP (GFP-N), GFP alone, and ‘GFP-N + untagged G3BP1’. The expression was induced with doxycycline (1 μg/ml) for 24 hours prior to NaAsO2 treatment.
Immunofluorescence
SARS-CoV-2 GFP-N and GFP expressing HEK293 cells were seeded on poly-L-lysine coated and acid-washed coverslips. The expression of the proteins was induced using 1 μg/ml doxycycline for 24 hours. Sodium arsenite (NaAsO2) treatment was performed as described above for one hour prior to cell fixation. NaAsO2 was removed and cells were washed three times with PBS. Cells were fixed in 4% Paraformaldeyde for 15 minutes. Cells were subsequently permeabilized with 0.2% Triton X-100 in PBS for 5 minutes and incubated with block solution (1% goat serum, 1% BSA, 0.5% Tween-20 in PBS) for 1 hour. Santa Cruz G3BP1 (H-10) antibody was used for staining at 1:100 concentration in block solution for 2 hours at room temperature (RT). Cells were incubated with Goat anti-mouse secondary antibody and Hoescht stain in block solution for 1 hour at room temperature. Cells were fixed in Dako Fluorescence Mounting Medium (S3023). Imaging was performed the next day using a Zeiss confocal spinning disc AxioObserverZ1 microscope equipped with an Axiocam 506 camera using Zen software. A single focal plane was imaged, and stress granule quantification was performed for each replicate (n = 2; number of cells 50). The average number of stress granules per cell was plotted as a box plot, and statistical significance was calculated using the student’s t test.
RNA extraction and sequencing
Total RNA was extracted using the RNeasy extraction kit (Qiagen) following the manufacturer’s instructions. Two independent biological samples for each condition were generated, resulting in a total of eight samples. DNase-treated total RNA was then quantified using Qubit RNA BR (cat # Q10211, Thermo Fisher Scientific Inc., Waltham, USA) fluorescent chemistry, and 1 ng was used to obtain an RNA Integrity Number (RIN) using the Bioanalyzer RNA 6000 Pico kit (cat # 5067-1513, Agilent Technologies Inc., Santa Clara, USA). Lowest RIN was 9.3; median RIN score was 9.75.
1000 ng per sample was then processed using the NEBNext Ultra II Directional RNA Library Prep Kit for Illumina (cat # E7760L; New England Biolabs, Ipswich, USA; protocol v. v3.1_5/20) including PolyA selection, with 15 minutes of fragmentation at 94°C and 8 cycles of amplification. 1 uL top stock of each purified final library was run on an Agilent Bioanalyzer dsDNA High Sensitivity chip (cat # 5067-4626, Agilent Technologies Inc., Santa Clara, USA). The libraries were quantified using the Quant-iT dsDNA high-sensitivity (cat # Q33120, Thermo Fisher Scientific Inc., Waltham, USA) and were pooled at equimolar ratios after size-adjustment. The final pool was run on an Agilent Bioanalyzer dsDNA High Sensitivity chip and quantified using the NEBNext Library Quant Kit for Illumina (cat # E7630L, New England Biolabs, Ipswich, USA)."
The quantified pool was hybridized at a final concentration of 2.215 pM, and single-end reads were obtained on an Illumina NextSeq 500 platform using a full High-Output v2.5 flowcell at 75 bp read lengths, for an average of 52 million pass-filter clusters per sample.
Quantitative PCR
Total RNA was extracted using Trizol Reagent (Invitrogen catalogue number 15596018) as per the manufacturer’s instructions. RNA was used for cDNA synthesis with the SuperScript VILO Kit (Invitrogen catalogue number 11754). RT-qPCR was performed with Fast SYBR Green Master qPCR mix (Applied Bioscience 4385617) on an Applied Biosystems 7300 real time PCR System (Thermo Fisher catalogue number 4406984). For quantitative PCR, the following program was used: 40 cycles of 95°C for 15 s and 60°C for 30 s, with a final cycle of 95°C for 15 s and then 60°C. GAPDH was used as loading control.
Actinomycin D treatment was carried out with 5 μg/ml Actinomycin D (Sigma-Aldrich catalogue number A1410) for the indicated times prior to RNA extraction. 18S rRNA was used as loading control for the Actinomycin D RT-qPCR. For each time point, relative transcript levels were normalized to 18S rRNA and time point “0”, using the ΔΔCT method (Livak and Schmittgen, 2001). This method uses the threshold cycles (CTs) generated by the qPCR system for calculation of gene expression levels. Primers are listed in Table S20.
Prediction of complex structure model between G3BP1 and N protein
The crystal structures for G3BP1 and the SARS-CoV-2 N protein were downloaded from the Protein Data Bank (PDB) to build their complex structure model (PDB ID: 4FCJ_A and 6M3M_B). The amino acid sequence for each protein was extracted from the corresponding structure files according to the ‘ATOM’ records. We generated MSA for each protein by running HHblits (Remmert et al., 2012) with 8 iterations and E-value = 1E-20 to search through the Uniclust30 library. The G3BP1 had 9435 homologous sequences, and the N protein had 2665. These sequences were paired based on genomic distance or phylogeny. However, only the origin sequence was left after this concatenation. Thus, we input the concatenated single sequence to the deep learning-based algorithm trRosetta (Yang et al., 2020a) to predict the interface residues. The interface residues were used as distance constraints to build a complex structure model with the HDOCK server (Yan et al., 2020). Finally, we utilized the Rosetta docking protocol to optimize the interface with local refinement (Gray et al., 2003). The interface energy of the final model was −5.46, which indicates a reliable model according to the Rosetta document (Gray et al., 2003).
Phylogenetic analysis of N
To reconstruct a protein phylogeny, we used amino acid sequences of N from related coronaviruses (Table S21). Multiple sequence alignments were built using MUSCLE with default parameters, and phylogenetic analysis was performed using the neighbour joining method with 1000 bootstrap replicates. The analysis was carried out using MEGA7 (Kumar et al., 2016).
Quantification and statistical analysis
Alignment and read processing
iCLIP libraries were demultiplexed using XXXNNNNXX barcodes, where X is a random nucleotide. The 5′barcode and the Illumina adaptor were trimmed using Cutadapt (Martin, 2011) (ver 2.10). The PCR duplicates were collapsed using UMI-tools (Smith et al., 2017) (ver 1.0.1). RNA-seq and iCLIP library reads were mapped to Gencode assembly (Frankish et al., 2019) (GRCh37.p13) using STAR (Dobin et al., 2013) (ver 2.7.1). Only the uniquely mapping reads were used for the downstream analyses. Mapped reads were annotated using the GRCh37.p13 comprehensive gene annotation.
RNA-seq analysis
To identify the differentially expressed genes from RNA-seq data, we used DESeq2 (Love et al., 2014) (ver 3.11) on gene counts generated using STAR and the human Gencode annotation V19. We filtered out genes with less than 10 counts across the sum of all RNA-seq samples. To plot differentially expressed genes as volcano plots, we used R-package EnhancedVolcanoplot (https://github.com/kevinblighe/EnhancedVolcano). The Gene Ontology enrichment analysis was performed and visualized using clusterProfiler (Yu et al., 2012) (version 3.16.1), with the universe set to all the genes detected by RNA-seq. Multiple testing correction was performed using the Benjamini-Hochberg method, and q-value cut off of 0.05 was used. Additionally, GO/KEGG enrichment was performed using ShinyGO (v0.61), which utilizes a hypergeometric distribution followed by FDR correction, where the FDR cutoff was set to 0.05.
Alternative splicing analysis
Alternative splicing analysis was performed as described previously (Hekman et al., 2020). Analysis was performed using vast-tools v2.2.2 (Tapial et al., 2017) in combination with VastDB version Hs2, released on Dec. 12, 2019 using option–IR_version 1. Changes were considered significant if they were greater than 10 dPSI/dPIR and the expected minimum change was different from zero at p > 0.95 according to vast-tools’ diff module. Events were filtered requiring a minimum of 10 reads per event and a balance score (quality score 4) of ‘OK’,‘B1’ f, ‘B2’, ‘Bl’ or ‘Bn’ for alternative exons or > 0.05 for intron retention events in at least 2 of 3 replicates.
Alternative cleavage and polyadenylation analysis
Alternative cleavage and polyadenylation analysis was performed using QAPA with default settings, essentially as previously described (Ha et al., 2018). QAPA builds the database of 3′ UTRs from all the mappable protein-coding genes using GENCODE basic gene annotation (version 19) for humans (hg19). To quantify the relative usage of proximal poly(A) sites, percentage of expression of a single 3′ UTR over the total expression level of all 3′ UTRs for a given gene is calculated. In the current study, lengthening events were defined as those with percentage of proximal Poly(A) Usage Index (PAU) group difference between N and GFP cells (PAU_Group_diff) < −20% and shortening events with PAU_Group_diff > 20%.
iCLIP metagene and motif analysis
Significant iCLIP peaks were called using Pureclip (Krakau et al., 2017) (FDR ≤ 0.05), with input control, replicates, and default settings, and the cross-linking sites within 50 bp from each other were merged. To visualize the distribution of N and G3BP1 proteins on genes, we used MetaPlotR (Olarerin-George and Jaffrey, 2017) to calculate and scale the distance of peaks relative to transcriptomic features. To visualize the distance between N peaks and other peaks, we used bedtools distance function to calculate the distances. The distances that were within ±1000 bp of N peaks were plotted. We used bedtools (Quinlan and Hall, 2010) (ver 2.29.2) to retrieve DNA sequences from the iCLIP peaks and subjected the sequences to motif analysis using the MEME-ChIP suite (Bailey et al., 2015) (version 5.1.1).
Acknowledgments
Authors would like to thank Dr. Frederick P. Roth for providing the SARS-CoV-2 ORFs. We thank Dr. Thomas Gonatopoulos-Pournatzis for critical reading of the initial draft of this manuscript. Dr. Andrew Best is acknowledged for providing technical assistance. Dr. Alexander F. Palazzo is gratefully acknowledged for providing eIF2α and PKR antibodies. All members of the Greenblatt laboratory are acknowledged for helpful discussions. SN-S would like to thank Ms. Umm-ul-Khair for inspirational discussions. Tanja Durbic and Kyle Turner at the Donnelly Sequencing Center are gratefully acknowledged for their assistance with next-generation sequencing. HL was supported by a Canada Graduate Scholarship from NSERC. UB was supported by the Toronto COVID-19 Action Fund. This work was primarily funded by the Canadian Institutes of Health Research Foundation Grant FDN-154338 to JFG.
Author contributions
SN-S and JFG conceived and designed the study. SN-S performed iCLIP-seq, RNA-seq, Co-IPs, participated in IFs, contributed to the computational analyses and coordinated the project. HL performed iCLIP-seq and RNA-seq data analyses. NA performed Actinomycin D RT-qPCR, Co-IPs, participated in iCLIP experiments and manuscript preparation. GLB performed Co-IPs, Actinomycin D, and RT-qPCR experiments. KA participated in iCLIP-seq, RNA-seq data analyses, figures preparation, and edited the manuscript. SF conducted IF and RNA extraction experiments. SP analyzed the AP-MS data and performed QAPA analysis. UB participated in splicing analyses. GZ and HT generated cell lines. HW performed docking analyses. GZ and EM performed AP-MS experiments. JY supervised HW. BJB supervised SF and edited the manuscript. ZZ supervised HL and edited the manuscript. JFG supervised the project and data analyses. JFG and SN-S wrote the manuscript. All authors have read and approved the final manuscript.
Declaration of interests
The authors declare no competing interests.
Published: January 21, 2022
Footnotes
Supplemental information can be found online at https://doi.org/10.1016/j.isci.2021.103562.
Supplemental information
Data and code availability
-
•
All proteomics data produced in this work have been deposited in MassIVE resource (http://massive.ucsd.edu) and has been assigned ID MSV000086704 for SARS-CoV-2 related and MSV000088232 for G3BP1 and G3BP2 AP-MS data. RNA-seq and iCLIP-seq data have been deposited in the Gene Expression Omnibus (GEO) with accession number GSE171010. Accession numbers and direct downloadable links for AP-MS data are provided in Table S22.
-
•
This paper does not report original code.
-
•
Scripts for data analysis are available from the lead contact upon request.
References
- Alam U., Kennedy D. Rasputin a decade on and more promiscuous than ever? A review of G3BPs. Biochim. Biophys. Acta Mol. Cell Res. 2019;1866:360–370. doi: 10.1016/j.bbamcr.2018.09.001. [DOI] [PMC free article] [PubMed] [Google Scholar]
- Alberti S., Gladfelter A., Mittag T. Considerations and challenges in studying liquid–liquid phase separation and biomolecular condensates. Cell. 2019;176:419–434. doi: 10.1016/j.cell.2018.12.035. [DOI] [PMC free article] [PubMed] [Google Scholar]
- Aulas A., Caron G., Gkogkas C.G., Mohamed N.V., Destroismaisons L., Sonenberg N., Leclerc N., Alex Parker J., Velde C.V. G3BP1 promotes stress-induced RNA granule interactions to preserve polyadenylated mRNA. J. Cell Biol. 2015;209:73–84. doi: 10.1083/jcb.201408092. [DOI] [PMC free article] [PubMed] [Google Scholar]
- Bailey T.L., Johnson J., Grant C.E., Noble W.S. The MEME suite. Nucleic Acids Res. 2015;43:W39–W49. doi: 10.1093/nar/gkv416. [DOI] [PMC free article] [PubMed] [Google Scholar]
- Bartuzi P., Billadeau D.D., Favier R., Rong S., Dekker D., Fedoseienko A., Fieten H., Wijers M., Levels J.H., Huijkman N., et al. CCC- and WASH-mediated endosomal sorting of LDLR is required for normal clearance of circulating LDL. Nat. Commun. 2016;7:1–11. doi: 10.1038/ncomms10961. [DOI] [PMC free article] [PubMed] [Google Scholar]
- Bidet K., Dadlani D., Garcia-Blanco M.A. G3BP1, G3BP2 and CAPRIN1 are required for translation of interferon stimulated mRNAs and are targeted by a Dengue virus non-coding RNA. PLoS Pathog. 2014;10:e1004242. doi: 10.1371/JOURNAL.PPAT.1004242. [DOI] [PMC free article] [PubMed] [Google Scholar]
- Blanco-Melo D., Nilsson-Payant B.E., Liu W.C., Uhl S., Hoagland D., Møller R., Jordan T.X., Oishi K., Panis M., Sachs D., et al. Imbalanced host response to SARS-CoV-2 drives development of COVID-19. Cell. 2020;181:1036–1045.e9. doi: 10.1016/j.cell.2020.04.026. [DOI] [PMC free article] [PubMed] [Google Scholar]
- Buchan J.R., Parker R. Eukaryotic stress granules: the ins and outs of translation. Mol. Cell. 2009;36:932–941. doi: 10.1016/j.molcel.2009.11.020. [DOI] [PMC free article] [PubMed] [Google Scholar]
- Cai T., Yu Z., Wang Z., Liang C., Richard S. Arginine methylation of SARS-Cov-2 nucleocapsid protein regulates RNA binding, its ability to suppress stress granule formation, and viral replication. J. Biol. Chem. 2021;297:100821. doi: 10.1016/j.jbc.2021.100821. [DOI] [PMC free article] [PubMed] [Google Scholar]
- Carlson C.R., Asfaha J.B., Ghent C.M., Howard C.J., Hartooni N., Safari M., Frankel A.D., Morgan D.O. Phosphoregulation of phase separation by the SARS-CoV-2 N protein suggests a biophysical basis for its dual functions. Mol. Cell. 2020;80:1092–1103.e4. doi: 10.1016/j.molcel.2020.11.025. [DOI] [PMC free article] [PubMed] [Google Scholar]
- Cascarina S.M., Ross E.D. A proposed role for the SARS-CoV-2 nucleocapsid protein in the formation and regulation of biomolecular condensates. FASEB J. 2020;34:9832–9842. doi: 10.1096/fj.202001351. [DOI] [PMC free article] [PubMed] [Google Scholar]
- Chang C.K., Hou M.H., Chang C.F., Hsiao C.D., Huang T.H. The SARS coronavirus nucleocapsid protein - forms and functions. Antiviral Res. 2014;103:39–50. doi: 10.1016/j.antiviral.2013.12.009. [DOI] [PMC free article] [PubMed] [Google Scholar]
- Chen C.Y.A., Shyu A.B. AU-rich elements: characterization and importance in mRNA degradation. Trends Biochem. Sci. 1995;20:465–470. doi: 10.1016/S0968-0004(00)89102-1. [DOI] [PubMed] [Google Scholar]
- Chen H., Cui Y., Han X., Hu W., Sun M., Zhang Y., Wang P.H., Song G., Chen W., Lou J. Liquid–liquid phase separation by SARS-CoV-2 nucleocapsid protein and RNA. Cell Res. 2020;30:1143–1145. doi: 10.1038/s41422-020-00408-2. [DOI] [PMC free article] [PubMed] [Google Scholar]
- Cline M.S., Smoot M., Cerami E., Kuchinsky A., Landys N., Workman C., Christmas R., Avila-Campilo I., Creech M., Gross B., et al. Integration of biological networks and gene expression data using Cytoscape. Nat. Protoc. 2007;2:2366–2382. doi: 10.1038/nprot.2007.324. [DOI] [PMC free article] [PubMed] [Google Scholar]
- Corbet G.A., Parker R. RNP granule formation: lessons from P-bodies and stress granules. Cold Spring Harb. Symp. Quant. Biol. 2019;84:203–215. doi: 10.1101/sqb.2019.84.040329. [DOI] [PubMed] [Google Scholar]
- Dauber B., Wolff T. Activation of the antiviral kinase PKR and viral countermeasures. Viruses. 2009;1:523. doi: 10.3390/V1030523. [DOI] [PMC free article] [PubMed] [Google Scholar]
- de Breyne S., Vindry C., Guillin O., Condé L., Mure F., Gruffat H., Chavatte L., Ohlmann T. Translational control of coronaviruses. Nucleic Acids Res. 2020;48:12502–12522. doi: 10.1093/NAR/GKAA1116. [DOI] [PMC free article] [PubMed] [Google Scholar]
- Dobin A., Davis C.A., Schlesinger F., Drenkow J., Zaleski C., Jha S., Batut P., Chaisson M., Gingeras T.R. STAR: ultrafast universal RNA-seq aligner. Bioinformatics. 2013;29:15–21. doi: 10.1093/bioinformatics/bts635. [DOI] [PMC free article] [PubMed] [Google Scholar]
- Edupuganti R.R., Geiger S., Lindeboom R.G.H., Shi H., Hsu P.J., Lu Z., Wang S.Y., Baltissen M.P.A., Jansen P.W.T.C., Rossa M., et al. N6-methyladenosine (m6A) recruits and repels proteins to regulate mRNA homeostasis. Nat. Struct. Mol. Biol. 2017;24:870–878. doi: 10.1038/nsmb.3462. [DOI] [PMC free article] [PubMed] [Google Scholar]
- Elkon R., Ugalde A.P., Agami R. Alternative cleavage and polyadenylation: extent, regulation and function. Nat. Rev. Genet. 2013;14:496–506. doi: 10.1038/nrg3482. [DOI] [PubMed] [Google Scholar]
- Flynn R.A., Belk J.A., Qi Y., Yasumoto Y., Wei J., Alfajaro M.M., Shi Q., Mumbach M.R., Limaye A., DeWeirdt P.C., et al. Discovery and functional interrogation of SARS-CoV-2 RNA-host protein interactions. Cell. 2021;184:2394–2411.e16. doi: 10.1016/J.CELL.2021.03.012. [DOI] [PMC free article] [PubMed] [Google Scholar]
- Forman-Kay J.D., Kriwacki R.W., Seydoux G. Phase separation in biology and disease. J. Mol. Biol. 2018;430:4603–4606. doi: 10.1016/j.jmb.2018.09.006. [DOI] [PMC free article] [PubMed] [Google Scholar]
- Fournier M.J., Gareau C., Mazroui R. The chemotherapeutic agent bortezomib induces the formation of stress granules. Cancer Cell Int. 2010;10:1–10. doi: 10.1186/1475-2867-10-12. [DOI] [PMC free article] [PubMed] [Google Scholar]
- Frankish A., Diekhans M., Ferreira A.M., Johnson R., Jungreis I., Loveland J., Mudge J.M., Sisu C., Wright J., Armstrong J., et al. GENCODE reference annotation for the human and mouse genomes. Nucleic Acids Res. 2019;47:D766–D773. doi: 10.1093/nar/gky955. [DOI] [PMC free article] [PubMed] [Google Scholar]
- Gao B., Gong X., Fang S., Weng W., Wang H., Chu H., Sun Y., Meng C., Tan L., Song C., et al. Inhibition of anti-viral stress granule formation by coronavirus endoribonuclease nsp15 ensures efficient virus replication. PLoS Pathog. 2021;17:e1008690. doi: 10.1371/JOURNAL.PPAT.1008690. [DOI] [PMC free article] [PubMed] [Google Scholar]
- Gao X., Jiang L., Gong Y., Chen X., Ying M., Zhu H., He Q., Yang B., Cao J. Stress granule: a promising target for cancer treatment. Br. J. Pharmacol. 2019;176:4421–4433. doi: 10.1111/bph.14790. [DOI] [PMC free article] [PubMed] [Google Scholar]
- Garcia-Moreno M., Noerenberg M., Ni S., Järvelin A.I., González-Almela E., Lenz C.E., Bach-Pages M., Cox V., Avolio R., Davis T., et al. System-wide profiling of RNA-binding proteins uncovers key regulators of virus infection. Mol. Cell. 2019;74:196–211.e11. doi: 10.1016/j.molcel.2019.01.017. [DOI] [PMC free article] [PubMed] [Google Scholar]
- Ge S.X., Jung D., Jung D., Yao R. ShinyGO: a graphical gene-set enrichment tool for animals and plants. Bioinformatics. 2020;36:2628–2629. doi: 10.1093/bioinformatics/btz931. [DOI] [PMC free article] [PubMed] [Google Scholar]
- Gordon D.E., Hiatt J., Bouhaddou M., Rezelj V.V., Ulferts S., Braberg H., Jureka A.S., Obernier K., Guo J.Z., Batra J., et al. Comparative host-coronavirus protein interaction networks reveal pan-viral disease mechanisms. Science. 2020;370:eabe9403. doi: 10.1126/science.abe9403. [DOI] [PMC free article] [PubMed] [Google Scholar]
- Gordon D.E., Jang G.M., Bouhaddou M., Xu J., Obernier K., White K.M., O’Meara M.J., Rezelj V.V., Guo J.Z., Swaney D.L., et al. A SARS-CoV-2 protein interaction map reveals targets for drug repurposing. Nature. 2020;583:459–468. doi: 10.1038/s41586-020-2286-9. [DOI] [PMC free article] [PubMed] [Google Scholar]
- Gray J.J., Moughon S., Wang C., Schueler-Furman O., Kuhlman B., Rohl C.A., Baker D. Protein-protein docking with simultaneous optimization of rigid-body displacement and side-chain conformations. J. Mol. Biol. 2003;331:281–299. doi: 10.1016/S0022-2836(03)00670-3. [DOI] [PubMed] [Google Scholar]
- Guo L., Sharma S.D., Debes J., Beisang D., Rattenbacher B., Louis I.V.S., Wiesner D.L., Cameron C.E., Bohjanen P.R. The hepatitis C viral nonstructural protein 5A stabilizes growth-regulatory human transcripts. Nucleic Acids Res. 2018;46:2537–2547. doi: 10.1093/nar/gky061. [DOI] [PMC free article] [PubMed] [Google Scholar]
- Guo L., Smith J.A., Abelson M., VIasova-St. Louis I., Schiff L.A., Bohjanen P.R. Reovirus infection induces stabilization and up-regulation of cellular transcripts that encode regulators of TGF-β signaling. PLoS One. 2018;13:e0204622. doi: 10.1371/journal.pone.0204622. [DOI] [PMC free article] [PubMed] [Google Scholar]
- Ha K.C.H., Blencowe B.J., Morris Q. QAPA: a new method for the systematic analysis of alternative polyadenylation from RNA-seq data. Genome Biol. 2018;19:45. doi: 10.1186/s13059-018-1414-4. [DOI] [PMC free article] [PubMed] [Google Scholar]
- Han H., Braunschweig U., Gonatopoulos-pournatzis T., Wrana J.L., Moffat J., Blencowe B.J., Han H., Braunschweig U., Gonatopoulos-pournatzis T., Weatheritt R.J., et al. Multilayered control of alternative splicing regulatory networks by transcription factors resource multilayered control of alternative splicing regulatory networks by transcription factors. Mol. Cell. 2017;65:539–553.e7. doi: 10.1016/j.molcel.2017.01.011. [DOI] [PubMed] [Google Scholar]
- Hekman R.M., Hume A.J., Goel R.K., Abo K.M., Huang J., Blum B.C., Werder R.B., Suder E.L., Paul I., Phanse S., et al. Actionable cytopathogenic host responses of human alveolar type 2 cells to SARS-CoV-2. Mol. Cell. 2020;80:1104–1122.e9. doi: 10.1016/j.molcel.2020.11.028. [DOI] [PMC free article] [PubMed] [Google Scholar]
- Herzel L., Ottoz D.S.M., Alpert T., Neugebauer K.M. Splicing and transcription touch base: Co-transcriptional spliceosome assembly and function. Nat. Rev. Mol. Cell Biol. 2017;18:637–650. doi: 10.1038/nrm.2017.63. [DOI] [PMC free article] [PubMed] [Google Scholar]
- Hou S., Kumar A., Xu Z., Airo A.M., Stryapunina I., Wong C.P., Branton W., Tchesnokov E., Götte M., Power C., Hobman T.C. Zika virus hijacks stress granule proteins and modulates the host stress response. J. Virol. 2017;91:e00474-17. doi: 10.1128/JVI. [DOI] [PMC free article] [PubMed] [Google Scholar]
- Hubstenberger A., Courel M., Bénard M., Souquere S., Ernoult-Lange M., Chouaib R., Yi Z., Morlot J.B., Munier A., Fradet M., et al. P-body purification reveals the condensation of repressed mRNA regulons. Mol. Cell. 2017;68:144–157.e5. doi: 10.1016/j.molcel.2017.09.003. [DOI] [PubMed] [Google Scholar]
- Huppertz I., Attig J., D’Ambrogio A., Easton L.E., Sibley C.R., Sugimoto Y., Tajnik M., König J., Ule J. iCLIP: protein-RNA interactions at nucleotide resolution. Methods. 2014;65:274–287. doi: 10.1016/j.ymeth.2013.10.011. [DOI] [PMC free article] [PubMed] [Google Scholar]
- Iserman C., Roden C.A., Boerneke M.A., Sealfon R.S.G., McLaughlin G.A., Jungreis I., Fritch E.J., Hou Y.J., Ekena J., Weidmann C.A., et al. Genomic RNA elements drive phase separation of the SARS-CoV-2 nucleocapsid. Mol. Cell. 2020;80:1078–1091.e6. doi: 10.1016/j.molcel.2020.11.041. [DOI] [PMC free article] [PubMed] [Google Scholar]
- Jack A., Ferro L.S., Trnka M.J., Wehri E., Nadgir A., Nguyenla X., Fox D., Costa K., Stanley S., Schaletzky J., Yildiz A. SARS-CoV-2 nucleocapsid protein forms condensates with viral genomic RNA. PLoS Biol. 2021;19:e3001425. doi: 10.1371/JOURNAL.PBIO.3001425. [DOI] [PMC free article] [PubMed] [Google Scholar]
- Jia Y., Jucius T.J., Cook S.A., Ackerman S.L. Loss of Clcc1 results in ER stress, misfolded protein accumulation, and neurodegeneration. J. Neurosci. 2015;35:3001–3009. doi: 10.1523/JNEUROSCI.3678-14.2015. [DOI] [PMC free article] [PubMed] [Google Scholar]
- Jindal S., Malkovsky M. Stress responses to viral infection. Trends Microbiol. 1994;2:89–91. doi: 10.1016/0966-842X(94)90540-1. [DOI] [PubMed] [Google Scholar]
- Kaehler C., Isensee J., Nonhoff U., Terrey M., Hucho T., Lehrach H., Krobitsch S. Ataxin-2-Like is a regulator of stress granules and processing bodies. PLoS One. 2012;7:e50134. doi: 10.1371/journal.pone.0050134. [DOI] [PMC free article] [PubMed] [Google Scholar]
- Kang S., Yang M., Hong Z., Zhang L., Huang Z., Chen X., He S., Zhou Z., Zhou Z., Chen Q., et al. Crystal structure of SARS-CoV-2 nucleocapsid protein RNA binding domain reveals potential unique drug targeting sites. Acta Pharm. Sin. B. 2020;10:1228–1238. doi: 10.1016/j.apsb.2020.04.009. [DOI] [PMC free article] [PubMed] [Google Scholar]
- Kedersha N., Panas M.D., Achorn C.A., Lyons S., Tisdale S., Hickman T., Thomas M., Lieberman J., McInerney G.M., Ivanov P., Anderson P. G3BP-Caprin1-USP10 complexes mediate stress granule condensation and associate with 40S subunits. J. Cell Biol. 2016;212:845–860. doi: 10.1083/jcb.201508028. [DOI] [PMC free article] [PubMed] [Google Scholar]
- Kim D.K., Knapp J.J., Kuang D., Chawla A., Cassonnet P., Lee H., Sheykhkarimli D., Samavarchi-Tehrani P., Abdouni H., Rayhan A., et al. A comprehensive, flexible collection of SARS-CoV-2 coding regions. G3 Genes Genomes Genet. 2020;10:3399–3402. doi: 10.1534/g3.120.401554. [DOI] [PMC free article] [PubMed] [Google Scholar]
- Kim D.Y., Reynaud J.M., Rasalouskaya A., Akhrymuk I., Mobley J.A., Frolov I., Frolova E.I. New world and old world alphaviruses have evolved to exploit different components of stress granules, FXR and G3BP proteins, for assembly of viral replication complexes. PLoS Pathog. 2016;12:e1005810. doi: 10.1371/journal.ppat.1005810. [DOI] [PMC free article] [PubMed] [Google Scholar]
- Knight J.D.R., Choi H., Gupta G.D., Pelletier L., Raught B., Nesvizhskii A.I., Gingras A.C. ProHits-viz: a suite of web tools for visualizing interaction proteomics data. Nat. Methods. 2017;14:645–646. doi: 10.1038/nmeth.4330. [DOI] [PMC free article] [PubMed] [Google Scholar]
- Krakau S., Richard H., Marsico A. PureCLIP: capturing target-specific protein–RNA interaction footprints from single-nucleotide CLIP-seq data. Genome Biol. 2017;18:240. doi: 10.1186/s13059-017-1364-2. [DOI] [PMC free article] [PubMed] [Google Scholar]
- Kumar S., Stecher G., Tamura K. MEGA7: molecular evolutionary genetics analysis version 7.0 for bigger datasets. Mol. Biol. Evol. 2016;33:1870–1874. doi: 10.1093/molbev/msw054. [DOI] [PMC free article] [PubMed] [Google Scholar]
- Kuroshima T., Aoyagi M., Yasuda M., Kitamura T., Jehung J.P., Ishikawa M., Kitagawa Y., Totsuka Y., Shindoh M., Higashino F. Viral-mediated stabilization of AU-rich element containing mRNA contributes to cell transformation. Oncogene. 2011;30:2912–2920. doi: 10.1038/onc.2011.14. [DOI] [PubMed] [Google Scholar]
- Laver J.D., Ly J., Winn A.K., Karaiskakis A., Lin S., Nie K., Benic G., Jaberi-Lashkari N., Cao W.X., Khademi A., et al. The RNA-binding protein Rasputin/G3BP enhances the stability and translation of its target mRNAs. Cell Rep. 2020;30:3353–3367.e7. doi: 10.1016/j.celrep.2020.02.066. [DOI] [PubMed] [Google Scholar]
- Lee S., Lee Y., Choi Y., Son A., Park Y., Lee K.-M., Kim J., Kim J.-S., Kim V.N. The SARS-CoV-2 RNA interactome. Mol. Cell. 2021;81:2838–2850.e6. doi: 10.1016/J.MOLCEL.2021.04.022. [DOI] [PMC free article] [PubMed] [Google Scholar]
- Li J., Guo M., Tian X., Wang X., Yang X., Wu P., Liu C., Xiao Z., Qu Y., Yin Y., et al. Virus-host interactome and proteomic survey reveal potential virulence factors influencing SARS-CoV-2 pathogenesis. Med. 2020;2:99–112.e7. doi: 10.1016/j.medj.2020.07.002. [DOI] [PMC free article] [PubMed] [Google Scholar]
- Lin Z., Wu Z., Mai J., Zhou L., Qian Y., Cai T., Chen Z., Wang P., Lin B. The nucleocapsid protein of SARS-CoV-2 abolished pluripotency in human induced pluripotent stem cells. bioRxiv. 2020 doi: 10.1101/2020.03.26.010694. [DOI] [Google Scholar]
- Liu S.J., Leng C.H., Lien S.P., Chi H.Y., Huang C.Y., Lin C.L., Lian W.C., Chen C.J., Hsieh S.L., Chong P. Immunological characterizations of the nucleocapsid protein based SARS vaccine candidates. Vaccine. 2006;24:3100–3108. doi: 10.1016/j.vaccine.2006.01.058. [DOI] [PMC free article] [PubMed] [Google Scholar]
- Liu W., Liu L., Kou G., Zheng Y., Ding Y., Ni W., Wang Q., Tan L., Wu W., Tang S., et al. Evaluation of nucleocapsid and spike protein-based enzyme-linked immunosorbent assays for detecting antibodies against SARS-CoV-2. J. Clin. Microbiol. 2020;58:e00461-20. doi: 10.1128/JCM.00461-20. [DOI] [PMC free article] [PubMed] [Google Scholar]
- Livak K.J., Schmittgen T.D. Analysis of relative gene expression data using real-time quantitative PCR and the 2-ΔΔCT method. Methods. 2001;25:402–408. doi: 10.1006/meth.2001.1262. [DOI] [PubMed] [Google Scholar]
- Love M.I., Huber W., Anders S. Moderated estimation of fold change and dispersion for RNA-seq data with DESeq2. Genome Biol. 2014;15:550. doi: 10.1186/s13059-014-0550-8. [DOI] [PMC free article] [PubMed] [Google Scholar]
- Lu L., Han A.-P., Chen J.-J. Translation initiation control by heme-regulated eukaryotic initiation factor 2α kinase in erythroid cells under cytoplasmic stresses. Mol. Cell. Biol. 2001;21:7971–7980. doi: 10.1128/MCB.21.23.7971-7980.2001. [DOI] [PMC free article] [PubMed] [Google Scholar]
- Lu S., Ye Q., Singh D., Cao Y., Diedrich J.K., Yates J.R., Villa E., Cleveland D.W., Corbett K.D. The SARS-CoV-2 nucleocapsid phosphoprotein forms mutually exclusive condensates with RNA and the membrane-associated M protein. Nat. Commun. 2021;12:1–15. doi: 10.1038/s41467-020-20768-y. [DOI] [PMC free article] [PubMed] [Google Scholar]
- Lum K.K., Cristea I.M. Proteomic approaches to uncovering virus-host protein interactions during the progression of viral infection. Expert Rev. Proteomics. 2016;13:325–340. doi: 10.1586/14789450.2016.1147353. [DOI] [PMC free article] [PubMed] [Google Scholar]
- Luo L., Li Z., Zhao T., Ju X., Ma P., Jin B., Zhou Y., He S., Huang J., Xu X., et al. SARS-CoV-2 nucleocapsid protein phase separates with G3BPs to disassemble stress granules and facilitate viral production. Sci. Bull. 2021;66:1194–1204. doi: 10.1016/j.scib.2021.01.013. [DOI] [PMC free article] [PubMed] [Google Scholar]
- Marcon E., Ni Z., Pu S., Turinsky A.L., Trimble S.S., Olsen J.B., Silverman-Gavrila R., Silverman-Gavrila L., Phanse S., Guo H., et al. Human-chromatin-related protein interactions identify a demethylase complex required for chromosome segregation. Cell Rep. 2014;8:297–310. doi: 10.1016/j.celrep.2014.05.050. [DOI] [PubMed] [Google Scholar]
- Martin M. Cutadapt removes adapter sequences from high-throughput sequencing reads. EMBnet. J. 2011;17:10. doi: 10.14806/ej.17.1.200. [DOI] [Google Scholar]
- Martin S., Bellora N., González-Vallinas J., Irimia M., Chebli K., de Toledo M., Raabe M., Eyras E., Urlaub H., Blencowe B.J., Tazi J. Preferential binding of a stable G3BP ribonucleoprotein complex to intron-retaining transcripts in mouse brain and modulation of their expression in the cerebellum. J. Neurochem. 2016;139:349–368. doi: 10.1111/jnc.13768. [DOI] [PubMed] [Google Scholar]
- Matsuki H., Takahashi M., Higuchi M., Makokha G.N., Oie M., Fujii M. Both G3BP1 and G3BP2 contribute to stress granule formation. Genes Cells. 2013;18:135–146. doi: 10.1111/gtc.12023. [DOI] [PubMed] [Google Scholar]
- McBride R., van Zyl M., Fielding B. The coronavirus nucleocapsid is a multifunctional protein. Viruses. 2014;6:2991–3018. doi: 10.3390/v6082991. [DOI] [PMC free article] [PubMed] [Google Scholar]
- Nabeel-Shah S., Lee H., Ahmed N., Marcon E., Farhangmehr S., Pu S., Burke G.L., Ashraf K., Wei H., Zhong G., et al. SARS-CoV-2 nucleocapsid protein attenuates stress granule formation and alters gene expression via direct interaction with host mRNAs. bioRxiv. 2020 doi: 10.1101/2020.10.23.342113. [DOI] [Google Scholar]
- Nakagawa K., Narayanan K., Wada M., Makino S. Inhibition of stress granule formation by Middle East respiratory syndrome coronavirus 4a accessory protein facilitates viral translation, leading to efficient virus replication. J. Virol. 2018;92 doi: 10.1128/jvi.00902-18. e00902-18. [DOI] [PMC free article] [PubMed] [Google Scholar]
- Nostrand E.L.V., Pratt G.A., Shishkin A.A., Gelboin-burkhart C., Fang M.Y., Sundararaman B., Blue S.M., Nguyen T.B., Surka C., Elkins K., et al. Robust transcriptome-wide discovery of RNA-binding protein binding sites with enhanced CLIP ( eCLIP ) Nat. Methods. 2016;13:508–514. doi: 10.1038/nmeth.3810. [DOI] [PMC free article] [PubMed] [Google Scholar]
- Novoa R.R., Calderita G., Arranz R., Fontana J., Granzow H., Risco C. Virus factories: associations of cell organelles for viral replication and morphogenesis. Biol. Cell. 2005;97:147–172. doi: 10.1042/bc20040058. [DOI] [PMC free article] [PubMed] [Google Scholar]
- Olarerin-George A.O., Jaffrey S.R. MetaPlotR: a Perl/R pipeline for plotting metagenes of nucleotide modifications and other transcriptomic sites. Bioinformatics. 2017;33:1563–1564. doi: 10.1093/bioinformatics/btx002. [DOI] [PMC free article] [PubMed] [Google Scholar]
- Panas M.D., Ivanov P., Anderson P. Mechanistic insights into mammalian stress granule dynamics. J. Cell Biol. 2016;215:313–323. doi: 10.1083/jcb.201609081. [DOI] [PMC free article] [PubMed] [Google Scholar]
- Panas M.D., Kedersha N., Schulte T., Branca R.M., Ivanov P., Anderson P. Phosphorylation of G3BP1-S149 does not influence stress granule assembly. J. Cell Biol. 2019;218:2425–2432. doi: 10.1083/jcb.201801214. [DOI] [PMC free article] [PubMed] [Google Scholar]
- Perdikari T.M., Murthy A.C., Ryan V.H., Watters S., Naik M.T., Fawzi N.L. SARS-CoV-2 nucleocapsid protein phase-separates with RNA and with human hnRNPs. EMBO J. 2020;39:e106478. doi: 10.15252/embj.2020106478. [DOI] [PMC free article] [PubMed] [Google Scholar]
- Quinlan A.R., Hall I.M. BEDTools: a flexible suite of utilities for comparing genomic features. Bioinformatics. 2010;26:841–842. doi: 10.1093/bioinformatics/btq033. [DOI] [PMC free article] [PubMed] [Google Scholar]
- Rabouw H.H., Langereis M.A., Knaap R.C.M., Dalebout T.J., Canton J., Sola I., Enjuanes L., Bredenbeek P.J., Kikkert M., de Groot R.J., van Kuppeveld F.J.M. Middle East respiratory coronavirus accessory protein 4a inhibits PKR-mediated antiviral stress responses. PLoS Pathog. 2016;12:e1005982. doi: 10.1371/journal.ppat.1005982. [DOI] [PMC free article] [PubMed] [Google Scholar]
- Reineke L.C., Tsai W.-C., Jain A., Kaelber J.T., Jung S.Y., Lloyd R.E. Casein kinase 2 is linked to stress granule dynamics through phosphorylation of the stress granule nucleating protein G3BP1. Mol. Cell. Biol. 2017;37:e00596-16. doi: 10.1128/mcb.00596-16. [DOI] [PMC free article] [PubMed] [Google Scholar]
- Remmert M., Biegert A., Hauser A., Söding J. HHblits: lightning-fast iterative protein sequence searching by HMM-HMM alignment. Nat. Methods. 2012;9:173–175. doi: 10.1038/nmeth.1818. [DOI] [PubMed] [Google Scholar]
- Robinson C.A., Kleer M., Mulloy R.P., Castle E.L., Boudreau B.Q., Corcoran J.A. Human coronaviruses disassemble processing bodies. bioRxiv. 2020 doi: 10.1101/2020.11.08.372995. [DOI] [PMC free article] [PubMed] [Google Scholar]
- Saikatendu K.S., Joseph J.S., Subramanian V., Neuman B.W., Buchmeier M.J., Stevens R.C., Kuhn P. Ribonucleocapsid formation of severe acute respiratory syndrome coronavirus through molecular action of the N-terminal domain of N protein. J. Virol. 2007;81:3913–3921. doi: 10.1128/jvi.02236-06. [DOI] [PMC free article] [PubMed] [Google Scholar]
- Samavarchi-Tehrani P., Abdouni H., Knight J.D.R., Astori A., Samson R., Lin Z.Y., Kim D.K., Knapp J.J., St-Germain J., Go C.D., et al. A SARS-CoV-2 – host proximity interactome. bioRxiv. 2020 doi: 10.1101/2020.09.03.282103. [DOI] [Google Scholar]
- Sanders D.W., Kedersha N., Lee D.S.W., Strom A.R., Drake V., Riback J.A., Bracha D., Eeftens J.M., Iwanicki A., Wang A., et al. Competing protein-RNA interaction networks control multiphase intracellular organization. Cell. 2020;181:306–324.e28. doi: 10.1016/j.cell.2020.03.050. [DOI] [PMC free article] [PubMed] [Google Scholar]
- Savastano A., Ibáñez de Opakua A., Rankovic M., Zweckstetter M. Nucleocapsid protein of SARS-CoV-2 phase separates into RNA-rich polymerase-containing condensates. Nat. Commun. 2020;11:1–10. doi: 10.1038/s41467-020-19843-1. [DOI] [PMC free article] [PubMed] [Google Scholar]
- Schmidt N., Lareau C.A., Keshishian H., Ganskih S., Schneider C., Hennig T., Melanson R., Werner S., Wei Y., Zimmer M., et al. The SARS-CoV-2 RNA–protein interactome in infected human cells. Nat. Microbiol. 2020;6:339–353. doi: 10.1038/s41564-020-00846-z. [DOI] [PMC free article] [PubMed] [Google Scholar]
- Schmitges F.W., Radovani E., Najafabadi H.S., Barazandeh M., Campitelli L.F., Yin Y., Jolma A., Zhong G., Guo H., Kanagalingam T., et al. Multiparameter functional diversity of human C2H2 zinc finger proteins. Genome Res. 2016;26:1742–1752. doi: 10.1101/gr.209643.116. [DOI] [PMC free article] [PubMed] [Google Scholar]
- Smith T., Heger A., Sudbery I. UMI-tools: modeling sequencing errors in Unique Molecular Identifiers to improve quantification accuracy. Genome Res. 2017;27:491–499. doi: 10.1101/gr.209601.116. [DOI] [PMC free article] [PubMed] [Google Scholar]
- Stukalov A., Girault V., Grass V., Karayel O., Bergant V., Urban C., Haas D.A., Huang Y., Oubraham L., Wang A., et al. Multilevel proteomics reveals host perturbations by SARS-CoV-2 and SARS-CoV. Nature. 2021;594:246–252. doi: 10.1038/s41586-021-03493-4. [DOI] [PubMed] [Google Scholar]
- Tapial J., Ha K.C.H., Sterne-Weiler T., Gohr A., Braunschweig U., Hermoso-Pulido A., Quesnel-Vallières M., Permanyer J., Sodaei R., Marquez Y., et al. An atlas of alternative splicing profiles and functional associations reveals new regulatory programs and genes that simultaneously express multiple major isoforms. Genome Res. 2017;27:1759–1768. doi: 10.1101/gr.220962.117. [DOI] [PMC free article] [PubMed] [Google Scholar]
- Teo G., Liu G., Zhang J., Nesvizhskii A.I., Gingras A.-C., Choi H. SAINTexpress: improvements and additional features in significance analysis of INTeractome software. J. Proteomics. 2014;100:37–43. doi: 10.1016/j.jprot.2013.10.023. [DOI] [PMC free article] [PubMed] [Google Scholar]
- Tourrière H., Chebli K., Zekri L., Courselaud B., Blanchard J.M., Bertrand E., Tazi J. The RasGAP-associated endoribonuclease G3BP assembles stress granules. J. Cell Biol. 2003;160:823–831. doi: 10.1083/jcb.200212128. [DOI] [PMC free article] [PubMed] [Google Scholar] [Retracted]
- Tourrière H., Gallouzi I., Chebli K., Capony J.P., Mouaikel J., van der Geer P., Tazi J. RasGAP-associated endoribonuclease G3BP: selective RNA degradation and phosphorylation-dependent localization. Mol. Cell. Biol. 2001;21:7747–7760. doi: 10.1128/mcb.21.22.7747-7760.2001. [DOI] [PMC free article] [PubMed] [Google Scholar]
- Tyanova S., Temu T., Cox J. The MaxQuant computational platform for mass spectrometry-based shotgun proteomics. Nat. Protoc. 2016;11:2301–2319. doi: 10.1038/nprot.2016.136. [DOI] [PubMed] [Google Scholar]
- Vlasova I.A., Tahoe N.M., Fan D., Larsson O., Rattenbacher B., SternJohn J.R., Vasdewani J., Karypis G., Reilly C.S., Bitterman P.B., Bohjanen P.R. Conserved GU-rich elements mediate mRNA decay by binding to CUG-binding protein 1. Mol. Cell. 2008;29:263–270. doi: 10.1016/j.molcel.2007.11.024. [DOI] [PMC free article] [PubMed] [Google Scholar]
- Vognsen T., Møller I.R., Kristensen O. Crystal structures of the human G3BP1 NTF2-like domain visualize FxFG Nup repeat specificity. PLoS One. 2013;8:e80947. doi: 10.1371/journal.pone.0080947. [DOI] [PMC free article] [PubMed] [Google Scholar]
- von Roretz C., di Marco S., Mazroui R., Gallouzi I.E. Turnover of AU-rich-containing mRNAs during stress: a matter of survival. Wiley Interdiscip. Rev. RNA. 2011;2:336–347. doi: 10.1002/wrna.55. [DOI] [PubMed] [Google Scholar]
- Wada M., Lokugamage K.G., Nakagawa K., Narayanan K., Makino S. Interplay between coronavirus, a cytoplasmic RNA virus, and nonsense-mediated mRNA decay pathway. Proc. Natl. Acad. Sci. U S A. 2018;115:E10157–E10166. doi: 10.1073/pnas.1811675115. [DOI] [PMC free article] [PubMed] [Google Scholar]
- Wang F., Li J., Fan S., Jin Z., Huang C. Targeting stress granules: a novel therapeutic strategy for human diseases. Pharmacol. Res. 2020;161:105143. doi: 10.1016/j.phrs.2020.105143. [DOI] [PMC free article] [PubMed] [Google Scholar]
- Wang J., Shi C., Xu Q., Yin H. SARS-CoV-2 nucleocapsid protein undergoes liquid–liquid phase separation into stress granules through its N-terminal intrinsically disordered region. Cell Discov. 2021;7:5. doi: 10.1038/s41421-020-00240-3. [DOI] [PMC free article] [PubMed] [Google Scholar]
- Wang Q., Zhang Y., Wu L., Niu S., Song C., Zhang Z., Lu G., Qiao C., Hu Y., Yuen K.Y., et al. Structural and functional basis of SARS-CoV-2 entry by using human ACE2. Cell. 2020;181:894–904.e9. doi: 10.1016/j.cell.2020.03.045. [DOI] [PMC free article] [PubMed] [Google Scholar]
- White J.P., Lloyd R.E. Regulation of stress granules in virus systems. Trends Microbiol. 2012;20:175–183. doi: 10.1016/j.tim.2012.02.001. [DOI] [PMC free article] [PubMed] [Google Scholar]
- Yan Y., Tao H., He J., Huang S.Y. The HDOCK server for integrated protein–protein docking. Nat. Protoc. 2020;15:1829–1852. doi: 10.1038/s41596-020-0312-x. [DOI] [PubMed] [Google Scholar]
- Yang J., Anishchenko I., Park H., Peng Z., Ovchinnikov S., Baker D. Improved protein structure prediction using predicted interresidue orientations. Proc. Natl. Acad. Sci. U S A. 2020;117:1496–1503. doi: 10.1073/pnas.1914677117. [DOI] [PMC free article] [PubMed] [Google Scholar]
- Yang P., Mathieu C., Kolaitis R.-M., Mittag T., Kim H.J., Paul J., Correspondence T. G3BP1 is a tunable switch that triggers phase separation to assemble stress granules. Cell. 2020;181:325–345.e28. doi: 10.1016/j.cell.2020.03.046. [DOI] [PMC free article] [PubMed] [Google Scholar]
- Yang W., Ru Y., Ren J., Bai J., Wei J., Fu S., Liu X., Li D., Zheng H. G3BP1 inhibits RNA virus replication by positively regulating RIG-I-mediated cellular antiviral response. Cell Death Dis. 2019;10:1–15. doi: 10.1038/s41419-019-2178-9. [DOI] [PMC free article] [PubMed] [Google Scholar]
- Ye Q., West A.M.V., Silletti S., Corbett K.D. Architecture and self-assembly of the SARS-CoV-2 nucleocapsid protein. Protein Sci. 2020;29:1890–1901. doi: 10.1002/pro.3909. [DOI] [PMC free article] [PubMed] [Google Scholar]
- Youn J.Y., Dyakov B.J.A., Zhang J., Knight J.D.R., Vernon R.M., Forman-Kay J.D., Gingras A.C. Properties of stress granule and P-body proteomes. Mol. Cell. 2019;76:286–294. doi: 10.1016/j.molcel.2019.09.014. [DOI] [PubMed] [Google Scholar]
- Yu G., Wang L.G., Han Y., He Q.Y. ClusterProfiler: an R package for comparing biological themes among gene clusters. Omics J. Integr. Biol. 2012;16:284–287. doi: 10.1089/omi.2011.0118. [DOI] [PMC free article] [PubMed] [Google Scholar]
- Zeng W., Liu G., Ma H., Zhao D., Yang Y., Liu M., Mohammed A., Zhao C., Yang Y., Xie J., et al. Biochemical characterization of SARS-CoV-2 nucleocapsid protein. Biochem. Biophys. Res. Commun. 2020;527:618–623. doi: 10.1016/j.bbrc.2020.04.136. [DOI] [PMC free article] [PubMed] [Google Scholar]
- Zhang Q., Sharma N.R., Zheng Z.M., Chen M. Viral regulation of RNA granules in infected cells. Virol. Sin. 2019;34:175–191. doi: 10.1007/s12250-019-00122-3. [DOI] [PMC free article] [PubMed] [Google Scholar]
- Zheng Z.Q., Wang S.Y., Xu Z.S., Fu Y.Z., Wang Y.Y. SARS-CoV-2 nucleocapsid protein impairs stress granule formation to promote viral replication. Cell Discov. 2021;7:1–11. doi: 10.1038/s41421-021-00275-0. [DOI] [PMC free article] [PubMed] [Google Scholar]
- Zhou P., Yang X.L., Wang X.G., Hu B., Zhang L., Zhang W., Si H.R., Zhu Y., Li B., Huang C.L., et al. A pneumonia outbreak associated with a new coronavirus of probable bat origin. Nature. 2020;579:270–273. doi: 10.1038/s41586-020-2012-7. [DOI] [PMC free article] [PubMed] [Google Scholar]
Associated Data
This section collects any data citations, data availability statements, or supplementary materials included in this article.
Supplementary Materials
Data Availability Statement
-
•
All proteomics data produced in this work have been deposited in MassIVE resource (http://massive.ucsd.edu) and has been assigned ID MSV000086704 for SARS-CoV-2 related and MSV000088232 for G3BP1 and G3BP2 AP-MS data. RNA-seq and iCLIP-seq data have been deposited in the Gene Expression Omnibus (GEO) with accession number GSE171010. Accession numbers and direct downloadable links for AP-MS data are provided in Table S22.
-
•
This paper does not report original code.
-
•
Scripts for data analysis are available from the lead contact upon request.